www.elsevier.nlrlocaterfluid
Vapor–liquid equilibria of the binary mixtures
2-butanone q t-pentanol, t-pentanol q butyl acetate and
2-propanol q diethyl ketone at 101.3 kPa
Tsung-Yao Wen, Muoi Tang
1, Yan-Ping Chen
) Department of Chemical Engineering, National Taiwan UniÕersity, Taipei, TaiwanReceived 12 January 1999; accepted 29 April 1999
Abstract
Vapor–liquid equilibria have been measured at 101.3 kPa for three binary mixtures of 2-butanone q t-pentanol, t-pentanol q butyl acetate and 2-propanol q diethyl ketone. The isobaric T–x–y data have been reported and the thermodynamic consistency has been examined. Calculations of the non-ideality of the vapor phase have been made with the second virial coefficients determined by the Tsonopoulos correlation. Various activity coefficient models have been used to correlate the experimental data. Satisfactory results have been obtained and optimally fitted binary parameters are presented. q 1999 Elsevier Science B.V. All rights reserved.
Keywords: Data; Vapor–liquid equilibria; Mixture
1. Introduction
Phase equilibrium data are essential for the design of separation processes. VLE data have been
w x
measured in our laboratory for binary and ternary mixtures 1,2 . The VLE data of three binary mixtures of 2-butanone q t-pentanol, t-pentanol q butyl acetate and 2-propanol q diethyl ketone have been measured at 101.3 kPa in this study. To our knowledge, these data have not been presented in the literature except for the binary mixture of t-pentanol q butyl acetate. An all-glass recirculating still was employed and the equilibrium temperatures and compositions of the coexisting vapor and liquid phases were measured. Various thermodynamic consistency tests were examined for these systems. The experimental data were then correlated by various activity coefficient models.
)
Corresponding author. Tel.: q886-2263-5230; fax: q886-2362-3040; e-mail: ypchen@ccms.ntu.edu.tw
1
Present address: Department of Chemical Engineering, Chinese Culture University, Taipei, Taiwan.
0378-3812r99r$ - see front matter q 1999 Elsevier Science B.V. All rights reserved.
Ž .
2. Experimental section 2.1. Chemicals
All the chemicals were high-purity grade purchased from Merck. All chemicals were used without
Ž .
further purification. No detectable impurities were found in the gas chromatography GC analyses. The purities of all chemicals were better than 99.5 mass%. The pure component properties were measured, and comparisons with literature data are shown in Table 1. The refractive indices of the
Ž .
pure components were measured at 293.15 " 0.1 K by an Abbe refractometer, Atago 3T, with an
Ž .
accuracy of "0.0001. The densities of the pure components were measured at 293.15 " 0.01 K
using an Anton Paar DMA 60r602 density meter with an accuracy of "1.0 = 10y5
g cmy3
.
2.2. Apparatus and procedures
w x
The apparatus used was an all-glass recirculating still described by Paul 3 . This equipment has a side-heating unit which ensures complete mixing of the liquid mixtures. This design also prevents liquid drop entrainment and partial condensation of the vapor phase. A digital quartz thermometer
ŽDMT-610, Tokyo Electrical, Japan , with an accuracy of "0.01 K, was used to measure the.
equilibrium temperatures. The pressure in the still was measured by a mercury barometer. The pressure oscillates slightly which can be observed with a dibutyl phthalate manometer. The experi-mental temperatures were taken at this constant pressure of 101.3 kPa. The accuracy of the pressure control was within "0.05%.
In each experiment, the liquid mixture was heated in the recirculating still at a fixed pressure of 101.3 kPa. Equilibrium was usually reached after 1 h, when the temperatures of the liquid and vapor phases were constant and their difference was within "0.02 K. Samples of the equilibrium phases were then taken at small volumes and were analyzed in a gas chromatograph.
A Shimadzu GC, type 8A, equipped with a thermal conductivity detector, was used to determine the equilibrium compositions. The GC column was made of a 3 m length stainless steel tube of 3 mm diameter and was packed with Porapak Q. The GC response peaks were integrated using a Shimadzu C-R3A integrator. The temperature of the injection port of the GC was maintained at 503.15 K. The oven temperature of the GC was at 483.15 K. Helium gas with a purity of 99.9% was used and the
carrier gas flow rate was 30 cm3rmin. The GC was calibrated using mixtures of known compositions
Table 1
Comparison of the measured normal boiling temperatures, refractive indices, and densities of pure fluids in this work with literature data. The numbers in parentheses are the normal boiling temperatures calculated from the Antoine equation
y3
Ž . Ž . Ž . Ž .
Component Tb K nD 293.15 K r 293.15 K g cm GC purity
Žmass%.
w x w x w x
experimental literature 14 experimental literature 14 experimental literature 14
Ž . 2-Butanone 352.76 352.79 352.73 1.3788 1.3788 0.8053 0.8049 ) 99.5 Ž . t-Pentanol 375.11 375.15 375.41 1.4049 1.4049 0.8088 0.8090 ) 99.7 Ž . Butyl acetate 399.14 399.15 399.04 1.3940 1.3942 0.8821 0.8813 ) 99.9 Ž . 2-Propanol 355.39 355.41 355.38 1.3773 1.3772 0.7854 0.7855 ) 99.9 w x Ž . Diethyl ketone 374.80 374.85 13 375.10 1.3924 1.3923 0.8147 0.8143 ) 99.7
for each binary system. The relationship between peak area and composition was determined for each binary mixture. In the VLE experiments, more than three analyses were made for each liquid or vapor sample, respectively. With these repeated procedures, the accuracy of the equilibrium composition measurements was within "0.001 mole fraction.
3. Results and discussion
VLE have been measured at 101.3 kPa for 2-butanone q t-pentanol, t-pentanol q butyl acetate and 2-propanol q diethyl ketone. The results are shown in Tables 2–4, respectively. The liquid phase
activity coefficients g were calculated by the classical equation:t
sat sat L sat
ˆ
g s f y P r x P f exp V
ž
/
½
Ž
P y P.
rRT5
Ž .
1i i i i i i i i
where f is the fugacity coefficient and x and y are the equilibrium mole fractions in the liquid and
vapor phases, respectively. Psat is the saturated vapor pressure, and VL is the saturated liquid molar
volume.
Table 2
Ž . Ž .
Experimental VLE data for 2-butanone 1 q t-pentanol 2 at 101.3 kPa
Ž . T K x1 y1 g1 g2 352.76 1.0000 1.0000 1.0000 353.66 0.9356 0.9657 1.0014 1.2309 354.37 0.8848 0.9381 1.0060 1.2056 354.92 0.8429 0.9151 1.0124 1.1849 355.09 0.8329 0.9094 1.0128 1.1803 355.98 0.7819 0.8801 1.0157 1.1538 356.49 0.7526 0.8625 1.0179 1.1422 357.04 0.7195 0.8424 1.0223 1.1288 357.72 0.6787 0.8165 1.0285 1.1159 358.22 0.6506 0.7981 1.0330 1.1067 358.76 0.6185 0.7762 1.0395 1.0992 359.53 0.5774 0.7471 1.0468 1.0870 360.11 0.5491 0.7259 1.0509 1.0788 360.92 0.5061 0.6927 1.0618 1.0693 361.63 0.4733 0.6659 1.0685 1.0600 362.31 0.4400 0.6369 1.0772 1.0550 362.89 0.4152 0.6139 1.0815 1.0502 363.80 0.3741 0.5759 1.0960 1.0403 364.35 0.3501 0.5499 1.1323 1.0388 366.55 0.2602 0.4499 1.1359 1.0275 368.38 0.1941 0.3629 1.1651 1.0198 370.23 0.1331 0.2699 1.1986 1.0143 371.37 0.1011 0.2129 1.2054 1.0116 372.08 0.0811 0.1749 1.2103 1.0111 373.30 0.0460 0.1049 1.2368 1.0108 375.11 0.0000 0.0000 1.0000
Table 3
Ž . Ž .
Experimental VLE data for t-pentanol 1 qbutyl acetate 2 at 101.3 kPa
Ž . T K x1 y1 g1 g2 375.11 1.0000 1.0000 1.0000 376.25 0.9389 0.9681 1.0004 1.0579 376.51 0.9208 0.9584 1.0006 1.0551 376.71 0.9068 0.9508 1.0011 1.0535 377.11 0.8799 0.9359 1.0013 1.0509 377.51 0.8536 0.9211 1.0018 1.0472 377.72 0.8398 0.9132 1.0021 1.0455 377.98 0.8239 0.9040 1.0023 1.0432 378.55 0.7878 0.8825 1.0032 1.0397 378.96 0.7626 0.8671 1.0040 1.0371 379.24 0.7453 0.8563 1.0049 1.0358 380.01 0.6998 0.8271 1.0067 1.0309 381.14 0.6358 0.7836 1.0103 1.0254 381.92 0.5955 0.7544 1.0114 1.0217 384.08 0.4896 0.6704 1.0172 1.0143 386.45 0.3858 0.5752 1.0247 1.0082 387.37 0.3486 0.5371 1.0280 1.0068 388.31 0.3129 0.4981 1.0304 1.0052 389.32 0.2757 0.4546 1.0333 1.0044 390.71 0.2276 0.3939 1.0379 1.0032 392.06 0.1839 0.3336 1.0428 1.0022 393.36 0.1450 0.2749 1.0469 1.0013 395.26 0.0919 0.1857 1.0525 1.0004 396.31 0.0648 0.1355 1.0551 1.0001 397.35 0.0387 0.0838 1.0587 1.0001 399.14 0.0000 0.0000 1.0000
The fugacity coefficient was calculated using the virial equation of state truncated at the second virial term. The second virial coefficient was determined from the correlation equation according to
w x w x
Tsonopoulos 4 . The critical constants were taken from the literature 5 . At the low pressure
Ž .
condition, the ratio of the fugacity coefficients in Eq. 1 is very close to unity. The vapor pressures of the pure compounds were expressed by the Antoine equation:
sat
log Pi
Ž
kPa s a y b r T K q c.
i iŽ .
iŽ .
2Ž . w x
The constants a, b and c in Eq. 2 were taken from the literature 6 . Values for the various pure
w x
fluids are shown in Table 5. The liquid molar volumes were calculated by the Rackett equation 7 . The calculated activity coefficients for each binary mixture are also listed in Tables 2–4. All binary mixtures show positive deviations. The activity coefficients were used in thermodynamic consistency
w x
test where the method of Kojima et al. 8 was employed. The method includes both the point test and the integral test and has been used in literature to examine the experimental data. In the Kojima’s point test, a parameter d is defined as:
n
< <
d s 100
Ý
d rnjŽ .
3Table 4
Ž . Ž .
Experimental VLE data for 2-propanol 1 qdiethyl ketone 2 at 101.3 kPa
Ž . T K x1 y1 g1 g2 355.39 1.0000 1.0000 1.0000 355.40 0.9655 0.9735 1.0071 1.4564 355.73 0.8812 0.9114 1.0209 1.3903 355.97 0.8465 0.8865 1.0248 1.3644 356.15 0.8023 0.8560 1.0376 1.3325 356.30 0.7715 0.8355 1.0477 1.3083 356.60 0.7327 0.8125 1.0613 1.2600 356.97 0.6895 0.7842 1.0742 1.2307 357.23 0.6540 0.7620 1.0904 1.2058 357.69 0.6182 0.7370 1.0975 1.1875 358.18 0.5745 0.7090 1.1165 1.1583 358.57 0.5359 0.6865 1.1431 1.1282 359.75 0.4478 0.6252 1.1955 1.0877 360.41 0.4062 0.5921 1.2199 1.0762 361.10 0.3684 0.5633 1.2494 1.0585 361.95 0.3246 0.5275 1.2896 1.0412 362.86 0.2845 0.4892 1.3229 1.0313 364.41 0.2254 0.4255 1.3787 1.0193 366.05 0.1749 0.3604 1.4255 1.0117 367.83 0.1304 0.2896 1.4501 1.0093 368.67 0.1075 0.2526 1.4940 1.0086 370.08 0.0784 0.1960 1.5203 1.0073 371.68 0.0482 0.1310 1.5728 1.0059 373.47 0.0199 0.0584 1.6082 1.0054 374.80 0.0000 0.0000 1.0000
the summation is over all the data points where:
d s E DG rRT rE x y ln g rgj
Ž
m.
1Ž
1 2.
y´Ž .
4The free energy change on mixing DGm is calculated by the summation of the activity for each
component in a mixture. The e term is related to the heat of mixing in a constant pressure experiment. An estimated value about 0.03 was used for e in this study which is in the range
Table 5
w x
Pure component properties used in this work. The critical constants and acentric factors were taken from Ref. 5 . The
Ž sat Ž . w Ž . x. w x
parameters in the vapor pressure equation log Pi kPa s a y b r T K q ci i i were taken from Ref. 6
Ž . Ž . Component Tc K Pc kPa v a b C 2-Butanone 535.50 4154 0.324 6.22518 1286.794 y47.766 t-Pentanol 545.15 3880 0.483 6.07488 1075.367 y111.143 Butyl acetate 579.15 3110 0.410 6.13505 1355.816 y70.705 2-Propanol 508.31 4764 0.669 6.61939 1225.439 y89.774 Diethyl ketone 560.95 3739 0.350 6.14917 1309.653 y59.032
Table 6
Consistency test results of the binary VLE experimental data
Ž . Ž . Ž .
Method of test Criterion of 2-butanone 1 q t-pentanol 1 q 2-propanol 1 q
Ž . Ž . Ž .
consistency t-pentanol 2 butyl acetate 2 diethyl ketone 2 Kojima method
Ž .a point test d - 5 3.49 qŽ . 3.10 qŽ . 2.30 qŽ . Ž .b area test A- 3 2.49 qŽ . 3.00 qŽ . 2.21 qŽ . Ž .c infinite dilution test I - 301 26.68 qŽ . 4.47 qŽ . 8.60 qŽ .
Ž . Ž . Ž .
I - 302 13.39 q 7.02 q 4.28 q
w x w x
suggested by Kojima et al. 8 . According to Kojima et al. 8 , d should be less than 5 for thermodynamically consistent data. For the Kojima’s area test, a parameter A is defined as:
1 1
A s 100
H
ln g rgŽ
1 2.
d x q1H
Ž .
´ d x1Ž .
50 0
w x
The criterion for the area test is that A must be less than 3. Kojima et al. 8 also proposed the infinite dilution test. In this test, the following terms were calculated at the infinite dilution conditions:
E G g1 g1 I s 100 y ln ln
Ž .
6 1ž
/
ž
/
ž
/
x x RT1 2 g2 x s0 g2 x s0 x s01 1 1 E G g2 g2 I s 100 y ln lnŽ .
7 2ž
/
ž
/
ž
/
x x RT1 2 g1 x s0 g1 x s0 x s02 2 2In order to satisfy the thermodynamic consistency, both I and I values should be less than 30. Van1 2
w x
Ness 9 also suggested a thermodynamic consistency test method. The activity coefficients
deter-Table 7
Ž . Ž .
Correlation parameters and absolute average deviations in boiling temperature DT and vapor-phase mole fraction D y for the binary mixtures
y1 y1
Ž . Ž . Ž .
Equations A12 cal mol A21 cal mol a12 D y1 DT K
( ) ( ) 2-butanone 1 q t-pentanol 2 Wilson y137.440 352.947 0.0028 0.117 NRTL 222.665 y44.436 0.2 0.0013 0.104 UNIQUAC y188.429 283.989 0.0012 0.119 ( ) ( )
t-pentanol 1 q butyl acetate 2
Wilson y10.583 109.502 0.0006 0.033
NRTL y67.893 118.509 0.2 0.0002 0.010
UNIQUAC y113.801 125.695 0.0001 0.012
( ) ( )
2-propanol 1 q diethyl ketone 2
Wilson 88.586 257.430 0.0024 0.079
NRTL 310.121 98.437 0.2 0.0055 0.188
Ž . Ž . Ž . Ž .
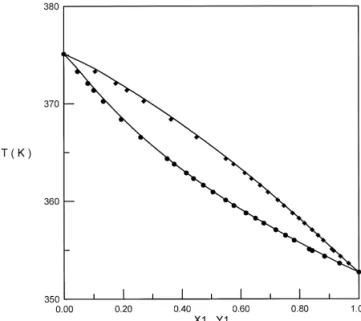
Fig. 1. T – x – y Curve for 2-Butanone 1 q t-Pentanol 2 at 101.3 kPa. — NRTL Model. Experimental Data: v
Ž .
Liquid Phase; l Vapor Phase.
mined from the experiment were fitted by an excess Gibbs free energy function. At each experimental point, the residual between the calculated and experimental activity coefficient ratios was evaluated.
Ž .
The root mean square RMS deviations for the residual values were then determined. According to
w x
Van Ness 9 , the RMS value should be as small as possible. The thermodynamic consistency test results using the Kojima’s method are shown in Table 6. It is demonstrated that all three binary
Ž . Ž . Ž . Ž .
Fig. 2. T – x – y Curve for t-Pentanol 1 q Butyl Acetate 2 at 101.3 kPa. — NRTL Model. Experimental Data: v
Ž .
Ž . Ž . Ž . Ž .
Fig. 3. T – x – y Curve for 2-Propanol 1 q Diethyl Ketone 2 at 101.3 kPa. — NRTL Model. Experimental Data: v
Ž .
Liquid Phase; l Vapor Phase.
systems satisfy the requirements for the various consistency test methods. We also have examined the consistency test using the method of Van Ness with the NRTL model. The RMS errors for all three systems range from 0.01 to 0.05. These results also indicate that the experimental data are satisfactory.
The experimental results were then used to obtain the binary parameters in various activity
w x w x w x
coefficient models. The Wilson 10 , NRTL 11 and UNIQUAC 12 models were used in the regressions. The expressions for the activity coefficients for each model are listed in the literature
w13 . The following objective function was minimized in the regressions:x
2 exp cal gi ygi Q s
Ý Ý
ž
gexp/
Ž .
8 i N iThe regression results are shown in Table 7. The deviations in vapor phase compositions and equilibrium temperatures are reasonably small, and it is indicated that all three activity coefficient models are suitable to represent the binary experimental data. The T–x–y diagrams of these binary systems are shown in Figs. 1–3, respectively. No azeotrope was found for these binary systems. To our knowledge, no isobaric VLE data at 101.3 kPa has been given in the literature for binary mixtures of 2-butanone q t-pentanol and 2-propanol q diethyl ketone. VLE data at 101.3 kPa for the binary
w x
mixture of t-pentanol q butyl acetate have been presented by Gmehling et al. 13 . Only six data points were given with appreciable deviations from correlation. Our experimental data show better thermodynamic consistency as well as correlation results using various activity coefficient models.
4. Conclusion
Vapor–liquid equilibria of three binary mixtures of 2-butanone q t-pentanol, t-pentanol q butyl acetate and 2-propanol q diethyl ketone were measured at 101.3 kPa. The results of all binary
mixtures satisfy the requirements for various thermodynamic consistency tests. Three activity coefficient models have been employed to correlate the experimental data. The correlation results are satisfactory and the deviations in vapor phase compositions and equilibrium temperatures are reasonably small.
5. List of symbols
A parameter in the Kojima’s area test
a, b, c parameters in the vapor pressure equation
G Gibbs free energy
I parameter in the Kojima’s infinite dilution test
n number of data points
P pressure Q objective function R gas constant T temperature V volume x, y mole fractions Greek letters
d parameter in the Kojima’s point test
g activity coefficient f fugacity coefficient Subscripts i component i m mixture property Superscripts
cal calculated data
E excess property
exp experimental data
L liquid phase
sat saturated property
V vapor phase
Acknowledgements
The authors are grateful to the National Science Council, Republic of China for supporting this research. We appreciate partial experimental assistance from Mr. W.C. Lee.
References
w x1 C.C. Chen, M. Tang, Y.P. Chen, Vapor–liquid equilibria of binary and ternary mixtures of cyclohexane, 3-methyl-2-Ž .
w x2 K.W. Cheng, C.Y. Chen, M. Tang, Y.P. Chen, Vapor–liquid equilibria of binary mixtures cyclopentaneqisopropyl Ž .
acetate, isopropyl acetateqhexane and cyclopentaneqmethyl methacrylate at 101.3 kPa, J. Chem. Eng. Data 42 1997 754–757.
w x3 R.N. Paul, Study of vapor–liquid equilibrium in improved equilibrium still, J. Chem. Eng. Data 21 1976 165–169.Ž . w x4 C. Tsonopoulos, An empirical correlation of second virial coefficients, AIChE J. 20 1974 263–272.Ž .
w x5 T.E. Daubert, R.P. Danner, Physical and thermodynamic properties of pure chemicals. Data Compilation, Hemisphere
Publishing, NY, 1989.
w x6 M.S. Richard, M. Stanislaw, Handbook of the Thermodynamics of Organic Compounds, Elsevier, Amsterdam, 1987. w x7 C.F. Spencer, R.P. Danner, Improved equation for prediction of saturated liquid density, J. Chem. Eng. Data 17 1972Ž .
236–241.
w x8 K. Kojima, H.M. Moon, K. Ochi, Thermodynamic consistency test of vapor–liquid equilibrium data. Methanol–water, Ž .
benzene-cyclohexane and ethyl methyl ketone–water, Fluid Phase Equilibria 56 1990 269–284.
w x9 H.C. Van Ness, Thermodynamics in the treatment of vaporrliquid equilibrium VLEŽ . data, Pure and Applied Ž .
Chemistry 67 1995 859–872.
w10 G.M. Wilson, Vapor–liquid equilibrium: XI. A new expression for the excess free energy of mixing, J. Am. Chem.x Ž .
Soc. 86 1964 127–130.
w11 H. Renon, J.M. Prausnitz, Local compositions in thermodynamic excess functions for liquid mixtures, AIChE J. 14x Ž1968 135–144..
w12 D.S. Abrams, J.M. Prausnitz, Statistical thermodynamics of liquid mixtures: a new expression for the excess Gibbs freex Ž .
energy of partly or completely miscible systems, AIChE J. 21 1975 116–128.
w13 J. Gmehling, U. Onken, W. Arlt, P. Grenzheuzer, U. Weidlich, B. Kolbe, J. Rarey-Nies, Vapor–liquid equilibrium datax
collection, Chemistry Data Series, Vol. 1, DECHEMA, Frankurt, Germany, 1979.
w14 TRC Data Base for Chemistry and Engineering. Thermodynamic Research Center, Texas A&M University, Collegex