An Empirical Study of the Relationship between Derivatives Use and the Financial Characteristics of
Domestic Banks in Taiwan
Moh, Feng-Yuan 莫鳳圓
National Taiwan University of Science and Technology, Graduate School of Finance, MBA.
Lin, Bing-Huei林丙輝
National Taiwan University of Science and Technology, Department of Business Administration, Professor.
Abstract
A tobit regression model using quarterly data from 47 Taiwanese banks from March 1998 to September 2005 was employed to draw a comparison between their participation in derivatives markets and their major financial characteristics. Results indicated that banks use derivatives more intensively are generally 1) larger, 2) have less equity capital, 3) possess relatively stronger asset quality, 4) enjoy higher returns on equity, and 5) have higher net interest margins and higher net noninterest margins.
Moreover, banks with higher liquid asset ratios appear to use derivatives less intensively, while banks with less efficiency and lower commercial and industry loan growth rates tend to use derivatives more intensively.
Key words: Drivatives, financial characteristics, tobit regression.
Introduction
The number of banks engaging in derivatives activities for trading purposes and non-trading purposes has grown vigorously in recent years.
As the losses at Barings, Daiwa and Sumitomo have made clear, off- balance-sheet derivatives positions have the potential to dramatically increase risk. The possibility that the rising use of derivatives has increased the risk to individual banks and to the banking system as a whole is a major
concern facing policymakers and bank regulators (Simons, 1995; Peek and Rosengren, 1997; Choi and Elyasiani, 1997; and Chaudhry, Rohan, Koch and Reichert, 2000).
According to the Bank for International Settlement triennial central bank survey of foreign exchange and derivatives market activity, at end-June 2004, the total notional amounts of outstanding over-the-counter (OTC) derivatives was $220 trillion, about 120% higher than the amount in end- June 2001. Both interest rate and foreign exchange derivatives activities are enjoying buoyant growth. Between June 2001 and June 2004, notional amounts of interest rate derivatives expanded by 134% to $177 trillion, while exchange rate derivatives grow by 54% to $32 trillion.
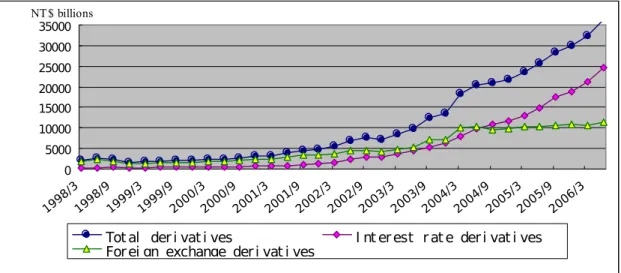
Since July 1991, when derivatives were first introduced to Taiwan, banks have become active participants in derivatives markets as end-users, or intermediaries, and derivatives activity has increased dramatically. The growth in bank participation in derivative markets during the past eight and half years has been tremendous (as shown in figure 1). According to the Central Bank of China’s (CBC) statistics, notional outstanding amounts of derivatives held by all domestic banks and local branches of foreign banks in Taiwan, including interest rate, foreign exchange, equity and stock index, commodity and credit contracts, soared from NT$ 2.01 trillion in March-end 1998 to 36.3 trillion in end-June 2006, rose by 17 times. Among them, both interest rate and foreign exchange contracts increased sharply.
In the eight and half years to end-June 2006, notional amounts expanded more strongly in the interest rate contracts, by 95.8 times to NT$ 24.7 trillion, than in the exchange rate contracts, up by 5.5 times to NT$11.4 trillion.
Figure 1 Notional amounts outstanding of derivatives in Taiwan
1. Interest rate contracts only include single-currency contracts.
2. The data before January 1998 are not available.
3. Reported data by all domestic banks and local branches of foreign banks.
4. Source: The CBC’s notional outstanding amounts of derivatives by risk and trading purposes (http://www.cbc.gov.tw).
In recent years, researchers have focused on examining the relationship between financial characteristics and derivatives usage by U.S. banks (Kim and Koppenhaver, 1993; Sinkey and Carter, 1994, 1997, 2000; Carter and Sinkey, 1998; Simons, 1995; Brewer, Minton, and Moser, 1994, 2000); and Brewer, Jackson, and Moser, 2001). While these studies have yielded numerous beneficial results, derivatives usage in emerging markets should not be neglected.
The purpose of this article is to investigate bank derivatives use and its major financial characteristics of the regulators concerned1 by examining domestic banks in Taiwan, wherein there is an important emerging market of Taiwanese banks. Specifically, we focus on eight financial profiles: asset size, capital adequacy, asset quality, sensitivity to risk, earnings, liquidity, management, and growth, and address issues of interest by employing the tobit regression model to investigate the differences in financial characteristics between users and nonusers of derivatives. For robust purposes, we present three separate regression models, using the total derivatives (include interest rate, foreign exchange, equity and stock index, commodity and credit contracts) use, interest rate derivatives use, and
0 5000 10000 15000 20000 25000 30000 35000 NT $ billions
Tot al der i vat i ves I nt er est r at e der i vat i ves For ei gn exchange der i vat i ves
foreign exchange derivatives use, as the dependent variable respectively.
Our results show that user banks, compared to nonuser banks, are larger, suggesting the existence of cost-related motives for using derivatives. User banks have less equity capital, which does not support the regulatory hypothesis under which banks must have stronger capital positions to engage in derivative activities. Moreover, banks that possess relatively stronger asset quality are bigger users of derivatives, indicating that the banks with weak asset quality are subject to greater regulatory restrictions when they attempt to use derivatives. Our results also show that user banks enjoy higher returns on equity, and have higher net interest margins and higher net noninterest margins.
We also find that banks with higher liquid asset ratios appear to use derivatives less intensively, while banks with less efficiency and lower commercial and industry (C&I) loan growth rates tend to use derivatives more heavily. Our result supports the alternatives-to-hedging hypothesis.
Finally, user banks have lower C&I loan growth rates, which suggests that banks may use derivatives as substitutes for their lending activities, rather than to supplement lending.
The remainder of the article is organized as follows. The following section provides an overview of the theoretical considerations and the incentives for derivatives use. Section 3 discusses the empirical methodology employed in our investigation, and describes data sources, research variables, expected relations, and model specifications. Section 4 presents the empirical results of our investigation, and the final section contains a summary and our conclusions.
Motives of banks using derivatives
Theories of optimal hedging, comparative advantage, information signaling, and agency cost reduction have suggested that firms, including banks, can benefit from using derivatives. However, these incentives are necessary but not sufficient to induce a firm to use derivatives. Géczy, Minton, and Schrand (1997) argue that the use of derivatives depends on the level of risk faced by a firm and the costs of managing that risk. The regulatory environment and market discipline, as well as liquidity of the banks, also may affect a firm’s choice to use derivatives. Furthermore,
banks may alter their business mix and move away from traditional lending activity in order to generate fee incomes.
1. Theories of derivatives use
Theories of optimal hedging demonstrate that capital market imperfections create incentives for firms, including banks, to use derivative instruments. For example, researchers have suggested that firms can benefit from using interest rate swaps, and that may be a motive to market participants. Bicksler and Chen (1986) reason that the benefits from using interest rate swaps are due to comparative advantages over debt issuing costs. In the presence of market imperfections and a comparative funding cost advantages among borrowers, a firm with a lower credit rating can effectively lower its fixed-rate financing costs by borrowing short-term, floating-rating funds and swapping the interest payments with a higher- rated company instead of directly issuing corporate bonds. Marshall and Bansal (1992) also favor the comparative advantage theory in their research.
Information signaling due to asymmetric information can lead firms to be active in the swaps market as well. Arak, Goodman, and Silver (1988) argue that borrowers who are pessimistic about the future direction of interest rates but optimistic about changes in their own credit rating would prefer the combination of short-term debt and an interest rate swap over the issuance of long-term debt. The swap enables the firm to manage the risk of interest rate changes while the credit spread can fluctuate from period to period. Wall and Pringle (1988) also suggest that an interest rate swap enables management to exploit their inside information, so that the firm can reduce funding costs without exposing the firm to interest rate risk.
Meanwhile, Wall’s (1989) agency cost reduction theory suggests that the combination of borrowing short-term and swapping for fixed rates may reduce financing costs by allowing high-risk firm to reduce agency costs without incurring interest rate risk. Harper and Wingender’s (2000) result supports for the Wall’s agency cost reduction theory.
2. Costs–related motives
Booth, Smith, and Stolz (1984) argue that the costs of implementing a risk management or hedging program may keep smaller banks from
participating in using derivatives. The costs might include the hiring of skilled personnel and the implementation of internal control systems necessary for participating in the derivatives market. In addition, margin requirements and the maintenance of regulatory capital are additional costs of using derivatives.
A number of studies find that size is an important factor in bank’s derivatives activities (Booth, Smith, and Stolz, 1984; Koppenhaver, 1990;
Kim and Koppenhaver, 1993; Gunther and Siems, 1996; Sinkey and Carter, 1997; Sinkey and Carter, 2000; and Brewer, Jackson and Morser, 2001).
These studies document that large financial institutions are more likely to be involved in the use of derivatives. This is in agreement with the idea that there is a fixed cost associated with initially learning how to use derivatives. Large banks are more willing to incur this fixed cost because they tend to use a larger amount of derivatives.
3. Regulatory requirements and market discipline
Capital-adequacy requirements may also provide some incentives to use derivatives. Risk-based capital standards require banks to support their derivatives activities with capital, as Merton and Bodie (1992) suggest that banks must have “assurance capital” to participate in new activities.
Presumably, capital structure may be viewed as a measure of creditworthiness by the market. Jagtiani (1996) argues that higher levels of capital are required for participation in the swaps market because banks with more capital are viewed as being more creditworthy. The same should be true for other OTC instruments, where counterparty credit risk is an important concern. In the other hand, however, for exchange-traded derivatives, with daily marking-to-market procedures and the exchange standing behind the transactions, default risk of the counterparty may not be an important consideration.
In the meantime, the use of derivatives may be perceived by regulators as risky transactions. And the poorly capitalized banks and banks with weak asset quality would be subject to more scrutiny or restrictions by regulators on derivatives use, thus would refrain from the use of derivatives (Simons, 1995).
Several studies have examined the relationship between derivatives use and bank’s capital structure. For example, Simons (1995) and Sinkey and Carter (1998) find a positive relationship between the derivatives use and
capital structure, while, on the contrary Kim and Koppenhaver (1993), Sinkey and Carter (2000), and Brewer, Jackson and Moser’s (2001) results show that a negative relationship exists between the derivatives use and capital structure.
4. Managing risk with derivatives
In the mid-1980s, a number of thrift associations in the U.S. went bankrupt due to the volatility of interest rates. Since then, banks have been shifting to derivatives instruments to help manage their exposure to interest rate risk as Morris and Merfeld’s (1988) evidence.
Banking activities entail a number of important risks, such as default or credit risk, interest rate risk, and foreign exchange risk, that may be related to the use of credit derivatives, interest rate derivatives, and foreign exchange derivatives to hedge their risk exposures.
In the banking literature, a bank’s exposure to interest rate risk is measured by the difference between the duration of assets and the duration of liabilities. The larger this difference, or duration gap, the greater is the effect of unexpected changes in interest rates on the bank’s market value (Flannery and James, 1984; and Kwan, 1991).
A number of articles have examined the relationship between interest rate risk exposure and bank’s derivatives usage. Kim and Koppenhaver (1993), Sinkey and Carter (2000) and Brewer, Jackson and Moser (2001) find that use of derivatives is positively related to bank’s interest rate exposure, which is consistent with the idea that banks use derivatives for hedging purposes. In contrast, Sinkey and Carter (1994) and Gunther and Siems (1996) find that the use of interest rate derivatives is negatively related to exposure to interest rate risk. The latter studies’ arguments are consistent with the idea that banks use derivatives as substitutes for on- balance-sheet sources of interest rate risk exposure. Nevertheless, Simons (1995) and Angbazo (1997) find that there is no significant relationship between derivatives usage and interest rate risk exposure.
When using interest rate derivatives for hedging interest rate risks, banks need to consider the effects of credit risks, due to the interaction between credit risk and interest rate risk. Santomero (1985) cautions bankers to recognize the interaction between variable-rate pricing and default risk.
Schrand and Unal (1998) suggest that financial institutions should engage in joint risk management, rather than view each source of risk individually.
5. Alternatives to hedging
Instead of hedging with derivatives, a bank may choose to manage its risks on the balance sheet. To reduce the probability of financial distress, banks can manage risks on the balance sheet by investing in safer (more liquid) assets or limiting their dividend payouts rather than using derivatives. Because liquid assets can be converted into cash more easily, the dangers associated with variable cash flows can be limited. This alternative reduces the probability of financial distress and assures the creditors that sufficient funds exist to cover debt-related payments (Nance, Smith and Smithson, 1993; and Carter and Sinkey, 1998).
6. Derivatives usage versus lending activities
Brewer, Jackson and Moser (2001) argue that banks may use derivatives to replace traditional their lending activities. To improve financial performance, a bank might alter its business mix and move away from traditional business lines. Bank revenues from participating in derivatives markets have two possible sources: 1) Using derivatives as yield-enhance instruments, and gain from speculating on interest rate changes, enhance revenues from bank trading desks; 2) Acting as OTC dealers and charge fees to institutions placing derivative positions. The generation of fee incomes is a major incentive for banks to provide services as an intermediary to corporate clients, a motive coincident with the declining importance of the traditional business of banking.
In contrast, Diamond (1984) demonstrates that derivatives contracts enable banks to reduce their exposure to systematic risk. As a result, the use of derivatives contracts to resolve mismatches in the interest rate sensitivities of assets and liabilities reduces delegation costs and enables banks to intermediate more effectively. Diamond’s (1984) model predicts that interest rate derivatives play a complementary role to bank lending activities. And empirically Brewer, Minton and Moser (2000) and Brewer, Jackson and Moser’s (2001) evidence confirm the complementary hypothesis.
Empirical methodology
In this section we discuss the data sources, variables definitions, and the model specification employed in our investigation.
1. The data
We analyze the derivatives usage by domestic banks in Taiwan from March 1988 to September 2005. The data for the empirical analysis are obtained from the Quarterly Report on Condition and Performance of
Domestic Banks published by the CBC, and the Financial Business Abstract published by the Financial Supervision Commission (FSC).
Although notional amounts of derivatives contracts may not fully reflect the market value or the risk of the contracts, however, since the focus of our empirical investigation is on the extent of usage, we use notional amounts as proxies for this trait regardless of the actual underlying risk exposure.
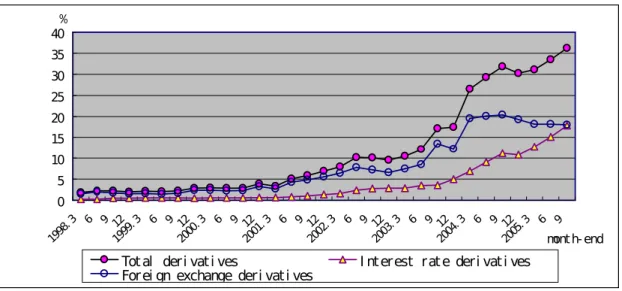
Figure 2 provides the ratios of notional amounts of outstanding derivatives to total assets for domestic banks as a whole in Taiwan from end-March 1988 to end-September 2005. This ratio for total derivatives as a whole rose dramatically by 19.1 times, from 1.8% at end-March 1988 to 36.2% at end-September 2005. Moreover, the ratio for interest rate derivatives rose by 65.1 times, from 0.3% at end-March 1988 to 17.8 % at end-September 2005, while for foreign exchange derivatives, it rose by 10.7 times, from 1.5% at end-March 1988 to 18% at end-September 2005.
Figure 2. The ratio of the notional outstanding amounts of derivatives to total assets for domestic banks in Taiwan
Source: The Quarterly Report on Condition and Performance of Domestic Banks published by the CBC.
2. Dependent variables
Following Simons (1995), Sinkey and Carter (2000), and Brewer, Jackson and Moser (2001), we employ the notional outstanding amounts of derivatives to capture the extent of derivative activities by domestic banks in Taiwan. The notional outstanding amounts of derivatives may not be a good measure for the level of bank derivatives activities or overall risks borne by the bank since a bank that serves as intermediary in derivatives transactions would report the same notional amount twice. Nevertheless, since the focus of our empirical investigation is on the financial characteristics of users and nonusers of derivatives, notional amounts are a satisfactory measure of the extent of a bank’s involvement in the derivatives market.
In our empirical models, we use the bank’s notional outstanding amounts of total derivatives (TDER), interest rate derivatives (IRDER) and foreign exchange derivatives (FXDER) respectively, scaled by the bank’s total assets, as continuous measures of the bank’s involvement in derivatives markets. Total derivatives (TDER) include interest rate, foreign exchange, equity and stock index, commodity and credit derivatives. The variables
TDER and IRDER include both exchange-traded and OTC instruments.
0 5 10 15 20 25 30 35 40
month- end
%
Total deri vati ves I nterest rate deri vati ves Forei gn exchange deri vati ves
3. Explanary variables
Bank size
If the use of derivatives is associated with cost-related motives, lager banks are more likely to have the control systems, trained personnel, and scope of activities necessary for involvement in derivatives activities, then a positive relationship should exist between the use of derivatives by banks and bank size. In measuring bank size we use bank’s total assets expressed in millions of NT dollars (ASSET) in the comparison of means for users versus nonusers, while using the natural logarithm of total assets (LNTASS) in regression models.
Capital adequacy
The variable EQRAT, which is defined as the ratio of equity capital to total assets, is used to test for the relationship between capital adequacy and the use of derivatives. If risk-based capital standards’ regulatory requirements and market imposes market discipline on undercapitalized counterparties, a positive relationship between EQRAT and the use of derivatives by banks would be expected.
Asset quality
The variable NALOAN, which is the ratios of nonaccrual loans to gross loans, and ALLOWN, which is the ratio of allowance for doubtful accounts to nonaccrual loans, are used to measure assets quality. The use of derivatives may be perceived by regulators as risky activity, banks with relatively poor asset quality (as measured by high levels of NALOAN or low level of ALLOWNL) would be subject to more scrutiny or restrictions by regulators as they attempt to use derivatives, thus will be discouraged on the use of derivatives. Therefore, NALOAN is expected to have a negative while ALLOWNL have a positive effect on the use of derivatives.
Profitability
To understand whether derivative usage allow banks to earn higher accounting profit, the variables, return on assets (ROA) and return on equity
(ROE) are used to measure banks profitability. ROE is defined as the ratio of net income before tax to average equity, which is to capture stockholders investment returns on their capital. ROA is calculated as net income before tax divided by average total assets, which indicates the extent of success realized by bank management in converting the assets of the bank into net earnings.
Net interest margin (NIM) is a measure of intermediation profitability before credit losses. It is calculated as net interest income (the difference between total interest income and total interest expense) divided by total assets. Banks can use derivatives to lock in the spread between interest income and interest expense. Banks with larger NIM would be expected to protect their spreads by using derivatives to hedge against adverse movements in interest rates. Therefore, we expect NIM is positively related to derivatives use.
Banking organizations also earn noninterest incomes from service fees and incur noninterest costs in the form of salaries and wages expense and repair and maintenance costs on bank equipment and facilities. Net noninterest rate margin (NNIM), which is measured by the difference between noninterest revenue and noninterest expense divided by total assets, captures the banking organization’s ability to generate noninterest revenue to cover noninterest expenses. For most banking organizations net noninterest margin is negative, with noninterest costs generally outstripping fee income. The less negative this profitability measure is better the banking organization at generating noninterest income to cover noninterest expenses. Thus we expect NNIM is positively related to derivatives used by banks.
Exposure to risk
A bank’s use of interest rate derivatives should be related to exposure to interest rate fluctuations arising from the mismatch in interest rate reset dates of bank assets and liabilities. Although duration gap is an important theoretical measure of a bank’s on balance sheet interest rate risk, we use
GAP as a proxy for a bank’s exposure to interest rate risk due to lack of
available information on the duration gap. Here GAP is calculated as absolute value of interest rate sensitivity gap- the difference of NT dollar interest rate sensitivity short-term (less than one year) assets and liabilities - divided by equity. A positive relationship is expected to exist between theGAP and derivatives use.
If banks are practicing coordinated risk management, then the use of derivatives to hedge interest rate risk might be related to a bank’s credit exposure. We use LOAN and ALLOWL as proxies for credit risk. The variable LOAN is calculated as gross loans divided by total assets while
ALLOWL is calculated as allowance for doubtful accounts divide by
nonaccrual loans. LOAN has a positive but ALLOWL has a negative effect on derivatives use of banks are expected.Liquidity
To investigate the alternative-to-hedging hypothesis, the variable
LIQUID, defined as the ratio of a bank’s liquid assets to its total assets, is
used to measures the liquidity of a bank’s on-balance-sheet assets. Liquid assets consist of cash and due from banks, and government securities. If asset liquidity represents an alternative to hedging, a negative relationship should exist between LIQUID and derivatives used by banks.C&I loan growth
Concerning the relationship between derivative usage and lending, we use the variable CILOAN, which is measured by the difference between the present quarter C&I loan and previous quarter C&I loan dividing by previous quarter C&I loan to capture the C&I loan growth. Although modern theories of the intermediary role of banks describe how derivatives and lending can be complementary activities, however, derivatives might be mainly used to replace traditional lending activities. If banks participate in interest rate derivative markets to gain revenues, than, a negative relationship is expected between derivatives usage and lending.
Efficiency
One way to measure efficiency is to compare noninterest expenses to total operating income (the sum of interest and noninterest income).
Brewer, Jackson and Moser (2001) find that the lower is this ratio, the greater the efficiency. Users in the small bank holding company category tend to be less efficient than nonusers, while those in the mid and large-size bank holding company category appear to be as efficient as nonusers. The
variable EFFRAT is to capture the efficiency of bank. It is calculated as noninterest expense divided by total operating income
The definitions for all variables used to estimate the models are presented in table 1. The explanatory variables LASSET, EQRAT, EQRAT,
NIM, NNIM, GAP and LOAN are expected to have a positive, while NALOAN, ALLOWNL, LIQUID and CILOAN have a negative effect on
derivatives use of banks. The expected signs for other variables such asROE, ROA, and EFFRAT are somehow ambiguous.
4. Model specification
Our empirical analysis utilizes a regression (tobit) analysis to investigate the relationship between the extent of bank’s derivatives usage and its financial characteristics. We hypothesize that derivatives usage are related to several financial characteristics, as discussed above. These relationships can be expressed as follows:
DER
i=β0+β1LASSET
i+β
2EQRAT
i+β
3NALOAN
i+β
4ALLOWNL
i+β
5ROE
i+β
6ROA
i+β
7NIM
i+β
8NNIM
i+β9GAP
I+β10LOAN
i+β11ALLOWL
i+β12LIQUID
i+β13CILOAN
i+β14EFFRAT
i+εi (1)Table 1 summarizes the definitions of research variables and their predicted relationships. Equation (1) can be estimated through the tobit model, described by Tobin (1958), which is a regression model for left- censored data assuming a normally distributed error term. The model parameters are estimated by maximum likelihood.
Tobit model is appropriate to estimate models in which the dependent variable is limited at some point. The data for banks’ use of derivatives have a common trait with tobit’s data in the sense that many banks do not use derivatives and the value for derivatives usage cannot be less than zero.
Table 1 Definitions of research variables used in the analysis and
expected signs of coefficient estimates
Variables Definition Predicted Sign DER The notional outstanding amounts of derivatives /
total assets
TDER The notional outstanding amounts of total derivatives / total assets
IRDER The notional outstanding amounts of interest rate derivatives / total assets
FXDER The notional outstanding amounts of foreign exchange derivatives / total assets
LASSET The natural logarithm of total assets + EQRAT Equity capital / total assets + NALOAN Nonaccrual loans / gross loans - ALLOWNL Allowance for doubtful accounts / nonaccrual loans +
ROE Net income before tax / average equity +/-
ROA Net income before tax / average asset +/-
NIM (Gross interest income - gross interest expense) / total assets
+
NNIM (Noninterest income – noninterest expense) / total assets
+
GAP (NT dollar Interest rate sensitivity less than one year)
Absolute value of interest rate sensitivity gap / equity
+
LOAN Gross loans / total assets +
ALLOWL Allowance for doubtful accounts / gross loans - LIQUID ( Cash and due from banks + government securities )
/ total assets
-
CILOAN (Present quarter C&I loan - previous quarter C&I loan) / previous quarter C&I loan
-
EFFRAT Noninterest expense / total operating income +/-
ε Random disturbance term
Empirical results
1. Summary statistics
Table 2 presents differences between users and nonusers of derivatives contracts for the explanary variables. Panel A of Table 2 provides a comparison of means for total derivatives usage. Ten of the fourteen variables (ASSET, EQRAT, NALOAN, ALLOWNL, ROE, NNIM, GAP,
ALLOWL, LIQUID and CILOAN) have differences in means that are
significant at ten percent significance level or better employing a t-statistics based on unequal group variances. Results show that the average user banks, compared to the average nonuser banks, are larger, have less equity capital, possess relatively stronger asset quality, enjoy higher returns on equity, have higher net noninterest margins, have smaller one-year maturity gap, bear lower credit risk (as measured by ALLOWL), have lower liquid asset ratios, and have lower C&I loan growth rates.Panel B of table 2 compares group means for users versus nonusers of interest rate derivatives. The differences in means are significant for ten of the fourteen variables (ASSET, NALOAN, ALLOWNL, ROE, NIM, NNIM,
GAP, LOAN, CILOAN and EFFRAT) have differences in means that are
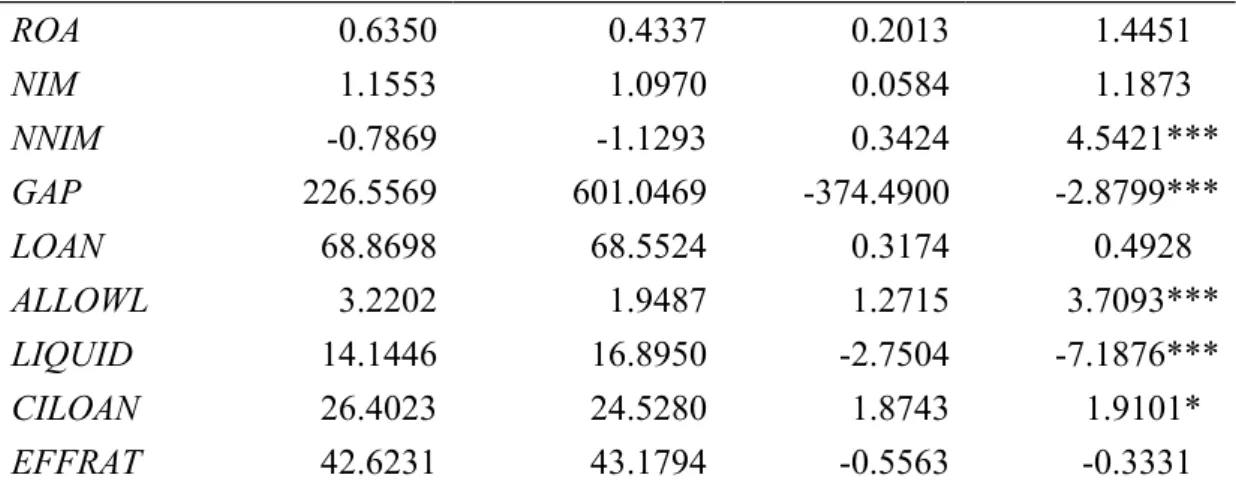
significant at the ten percent level or better. The average user banks are larger, possess relatively stronger asset quality, enjoy higher returns on equity, have higher net interest margins, have higher net noninterest margins, have smaller one-year maturity gap, bear lower credit risk (as measured by LOAN), have lower C&I loan growth rates and have less efficiency (higher efficiency ratio). Panel C of table 2 shows group means and t-statistics for users versus nonusers of foreign exchange derivatives.The results are almost identical to that of total derivatives.
To summarize, results show that user banks are larger, suggesting the existence of cost-related motives for using derivatives. In the case of total derivatives and foreign exchange derivatives usage, user banks have less equity capital, which does not support the regulatory hypothesis under which banks must have stronger capital positions to engage in derivative activities. Moreover, those banks that possess relatively stronger asset quality are bigger users of derivatives, indicating that the banks with weak asset quality are subject to greater regulatory restrictions when they attempt to use derivatives. Our results also show that user banks enjoy higher returns on equity, have higher net noninterest margins. Interest rate derivatives user bank have higher intermediation profitability (as measured by NIM). Use banks have smaller one-year maturity gap, which does not support that banks use derivatives in response to the interest rate risks they
face. We find no support for a coordinated risk management strategy between interest rate risk and credit risk. Our results also find that banks with higher liquid asset ratios appear to use total derivatives and foreign exchange derivatives less intensively. Result supports the alternatives-to- hedging hypothesis. Finally, result for C&I loan growth rates is ambiguous.
In the case of total derivatives and foreign exchange derivatives usage, user banks have higher C&I loan growth rates, whereas in the case of interest rate derivatives usage, user banks have lower C&I loan growth rates. Therefore, according to the results, the relationship between derivatives usage and C&I loan growth rates is ambiguous.
Table 2 Differences in means for Taiwan domestic banks: users versus nonusers of derivatives
Variable
Group means Difference in meansusers nonusers users - t-statistics
nonusers
Panel A. Total derivatives (1,236 user banks and 289 nonuser banks) ASSET
EQRAT NALOAN ALLOWNL ROE
ROA NIM NNIM GAP LOAN ALLOWL LIQUID CILOAN EFFRAT
509511 8.3850 5.2991 56.5309 8.5323 0.6326 1.1549 -0.7890 227.0886 68.8815 3.2016 14.1367 26.4506 42.6089
81809 9.6135 9.7562 24.2673 3.1798 0.4361 1.0967 -1.1332 613.0266 68.4902 1.9796 17.0337 24.2501 43.2610
427701 -1.2285 -4.4571 32.2636 5.3526 0.1965 0.0581 0.3442 -385.9380 0.3913 1.2220 -2.8970 2.2005 -0.6520
29.1343***
-1.7769*
-8.6522***
5.7713***
2.1510**
1.3798 1.1670 4.4850***
-2.8690***
0.5961 3.5859***
-7.4923***
2.1920**
-0.3866 Panel B. Interest rate derivatives (792 user banks and 733 nonuser banks) ASSET
EQRAT NALOAN ALLOWNL ROE
ROA NIM NNIM GAP LOAN ALLOWL LIQUID CILOAN EFFRAT
625426 8.5564 4.1713 57.5878 9.8356 0.6305 1.1869 -0.7512 234.5828 66.7243 2.9659 14.9408 24.7276 44.1743
215636 8.6841 8.2749 42.6685 5.0139 0.5573 1.0974 -0.9655 371.1551 71.0581 2.9745 14.4100 27.4448 41.1747
409790 -0.1277 -4.1035 14.9193 4.8217 0.0732 0.0895 0.2143 -136.5722 -4.3338 -0.0086 0.5309 -2.7172 2.9996
18.4446***
-0.2928 -13.4261***
1.6925*
2.0569**
0.5549 2.1514**
4.2314***
-1.8727*
-7.6701***
-0.0162 1.5157 -4.3002***
1.8183*
Panel C. Foreign exchange derivatives (1,225 user banks and 300 nonuser banks) ASSET
EQRAT NALOAN ALLOWNL ROE
512057 8.3953 5.2591 56.8835 8.5655
87095 9.5263 9.7561 24.0105 3.2407
424962 -1.1310 -4.4970 32.8730 5.3248
28.5006***
-1.6886*
-8.9415***
5.8424***
2.1847**
ROA NIM NNIM GAP LOAN ALLOWL LIQUID CILOAN EFFRAT
0.6350 1.1553 -0.7869 226.5569 68.8698 3.2202 14.1446 26.4023 42.6231
0.4337 1.0970 -1.1293 601.0469 68.5524 1.9487 16.8950 24.5280 43.1794
0.2013 0.0584 0.3424 -374.4900 0.3174 1.2715 -2.7504 1.8743 -0.5563
1.4451 1.1873 4.5421***
-2.8799***
0.4928 3.7093***
-7.1876***
1.9101*
-0.3331
1. *, ** ,*** indicate statistical significance at the 10%, 5% or 1% level, respectively.
2.The financial data are form end-March 1998 to end-September 2005. The t-statistics are based on unequal group variances.
3. Sources: The quarterly report on condition and performance of domestic banks published by the CBC and the financial business abstract published by the FSC.
2. Regression results
In the tobit model, the dependent variable is the ratio of the notional amounts outstanding of derivatives to total assets. Correlations among independent variables used in the estimation are presented in table 3.
Correlations among variables are generally low. The correlation between
ALLOWNL and ROA has the lowest coefficients negative 0.0006 while the
correlation between NNIM and EFFRAT have the highest coefficients negative 0.5549. Therefore, these variables will not cause multi-collinearity problems.Table 3 Correlation among independent variables
variables LASSET EQRAT NALOA N
ALLOWNL ROE ROA
NIM NNIM GAP LOAN ALLOWL LIQUID CILOAN
EQRAT -0.1497 NALOAN -0.2556 -0.1763 ALLOWNL -0.0889 0.2063 -0.1576 ROE 0.0850 0.0169 -0.1001 -0.0006 ROA 0.0300 0.2211 -0.1540 0.0241 0.1664 NIM 0.0473 -0.0713 -0.0011 -0.0209 -0.0335 -0.0099 NNIM 0.1990 -0.0146 -0.1813 0.0130 0.1950 0.2073 -0.4874 GAP -0.1106 -0.0873 0.3093 -0.0190 -0.1406 -0.0643 -0.0244 -0.1036 LOAN -0.2024 -0.3599 0.1030 0.0212 -0.0380 -0.1019 0.0100 0.0140 0.0346
ALLOWL 0.2326 -0.0403 0.0483 -0.0301 -0.0079 -0.0170 -0.0442 0.2206 0.0046 0.0735 LIQUID 0.0587 -0.0563 0.1169 -0.0921 0.0350 0.0082 0.0049 -0.0087 0.0178 -0.2928 -0.0470
CILOAN -0.0920 0.1103 0.2909 0.0157 -0.0578 -0.0306 0.1376 -0.2115 0.0863 0.1565 -0.1197 -0.0942 EFFRAT -0.0271 0.1926 0.0930 -0.0108 -0.1252 -0.1195 0.1348 -0.5549 0.0613 -0.2118 0.0054 0.0729 0.0730
Sources: The quarterly report on condition and performance of domestic banks published by the CBC and the financial business abstract published by the FSC.
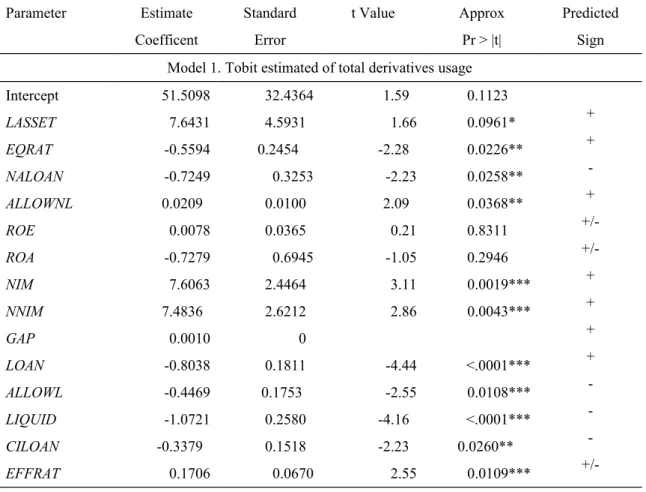
Table 4 presents three separate regression models: total derivatives usage (model 1), interest rate derivatives usage (model 2) and foreign exchange derivatives usage (model 3). The results for the three models are quite similar. NIM, NNIM, and EFFRAT are positive and significant in all three of the models, whereas NALOAN, LOAN, ALLOWL, LIQUID, and
CILOAN are negative and significant in all of the models.
The use of the total derivatives and interest rate derivatives are positively and significantly related to size (LASSET), supporting the existence of cost- related motives for using derivatives. Only those banks with sufficient scale and scope economics are able to justify the resources necessary to participate in derivatives.
The use of the total derivatives and foreign exchange derivatives are negatively and significantly related to EQRAT. The results do not support a regulatory and market discipline hypothesis in which banks have stronger capital positions to engage in derivatives activities. The result implies that derivatives usage allows banks to substitute inexpensive risk management for expensive capital.
In the case of total derivatives and foreign exchange derivatives usage, the estimated coefficient for NALOAN is negative and significant, whereas
ALLOWNL is positive and significant. Results find that those banks with
stronger asset quality are using derivatives more intensively, indicating that the banks with weak asset quality are subject to greater regulatory restrictions when they attempt to use derivatives.As in models for total derivatives, interest rate derivatives and foreign exchange derivatives usages, the estimated coefficient NIM is significant and positive, suggesting that banks use derivatives to protect their net interest incomes. Besides, the use of total derivatives, interest rate derivatives and foreign exchange derivatives are significant and positive related to NNIM.
However, as in models for total derivatives, interest rate derivatives and
foreign exchange derivatives usages, we find no positive relationship between GAP and the use of the derivatives. The estimated coefficient for
LOAN is significantly negative, indicating that banks have a lower credit
risk are using derivatives more heavily, whereas the estimated coefficient for ALLOWL is significantly negative, indicating that banks have a higher credit risk are use derivatives more heavily. Therefore, according to the results, the relationship between derivatives usage and credit risk is ambiguous. Results find no support a coordinated risk management strategy between interest rate risk and credit risk.The estimate for LIQUID is negative and significant, supporting the alternatives-to-hedging hypotheses, in which banks would hold more liquid assets instead of using derivatives to hedge their risk.
The estimate for CILOAN are negative and significant, indicating that those banks with lower C&I loan growth rate tend to use derivatives more intensively. This implies that banks may use derivatives as substitutes for their lending activities. Our result is inconsistent with Brewer, Minton, and Moser (2000) and Brewer, Jackson, and Moser’s (2001) results which suggest that derivatives usage compliment to bank’s lending activities.
Finally, EFFRAT is positively related to the use of the derivatives. Those banks with less efficiency tend to use derivatives more intensively. This result might result from user banks are larger, and they trend to have higher operating expense due to merge and have more branches.
Table 4. Tobit regression estimates of the derivatives use by domestic banks in Taiwan
Parameter Estimate
Coefficent
Standard Error
t Value Approx
Pr > |t|
Predicted Sign Model 1. Tobit estimated of total derivatives usage
Intercept LASSET EQRAT NALOAN ALLOWNL ROE ROA NIM NNIM GAP LOAN ALLOWL LIQUID CILOAN EFFRAT
51.5098 7.6431 -0.5594 -0.7249 0.0209 0.0078 -0.7279 7.6063 7.4836 0.0010 -0.8038 -0.4469 -1.0721 -0.3379 0.1706
32.4364 4.5931 0.2454 0.3253 0.0100 0.0365 0.6945 2.4464 2.6212 0 0.1811 0.1753 0.2580 0.1518 0.0670
1.59 1.66 -2.28 -2.23 2.09 0.21 -1.05 3.11 2.86
-4.44 -2.55 -4.16 -2.23 2.55
0.1123 0.0961*
0.0226**
0.0258**
0.0368**
0.8311 0.2946 0.0019***
0.0043***
<.0001***
0.0108***
<.0001***
0.0260**
0.0109***
+ + - + +/- +/- + + + + - - - +/-
Model 2. Tobit estimated of interest rate derivatives usage Intercept
LASSET EQRAT NALOAN ALLOWNL ROE ROA NIM NNIM GAP LOAN ALLOWL LIQUID CILOAN EFFRAT
-9.5319 3.9918 -0.0194 -0.1441 0.0028 0.0045 -0.0097 2.6226 1.0450 0.0003 -0.0962 -0.1061 -0.1726 -0.0947 0.0343
5.7642 0.8162 0.0436 0.0578 0.0018 0.0065 0.1234 0.4347 0.4658 0 0.0322 0.0312 0.0459 0.0270 0.0119
-1.65 4.89 -0.44 -2.49 1.60 0.70 -0.08 6.03 2.24
-2.99 -3.40 -3.76 -3.51 2.88
0.0982*
<.0001***
0.6570 0.0127**
0.1090 0.4866 0.9371
<.0001***
0.0249**
0.0028***
0.0007***
0.0002***
0.0004***
0.0039***
+ + - + +/- +/- + + + + - - - +/- Model 3. Tobit estimated of foreign exchange derivatives usage
Intercept LASSET EQRAT NALOAN ALLOWNL ROE ROA NIM NNIM GAP LOAN ALLOWL LIQUID CILOAN EFFRAT
61.5016 3.5561 -0.5392 -0.5785 0.0180 0.0031 -0.7231 4.9060 6.4259 0.0006 -0.7076 -0.3387 -0.8950 -0.2417 0.1354
30.6262 4.3368 0.2317 0.3071 0.0094 0.0345 0.6557 2.3099 2.4749 0 0.1710 0.1655 0.2436 0.1433 0.0632
2.01 0.82 -2.33 -1.88 1.90 0.09 -1.10 2.12 2.60
-4.14 -2.05 -3.67 -1.69 2.14
0.0446**
0.4122 0.0199**
0.0596*
0.0570*
0.9288 0.2701 0.0337**
0.0094***
<.0001***
0.0407**
0.0002***
0.0918*
0.0323**
+ + - + +/- +/- + + + + - - - +/- 1. *, ** ,*** indicate statistical significance at the 10%, 5% or 1% level, respectively.
2. The dependent variable (Y) is the notional amounts of derivatives (total, interest rate and foreign exchange) contracts divided by total assets from end-March 1998 to end-September 2005. The independent variables are amounts from end-March 1998 to end-September 2005.
3. Source: The quarterly report on condition and performance of domestic banks published by the CBC
and the financial business abstract published by the FSC.
Conclusions
We employ a tobit regression model using quarterly data from 47 of Taiwanese banks from March 1998 to September 2005 to draw a comparison between their participation in total, interest rate and foreign exchange derivatives markets and their major financial characteristics.
Our results are similar to previous research in several points. First, we find that derivatives use is positively related to size, which is consistent with prior research by Kim and Koppenhaver (1993), Simons (1995), Sinkey and Carter (2000), and Brewer, Jackson and Moser (2001), suggesting that there are costs associated with initially learning how to use derivatives, and maintaining a risk management program. This also implies the existence of economic scale in banks’ derivatives activities. Second, banks that use derivatives tend to have less equity capital. The finding is consistent with Sinkey and Carter (2000) and Brewer, Jackson and Morser’s (2001) results, contradicting to the regulatory hypothesis and market discipline, in which banks must have stronger capital positions to engage in derivatives activities. Instead, the result implies that derivatives usage allows banks to substitute inexpensive risk management for expensive capital requirement. Third, those banks with higher net noninterest margins appear to be bigger users of derivatives, which is also consistent with Brewer, Jackson and Moser’s (2001) results, suggesting that with the exception of mid-size bank holding companies, derivative users have better control over noninterest expenses. Fourth, we also find that banks with higher liquid assets ratio appear to use derivatives less intensively. The result supports the alternatives-to-hedging hypothesis, in which banks could hold more liquid assets instead of using derivatives to hedge their risk. Finally, banks with less efficiency tend to use derivatives more intensively, which is consistent with Brewer, Jackson and Moser’s (2001) result, in which users in the small bank holding companies category tend to be less efficient than nonusers.
There are some more interesting findings: Firstly, banks with relatively stronger asset quality tend to be bigger users of derivatives. Unlike Simons (1995), which find that banks with weaker asset quality are bigger users of derivatives, our result indicates that banks with weak asset quality are subject to greater regulatory restrictions when they attempt to use derivatives. Next, banks with higher net interest margins appear to be
bigger users of derivatives implying banks use derivatives to lock in their interest rate spread. This is inconsistent with Sinkey and Carter’s (2000) result, in which user banks have lower intermediation profitability.
An even more surprising result of the current study is the finding that those banks with lower C&I loan growth rate tend to use derivatives more intensively. This implies that banks may use derivatives as substitutes for their lending activities. Our result is inconsistent with Brewer, Minton, and Moser (2000) and Brewer, Jackson, and Moser’s (2001) results which suggest that derivatives usage compliment to bank’s lending activities.
Although the relationship between derivatives use and financial characteristics in the U.S. banking organizations is well known, less is known about emerging markets. The characteristics of banks that use derivatives may be valuable information to bank regulators, investors, and others who are concerned with the development of derivatives markets. Our results contribute to the growing literature on bank derivative use by examining financial characteristics of Taiwanese banks, an important emerging market.
Acknowledgments
The authors wish to express their gratitude to Drs. Robert E. Johanson and Stanley M. Johanson for their invaluable comments and suggestions on earlier drafts of this manuscript.
Notes
1. The bank composite rating in the U.S. is known by the acronym CAMELS, which refers to the six components of the regulatory rating system: capital adequacy, asset quality, management, earnings, liquidity, and sensitivity, while the CBC, Taiwan, evaluate an institution's performance by analyzing its Capital adequacy, Asset quality,
Regulatory compliance, Strategies & stability, Earnings, and Liquidity.
The CARSEL rating is an important reference for the frequency of on- site examination for each bank (http://www.cbc.gov.tw).
References
Angbazo, Lazarus (January 1997), “Commercial Bank Net Interest Margins, Default Risk, Interest-Rate Risk, and Off-Balance Sheet Banking,” Journal of Banking & Finance, Vol. 21, pp. 55-97.
Arak, M., Estrella, A., Goodman, L. and Silver, A. (1988), “Interest Rate Swaps: An Alternative Explanation,” Financial Management, Vol. 17, pp. 12-18.
Bicksler, James and Chen, Andrew H. (July 1986), “An Economic Analysis of Interest Rate Swaps,” Journal of Finance, Vol. 41, pp. 645-655.
Booth, James R., Smith, Richard L. and Stolz, Richard W. (1984), “Use of Interest Rate Futures by Financial Institutions,” Journal of Bank Research, Vol. 15, pp. 15-20.
Brewer, Elijah III, Minton, Bernadette A. and Moser, James T. (2000),
“Interest Rate Derivatives and Bank Lending,” Journal of Banking and Finance, Vol. 24, No. 3, pp. 353-379.
Brewer, Elijah III, Minton, Bernardette and Moser, James (1994), “The Effect of Bank-Held Derivatives on Credit Accessibility,” Proceedings of the Conference on Bank Structure and Competition, Federal Reserve Bank of Chicago.
Brewer, Elijah III, Jackson, William E. III and Moser, James T. (3Q/2001),
“The Value of Using Interest Rate Derivatives to Manage Risk at U.S.
Banking Organizations,” Federal Reserve Bank of Chicago, Economic Perspectives, pp. 49-66.
Carter, David A. and Sinkey, Joseph F. Jr. (1998), “The Use of Interest-rate derivatives by End-users: the Case of Large Community Bank,” Journal of Financial Services Research, Vol. 14, No. 1, pp. 17-34.
Chaudhry, K. Mukesh, Rohan, Christie-David, Koch, Timothy W. and Reichert, Alan K. (2000), “The Risk of Foreign Currency Contingent claims at US Commercial Banks,” Journal of Banking and Finance, Vol.
24, pp. 1399-1417.
Choi, Jongmoo Jay and Elyasiani, Elyas (1997), “Derivative Exposure and the Interest Rate and Exchange Rate Risks of U.S. Banks,” Journal of Financial Services Research, Vol. 12, No. 2/3, pp. 267-286.
Cole, Rebel A. and Gunther, Jeffery W. (1998), “Predicting Bank Failures:
A Comparison of On- and Off-Site Monitoring Systems,” Journal of Financial Services Research, Vol. 13, No. 2, pp. 103-117.
Diamond, Douglas W. (1984), “Financial Intermediation and Delegated
Monitoring,” Review of Economic Studies, Vol. 51, pp. 393-414.
Felgran, Steven D. (1987), “Interest Rate Swaps; Use, Risk and Prices,”
New England Economic Review, Federal Reserve Bank of Boston, November /December, pp. 22-32.
Flannery, Mark J. and James, Christopher M. (1984), “The Effect of Interest Rates Changes on the Common Stock Returns of Financial Institutions,” Journal of Finance, Vol. 39, No. 4, pp. 1141-1153.
Géczy C., Minton, B. A. and Schrand, C. (1997), “Why Firms Use Currency Derivatives,” Journal of Finance, Vol. 52, No. 4, pp. 1323- 1354.
Gunther, Jeffery W. and Siems, Thomas F. (1996), “The Likelihood and Extent of Banks’ Involvement with Interest Rate Derivatives as End- Users,” Working Paper, Federal Reserve Bank of Dallas.
Harper, Joel T. and Wingender, John R. (2000), “An Empirical Test of Agency Cost Reduction Using Interest Rate Swaps,” Journal of Banking and Finance Vol. 24, pp. 1419-1431.
Jagtiani, Julapa (1996), “Characteristics of Banks That are More Active in the Swap Market.” Journal of Financial Services Research, Vol. 10, pp.
131-141.
Kim, Sung-Hwa and Koppenhaver, G. D. (1993), “An Empirical Analysis of Bank Interest Rate Swaps,” Journal of Financial Services Research, Vol. 7, pp. 57-72.
Koppenhaver, G.. D. (1990), “An Empirical Analysis of Bank Hedging in Futures Markets,” Journal of Futures Markets, Vol. 10, pp. 1-12.
Kwan, Simon H. (1991), “Re-examination of Interest Rate Sensitivity of Commercial Bank Stock Returns Using a Random Coefficient Model,”
Journal of Financial Services Research, Vol. 5, No. 1, pp. 61-76.
Marshall, J. F. and Bansal, V. K. (1992), “Financial Engineering: A Complete Guide to Financial Innovation,” New York Institute of Finance, New York.
Merton, Robert and Bodie, Zvi (1992), “On the Management of Financial Guarantees,” Financial Management, Vol. 21, pp. 87-109.
Morris, Charles S. and Thomas J. Merfeld (1988), “New Methods for Saving and Loans to Hedge Interest Rate Risk,” Economic Review, March .
Nance, D. R., Smith ,C. W. Jr. and Smithson, C. W. (1993) “On the Determinants of Corporate Hedging,” Journal of Finance, Vol. 48, pp.
267-284.
Peek,Joe. and Rosengren, Eric S. (1997), “Derivatives Activity at Troubled Banks.” Journal of Financial Services Research, Vol. 12, No. 2/3, pp.
287-302.
Santomero, Anthony M. (1985), “Pricing Business Credit,” In: R.
Aspinwall and R. Eisenbeis, eds., Handbook for Banking Strategy, New York: John Wiley and Sons, pp. 589-605.
Schrand, C. M., and Unal, H. (1998), “Hedging and Coordinated Risk Management: Evidence from Thrift Conversions,” Journal of Finance, Vol. 53, pp. 979-1013.
Simons, Katerina. (1995), “Interest Rate Derivatives and Asset-Liability Management by Commercial Banks,” New England Economic Review, Federal Reserve Bank of Boston, January/February, pp. 17-28.
Sinkey, Joseph F. Jr. and David A. Carter, (1994) “The Derivatives Activities of U.S. Commercial Banks,” Federal Reserve Bank of Chicago, Proceedings of the 30th Annual Conference on Bank Structure and Competition, May, pp. 165-185.
Sinkey, Joseph F. Jr., and Carter, David A. (1997), “Derivatives in U.S.
Banking: Theory, Practice and Empirical Evidence,” In: Barry Schachter, ed., Derivatives, Regulation and Banking, Amsterdam:
Elsevier Science, pp. 41-78.
Sinkey, Joseph F., Jr. and Carter, David A. (2000), “Evidence on the Financial Characteristics of Banks That Do and Do not Use Derivatives,”
The Quarterly Review of Economics and Finance, Vol. 40, pp. 431-449.
Tobin, J. (1958), “Estimation of Relationships for Limited Dependent Variables,” Econometrica, Vol. 26, pp. 24-36.
Wall, D. Larry (1989), “Interest Rate Swap in an Agency Theoretic Model with Uncertain Interest Rates,” Journal of Banking and Finance, Vol. 13, pp. 261-270.
Wall, L. and Pringle, J. (1989), “Alternative Explanations of Interest Rate Swaps: A Theoretical and Empirical Analysis,” Financial Managements, Vol. 18, pp. 59-73.
Wall, Larry D. and Pringle, John (1988), “Interest Rate Swaps: A Review of the Issues,” Economic Review, Federal Reserve Bank of Atlanta, November/December, pp. 22-40.