Chapter 4: Conclusion and Prospects
A simple and robust strategy combining subcellular fractionation, SDS-PAGE, IMAC chromatography and nLC-MS/MS is established for the large-scale identification of protein phosphorylation. After optimization, the enrichment of phosphopeptides from crude, complex mixtures by IMAC can be achieved for subsequent nLC-MS/MS analysis. The results described in this study that coupled IMAC with nLC-MS/MS has demonstrated great success in the large-scale identification of phosphorylation sites in complex human Jurkat T-cell.
Using β-casein as model phosphoprotein, several parameters including binding specificity, column capacity, elution buffer and sample recovery were studied in details for optimal enrichment of phosphopeptides by IMAC column. The major issue of IMAC is nonspecific binding of negative charged amino acid residues and the nonspecific binding of unphosphorylated peptides via their carboxyl groups.
Nonspecific binding was successfully minimized at optimal pH at 3.0 without the need of methyl esterification, while maintaining phosphopeptide recovery in IMAC chromatography. The sensitivity of the overall strategy can be as low as 0.1 µg.
In the second part of the thesis, human Jurkat T-cell was analyzed to test the
performance of our strategy. Prior to IMAC chromatography, advanced separation
methodologies reduce the sample complexity and therefore, increase the detection
dynamic range of low abundant phosphoproteins in cells. In addition to subcellular
fractionation, SDS-PAGE demonstrated as a powerful alternative to size-exclusion
chromatography for fractionation of proteins based on to molecular mass. In this study,
the preliminary result identified 782 phosphopeptides with 891 phosphorylation sites.
Without using methylation, about 90% of the identified peptides from human Jurkat T-cell were found to be phosphorylated. This robust technology platform can be routinely robotic for large-scale identification of protein phosphorylation sites.
Better understanding of biological signaling and other important functions requires global identification and quantification of transient protein phosphorylation.
Although the analysis of protein phosphorylation has been a rapidly evolving field,
methodologies for further knowledge of the quantitation for phosphorylation are
important to study the transient phosphorylation. In the future, the combination of
multiplexed stable isotope tagging with this technique developed in the thesis may be
employed for the large-scale comparative proteomic study to decipher the dynamic
and heterogeneous phosphoproteome.
Figure 1. Analytical scheme of immobilized metal affinity chromatography.
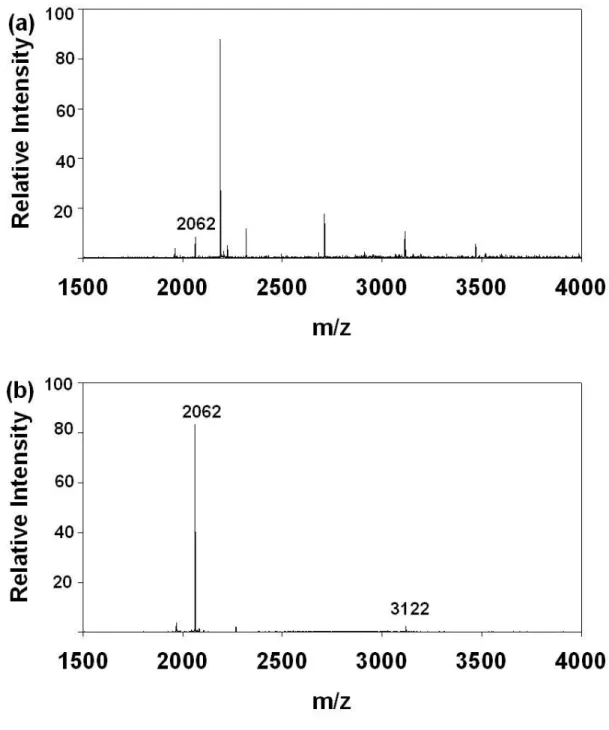
Figure 2. MALDI-TOF MS of (a) tryptic β-casein peptide mixture (b) Fe (III)
IMAC purified tryptic β-casein peptide mixtures.
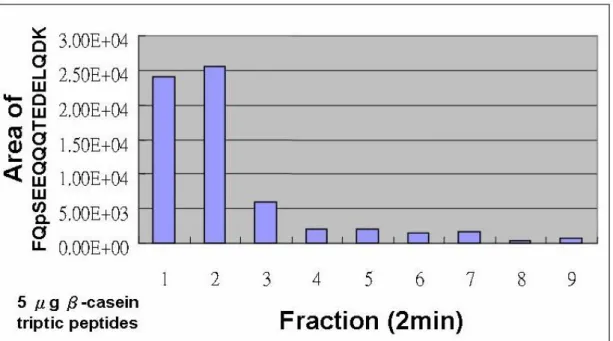
Figure 3. IMAC elution chrmoatogration of β-casein phosphopeptide.
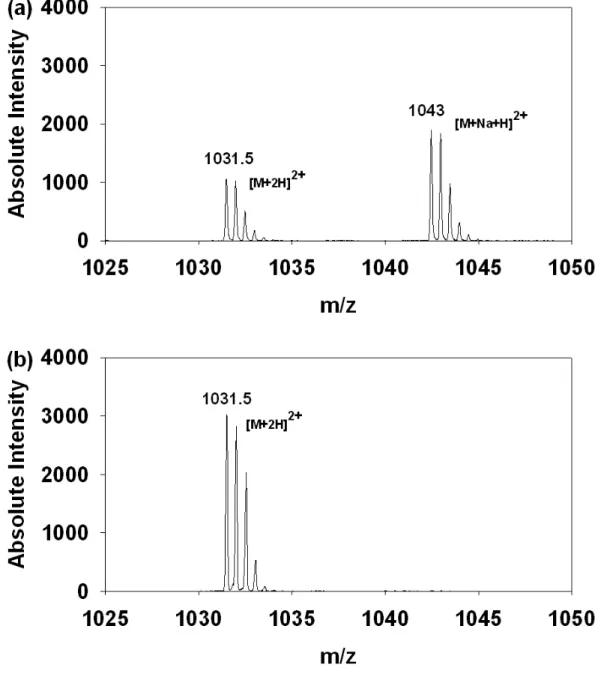
Figure 4. The IMAC eluent from β-casein tryptic peptides using different elution
buffer. (a) Na 2 HPO 4 . (b) NH 4 H 2 PO 4 .
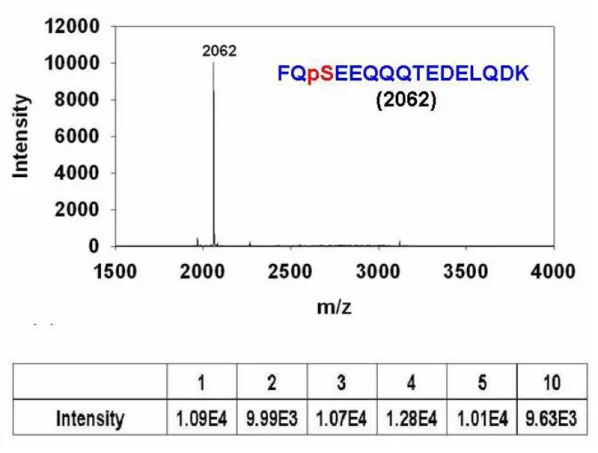
Figure 5. Test of IMAC reused efficiency. (a) MALDI-TOF MS spectrum of Fe (III)
IMAC purified tryptic β-casein peptide mixtures (b) Intensity of the observed
phosphopeptide after 1-10 times IMAC purification.
Figure 6. MALDI-TOF MS spectrum of Fe (III) IMAC purified 0.1 µg tryptic β-casein
peptide mixtures.
Figure 7. MALDI-TOF MS analysis of (a) 5 µg (b) 10 µg (c) 20 µg (d) 30 µg (e) 20 µg
of the β-casein. IMAC flow through.
Figure 8. The extracted ion chromatograms (XIC) of phosphopeptide from β-casein (a)
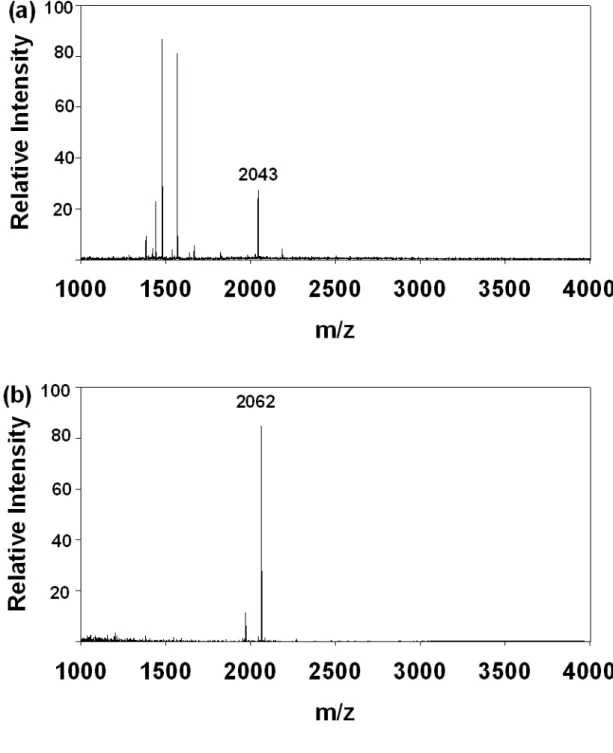
Figure 9. MALDI-TOF MS spectra under 1:200 mass ratio (w/w) of β-casein
phosphorylated peptides and BSA peptides. (a) without IMAC enrichment (b) after
IMAC enrichment.
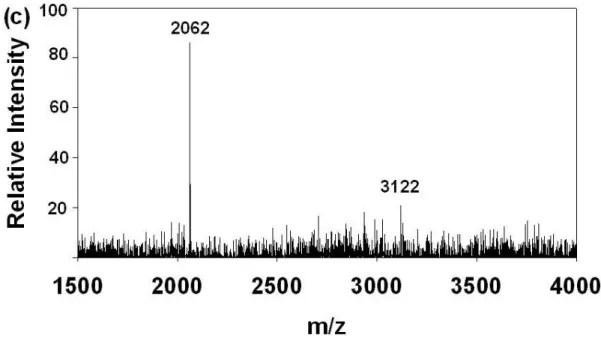
Figure 10. MALDI-TOF MS spectra under 1:1000 mass ratio (w/w) of β-casein
phosphorylated peptides and BSA peptides. (a) without IMAC enrichment (b) after
Figure 11. (a) SDS-PAGE of β-casein (lane 1) and β-casein with cell lysate (lane 2).
(b) The β-casein tryptic peptide enriched by IMAC.
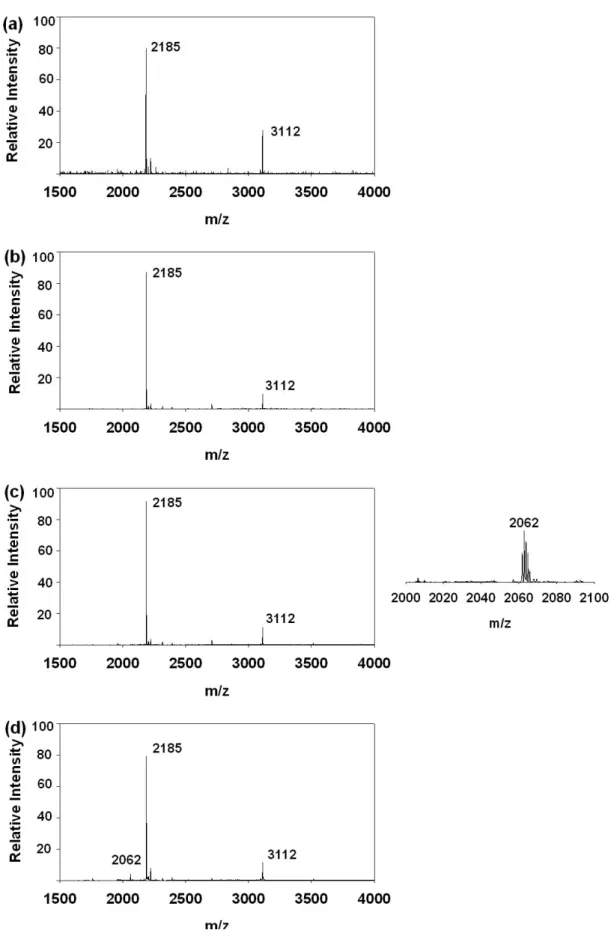
Figure 12. The MALDI–TOF MS spectrum of the phosphopeptide with heptamethyl
ester after IMAC enrichment.
Figure 13. XIC spectra (a) FQpSEEQQQTEDELQDK (b) + 7 Me-ester (c) + 6
Me-ester (d) + 5 Me-ester.
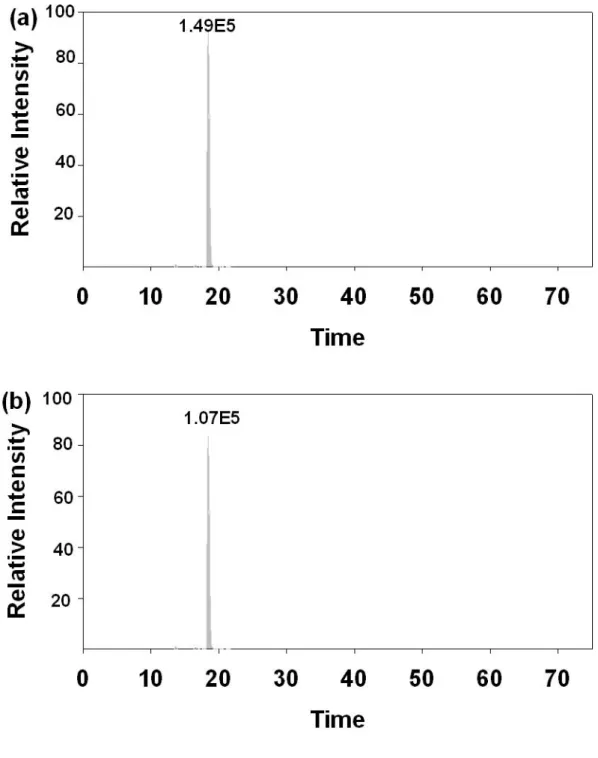
Figure 15. (a) TIC of nLC-MS/MS from human Jurlat T cell without IMAC
purification. (b) Database search and statistical results.
Figure 16. (a) TIC of of nLC- MS/MS from human Jurlat T cell after IMAC
purification (b) Database search and statistical results.
Figure 17. Comparison of different pH on the binding specificity of IMAC column.
The summary of identified phosphorylated proteins is listed at different pH. (a) pH
3.5. (b) pH 3.0.
Figure 18. Experimental scheme for the phosphoryated proteins from the cytosolic
fraction in human Jurkat T-cell
Figure 19. 8 mg proteins from cytoplasmic extract was separated by a preparative 12.5
% SDS-PAGE gel (18 cm × 18 cm × 0.15 cm).
Figure 20. The summary of identified phosphorylated proteins from database search
and the distribution of their molecular weight from SDS-PAGE fractionation.
Figure 21. The summary of total gel fractions at pH 3.0.
Table 1. The spectral data for each chromatographic peak from XIC can be integrated
peak area to calculate the quantities of the phosphopeptide.
Table 2. Coupling of Fe (Ⅲ) IMAC with nLC-MS/MS analysis, ten phosphopeptides
were identified.
Table 3. The [A - ] / [HA] ratio of aspartic acid, glutamic acid, and phosphory residues at pH 2 ~ 5 and [A - ] / [HA] + [A - ] ratio of aspartic acid, glutamic acid, and phosphory residues at pH 2 ~ 5. (HA ↔H + + A - , acid dissociation constant
] [
] ][
[ HA
A K
aH
−