CHAPTER III. RESEARCH METHODOLOGY
This chapter explains and describes the methodology used in this study.
Framework of the study
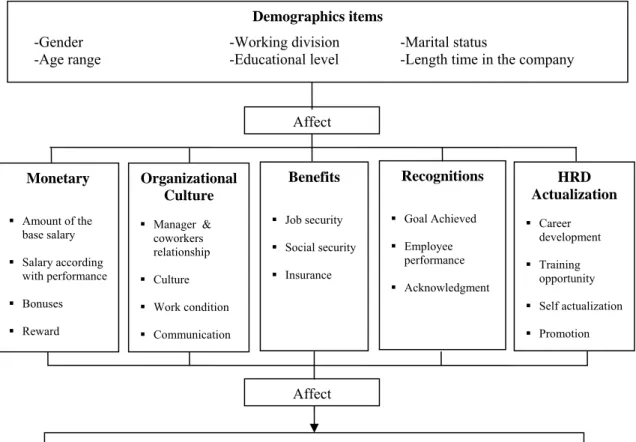
The framework of the study shown in figure 3.1 was developed according to the purpose of this study and the literature review. In this exploratory study, the researcher used five factors of motivation; these factors were based specifically on the Maslow’s hierarchy of needs theory and Hertzberg theory. Within the framework the researcher tried to explore the different items that were related to each of these categories, and then demonstrated the motivational factors that had more effects on the workforce performance, and the motivational factors that were more relevant to the workforce.
Monetary
Amount of the base salary
Salary according with performance
Bonuses
Reward
Organizational Culture
Manager &
coworkers relationship
Culture
Work condition
Communication
Benefits
Job security
Social security
Insurance
Recognitions
Goal Achieved
Employee performance
Acknowledgment
HRD Actualization
Career development
Training opportunity
Self actualization
Promotion
Motivation of the employees’ to improve performance Demographics items
-Gender -Working division -Marital status
-Age range -Educational level -Length time in the company
Affect Affect
Figure 3.1 Framework of the study
Methods and processes of the study
The objectives of this section are to explain the research method and the processes used to collect data for the development of the exploratory study.
Method
This study was a non-experimental quantitative method, because in this study the researcher wasn’t manipulating the variables (Johnson & Christensen, 2004). The researcher focused on the cross sectional survey were the survey was administrated one time to the participants, because the researcher was only interested in the opinions from the large group of employees about their motivational factors inside the organization that affected employees’ performance. The researcher chose the cross sectional survey because this method collected information from a sample that was drawn from a predetermined population. Furthermore, as was explained above, the information was collected at one time period, although the time taken to collect all of the data desired varied from a day to a few weeks or more (Liou, 2005, p.432). The survey method employed has been extensively used in educational and social sciences research, were normative descriptive data as well as exploring relationships between multiple variables were examined (Borg & Gall, 1989). In this study, a single-time survey collection method was used.
Target population
The target population of the study covered the employees of the Cervecería Hondureña in San Pedro Sula that were working at the headquarters of the Honduran organization. The population included the workforce that was engaged in the activities of the organization. The total population at the headquarters of this company was 2,621 employees (July 8, 2006; Cervecería Hondureña Company, human resources department).
Sampling size
The researcher applied four hundred thirty-seven questionnaires and the number that replied to the questionnaires was four hundred thirty-three which represented 99.08% of the sample size. Given this number indicated that the study had high validation. The
99.08% indicated that this study survey got back almost hundred percent of the questionnaires because the researcher had the total support of the company to make this study.
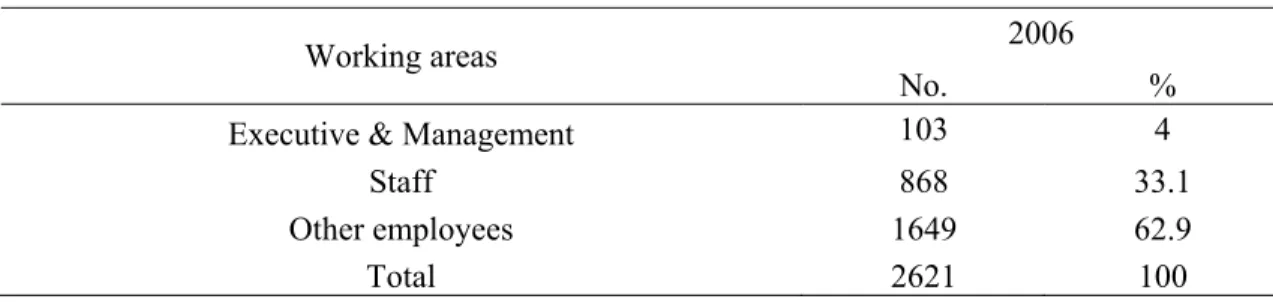
From these four hundred thirty-seven questionnaire the researcher took 58.3% from the executive and management division, which accounted for almost the entire population, because the population in this division was smaller compared to the others two division, and to give support and validation to the study the researcher made that decision; from the other two division which included the staff members and the other employees the researcher took 15% of the population.. Below in table 3.1 clearly illustrates the employees division in the Cervecería Hondureña Company.
Table 3.1 Employees number at Cervecería Hondureña
2006 Working areas
No. %
Executive & Management 103 4
Staff 868 33.1
Other employees 1649 62.9
Total 2621 100
Data sources retrieved from Cervecería Hondureña.
In this way, the researcher obtained the sample number that the researcher needed to go ahead with this study.
Instrumentation
The instrumentation used in this survey study was the motivation questionnaire modified from MySkillsProfile.com (February 5, 2006) and another dissertation paper that evaluated the job motivation. The questionnaire covered all the factors in each category, complimented to this questionnaire used in the study the researcher add the demographic questions which inquired about position, gender, marriage status, and others questions relevant to this study; in order to gather necessary information to know the sort of motivational factors that affected the workforce performance.
This questionnaire used was done by John Smith (2004) and was applied to all people who want to know more about their own motivation at work. This questionnaire has been
used around the world to assess the critical elements of work that influence a person's motivation in a job. (MySkillsProfile.com, February 5, 2006).
The researcher also used other questionnaire to complete and give more support to the questionnaire retrieved from the MySkillsProfile (February 5, 2006), this other questionnaire was validated by Susan (2002) in her dissertation, validated the instrument used in this research for the Honduras company. The results of the “A comparison of the motivational factors of baby boomer and generation X employees” got a significance level of 0.777 with a t-test of 1.07 on the challenging work section, t-test of -0.25 on importance of compensation, t-test of 0.70 on importance of feeling, and a t-test of 0.65 on importance of trust (Koenigsknecht, 2002). These figures show a high level of validity and reliability of the questionnaire used in this study.
The questionnaire was the most efficient way to understand the motivational factors that affected the employees’ performance. The questionnaire’s main objective was a self- report data-collection instrument that each research participant filled out as a part of this exploratory study (Johnson & Christensen, 2004, p.164). The researcher used the questionnaire because it obtained information about the thought, feelings, attitudes, beliefs, values, perceptions, personality, and behavioral intentions of the employees about the motivational factors inside of the organization. With this questionnaire the researcher measured the motivational factors using this data-collection instrument. Each of the participants in this study received a questionnaire survey to fill that told about their own feelings and experiences at the workplace.
This questionnaire was adapted in order to be consistent with the Honduran society, and with the researcher’s needs. Also this questionnaire was translated into Spanish, since all the research participants were native Spanish speakers. This was done by both the researcher and an independent Spanish language expert in order to compare the differences in meaning so as to minimize misinterpretation of questions. The questions in the questionnaire were measured using the Likert Scale with five-point measurement. In fact, the scale used was labeled as follows: “no important at all” 1, “unimportant” 2,
“neutral” 3, “important” 4, and “very important” 5, for each of the questions. At the end of this study the researcher identified the motivational factors that affected the employees’ performances in the organization under study.
The questionnaire was divided into six sections: the first section asked the participants all the demographic data; and the remaining five sections focused on the motivational factors that affected the employees’ performance. These five sections questions referenced; the monetary factors, the organizational culture, the benefits on the organization, recognitions, and the HRD actualization. In this regard the researcher covered all the motivational factors that were referenced to this survey study.
Validity
The validity and reliability of this study was based on the sample size selection, which came from the whole employees’ population that was working in this organization. The researcher with the help of statistical description and interpretation used the sample size determiner to identify the number of participants needed in the study. The random sampling selection was the way that the researcher gathered the sample size, which made the sampling highly valid.
Validity of an instrument refers to the extent to which an instrument measures the variables the researcher wants to measures. The extent to which an instrument represents the content of interest is referred to as content validity (Ary, 1990).
The procedure of adapting questions from both questionnaires was found to be reliable and valid in other context of new survey instruments used in standard procedure (Wilkerson & Kellogg, 1994). While the use of questions from one survey to another does not wholly substitute for direct reliability and validity checking of the instrument, it at least provides evidence of face validity and a measurement of content of validity (Webb, 200).
This instrument got the validity from the expert that evaluated and approved during the proposal defense of this study, they agreed with the questionnaire and the area that the questionnaire was develop to survey. The reliability of this instrument refers to the degree of consistent measurement of the variables. Statistical analysis was used to draw the correlation between the variables. The motivational factors identified in the study served as the variables that were used to interpret the results in the study by correlating the scores obtained from the same subjects on different occasions, the researcher estimated the reliability of a research instrument (Ary, 1990).
Reliability
After obtaining the questionnaire survey from Honduras, the researcher used the answers provided by the target population to test the reliability of the study’s framework and the questionnaire survey. Using the statistical tools of internal consistency and matrix rotation the researcher use the tested results to remove some questions from the questionnaire that were not relevance to the study. These results are explained in more detail in chapter four of this study.
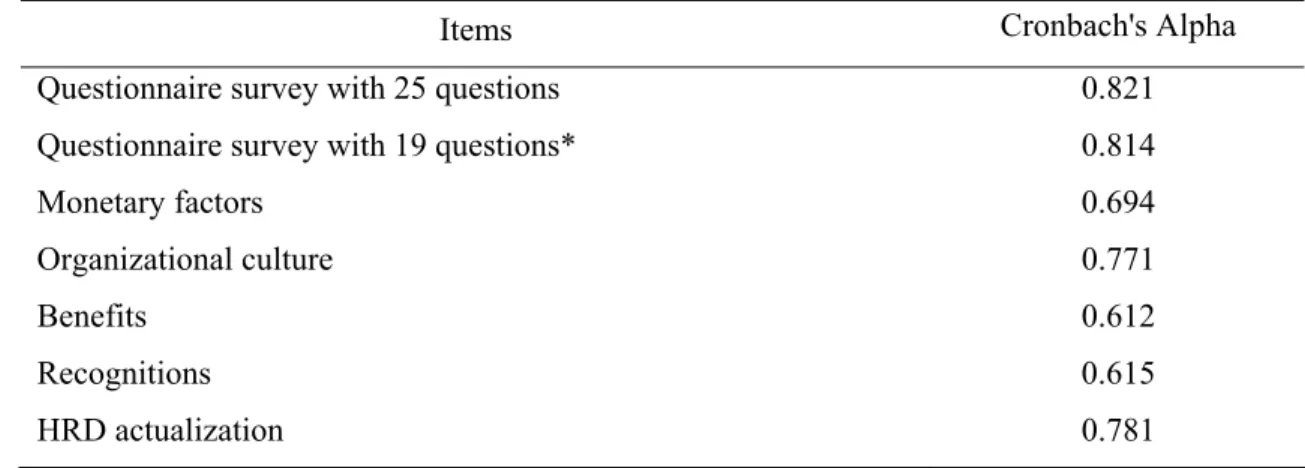
To provide validity and reliability to this study the researcher made use of the internal consistency, these statistic method is the coefficient of test scores; in the simply way we can say that is the consistency of results across items within a single test (Wikipedia, 2007). The results of the twenty-five question from the questionnaire, gave a reliability interpretation of the questionnaire and the overall framework of the study. The reliability that resulted was 59.69% which meant that the framework of the study with their five factors was able to evaluate the motivation at that percentile, also resulted with a Cronbach’s alpha of .814. In this way the questionnaire survey results indicated that six out of the twenty-five questions were no relevant or significant for the study. Therefore, with this situation the researcher decided to remove those six questions given that they were not statistically significant. The remaining nineteen questions were used to test the hypothesis in the study against the demographic items. The questions that were pulled out from the questionnaire were questions; five, six, fourteen, eighteen, twenty, and twenty-two. After they were removed from the data the researcher ran the test again and it resulted with Cronbach’s alpha (α) of .821. As a result, the reader won’t find these six questions in the results chapter, since they were removed.
Leaving out these items from the framework of the study the researcher obtained the monetary factor with α of .694; the organizational culture with α of .771; the benefits with α of .612; the recognitions with α of .615; and the HRD actualization with α of.781, also see table 3.2. With these result we can see the importance of the items that were used in the framework of this study, giving a validity and reliability to support this study.
Table 3.2 Reliability data
Items Cronbach's Alpha
Questionnaire survey with 25 questions 0.821 Questionnaire survey with 19 questions* 0.814
Monetary factors 0.694
Organizational culture 0.771
Benefits 0.612
Recognitions 0.615
HRD actualization 0.781
* Questions five, six, fourteen, eighteen, twenty, and twenty-two were removed
Research procedure
The survey instrument was applied to the employees in Cervecería Hondureña, at San Pedro Sula, where its headquarters was located. Since the researcher was in Taiwan and the company was located in Honduras, the survey questionnaire was administrated by the researcher assistant in Honduras, who received all the instruction from the researcher about how to administer the questionnaire, i.e. how many questionnaire needed to be administered and in what area or division, and how to explain the instructions to the participant. The instructed area were about the purpose of the study, as well as the permission needed for participate in the study. The questionnaire was accompanied by a consent letter. The consent letter asks each participant if he or she wants to participate in the study, explaining about the research purpose and objective and concluded with a note of confidentiality and contact information. The questionnaire survey was administrated to the whole organization after confirmed agreement from the management of the organization.
After the research assistant collect the complete survey questionnaires, the assistant send all the responses of the participants to the researcher, by postal service. Upon receipt of the questionnaire survey, from the research assistant, the researcher translated the answers to English, then coded the quaternary and keyed the data into the Statistical Package for Social Sciences (SPSS 12.0.1) statistical program. The coding allowed the researcher to easily enter the data into the SPSS 12.0.1 and run the information. The coding that were assigned the first section was coding in this way, sex is gender, age is
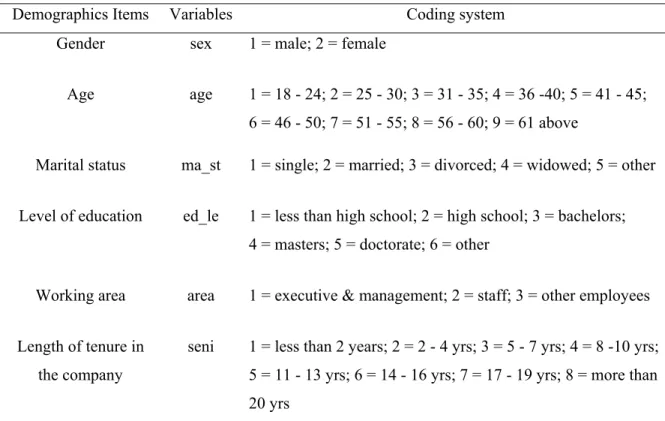
participant age, ma_st is marital status, ed-le is educational level, area is working division in the company, and seni is the length of tenure into the organization as we can see in table 3.2; and the questions were codified fron Q1 as question 1 until Q25 that is question 25.
Table 3.3 Coding system used in SPSS
Demographics Items Variables Coding system Gender sex 1 = male; 2 = female
Age age 1 = 18 - 24; 2 = 25 - 30; 3 = 31 - 35; 4 = 36 -40; 5 = 41 - 45;
6 = 46 - 50; 7 = 51 - 55; 8 = 56 - 60; 9 = 61 above
Marital status ma_st 1 = single; 2 = married; 3 = divorced; 4 = widowed; 5 = other
Level of education ed_le 1 = less than high school; 2 = high school; 3 = bachelors;
4 = masters; 5 = doctorate; 6 = other
Working area area 1 = executive & management; 2 = staff; 3 = other employees
Length of tenure in the company
seni 1 = less than 2 years; 2 = 2 - 4 yrs; 3 = 5 - 7 yrs; 4 = 8 -10 yrs;
5 = 11 - 13 yrs; 6 = 14 - 16 yrs; 7 = 17 - 19 yrs; 8 = more than 20 yrs
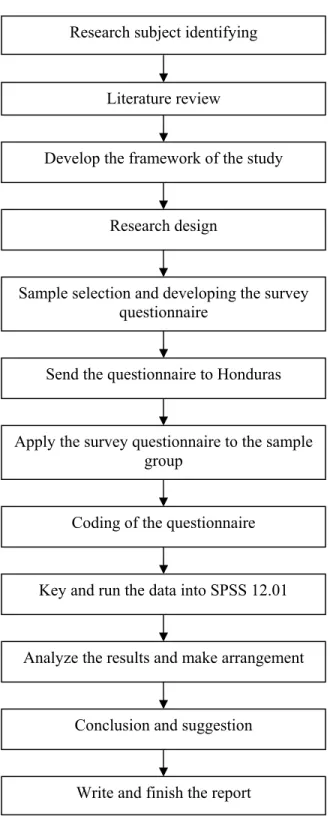
After the researcher coded and uploaded the information then the statistical program launched then the results were interpreted to better understand the motivational factors that affected the employees in the company. Therefore, with these testes the researcher was able to answer the hypotheses and answer the research questions. In figure 3.1 details the researcher process used in the study:
Research subject identifying
Literature review
Develop the framework of the study
Research design
Sample selection and developing the survey questionnaire
Apply the survey questionnaire to the sample group
Analyze the results and make arrangement
Conclusion and suggestion
Write and finish the report Coding of the questionnaire
Key and run the data into SPSS 12.01 Send the questionnaire to Honduras
Figure 3.2 Research process.
Data Analysis
The researcher used the descriptive and inferential statistics to analyze and to interpret the data collected from the target population, and with this was able to present the relevance and importance of the case under study.
The researcher used the descriptive statistics to find the ranking of responses for each question in the questionnaire and in this way found which question were more selected as very important by the participants. Moreover, the researcher also used the descriptive statistics to identify which motivational factor category got the majority of scores and which were the most important. So in this way, the descriptive statistic was used to answer the research questions addressed in the study.
After the descriptive analysis the researcher used inferential statistic to test the six different hypotheses in this study. To do this, the researcher tested the hypotheses with T- test and ANOVA. The T-test was used to answer the hypothesis that had two variables, and the ANOVA was used to answer the hypotheses that had more than two variables.
The researcher utilized the SPSS 12.0.1 software to interpret the data and with the results either “accept” or “reject” the hypotheses in the study. These results are seen in the following chapter of this paper, i.e., in chapter four the researcher put forward the detailed results obtained from the SPSS software.