Research Memorandum 04/2021 14 April 2021
UNDERSTANDING RENMINBI EXCHANGE RATE VOLATILITY
Key Points
The volatility of renminbi exchange rate has notably increased since the 2015 renminbi exchange rate reform. Increased ebbs and flows in the renminbi exchange rate have raised some concerns about the potential impact of the currency’s gyrations on the economy and financial stability. This study attempts to identify the cause of renminbi exchange rate volatility, by decomposing renminbi exchange market pressure (EMP) using a structural vector autoregressive (SVAR) model.
The results show that in more recent period sentiment appears to have played a less important role in driving the renminbi exchange rate, especially during depreciation episodes. In particular, while negative sentiment shocks seemed to have been the dominant factor driving the renminbi weaker in 2018/19 of the trade-war episode, negative fundamental shocks seemed to have played a more important role during depreciation episodes related to COVID-19 in the first half of 2020.
In addition, market sentiment tends to improve after the activation of the countercyclical factor in the CNY fixing formation mechanism, in line with the view of the PBoC that the countercyclical factor alleviates the “herding effect” in the foreign exchange market and promotes market rationality.
Prepared by: Sharon Xiaohui Wu and Alex Cheng
Economic Research Division, Research Department Hong Kong Monetary Authority
The views and analysis expressed in this paper are those of the author, and do not necessarily represent the views of the Hong Kong Monetary Authority.
*The authors would like to thank Lillian Cheung, Michael Cheng, and Yongxiang Bu for valuable comments and suggestions.
1
I. INTRODUCTION
The volatility of the CNY/USD exchange rate has increased notably since the 2015 renminbi exchange rate reform (Chart 1). Increased ebbs and flows in the renminbi exchange rate have raised some concerns about the potential impact of the currency’s gyrations on the economy and financial stability, particularly if it is prone to sentiment-driven depreciation in periods of market stress.
Chart 1. CNY/USD exchange rate volatility
Sources: CEIC and author’s calculation.
Conceptually, renminbi exchange rates can be affected by many economic and geopolitical events, such as fluctuations in Mainland China’s growth rates, returns on financial assets, changing market expectations following the 2015 exchange rate reform, and developments in China-US tensions. To facilitate a better understanding, instead of looking at each event, we consider a wide range of structural shocks deemed to be relevant to exchange rate movement in the literature. More specifically, we study how different types of shocks have shaped the fluctuation of renminbi exchange market pressure (EMP) using the structural vector autoregression (SVAR) model following Forbes et al.
(2018). Focusing on the renminbi EMP rather than the nominal exchange rate allows us to take into account the fact that the renminbi is not free floating and part of the market pressure facing the currency is reflected in changes in Mainland foreign reserves.
II. EMPIRICAL FRAMEWORK AND DATA 2.1 Empirical framework
2
In the literature, there are various models explaining the behavior of exchange rates, for example, Meese and Rogoff (1986), Molodtsova and Papell (2009). We aim differently in this paper and adopt a SVAR framework to identify the underlying drivers of exchange rate volatility. The general form of a VAR(p) model can be written as:
A = + + ⋯ + + (Structural form) (Eq. 1)
= + + ⋯ + + (Reduced form) (Eq. 2)
where = , with being the reduced-form errors and being the structural shocks. Based on Forbes et al. (2018), we identify six types of shocks in the SVAR model: (1) domestic supply shocks (e.g. changes in productivity);
(2) domestic demand shocks (e.g. fiscal stimulus); (3) monetary shocks (e.g.
changes in policy rates); (4) sentiment shocks; (5) global persistent shocks (e.g.
global productivity shock); and (6) global transitory shocks (e.g. fluctuation in foreign stock markets)1. These shocks are widely considered by researchers as important drivers of exchange rate fluctuation, and are broad enough to be useful to policy analysis.
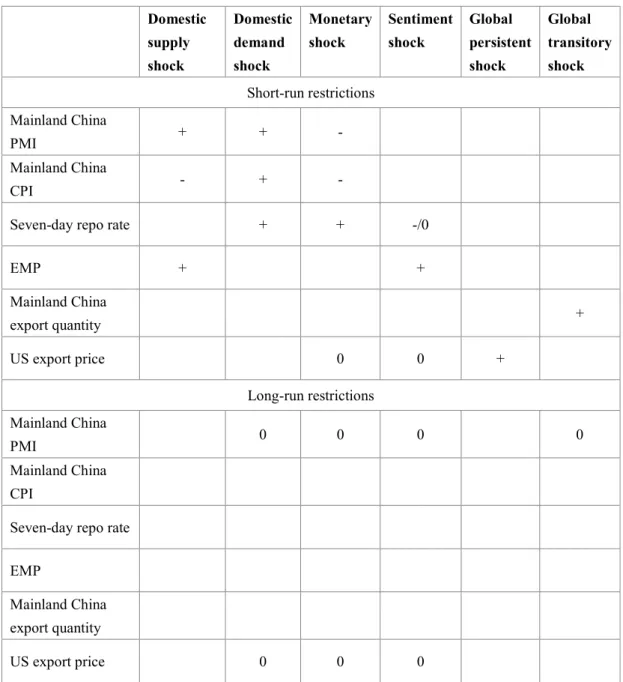
To identify these shocks, a combination of short-run and long-run zero restrictions and sign restrictions2 similar to Forbes et al. (2018) are imposed, with some modifications3 (see Table A1 in the Appendix for a summary). Since the goal is to identify the drivers of the renminbi EMP volatility, few ex-ante restrictions are placed on the exchange rate variable. More specifically, besides the sentiment shock which is assumed to directly affect the EMP, the only other restriction imposed on the exchange rate variable is that positive supply shocks would lead to an appreciation of the domestic currency4. Alternative sets of identification restrictions are explored as robustness check in Section IV.
1 Here we do not provide an exhaustive list of events that could affect the renminbi exchange rate apart from those in the brackets. No matter how different the events may be, they can be captured by the structural shocks we identify here according to how these events affect variables in the model.
2 Mutually independent economic shocks are identified through imposing zero restrictions and sign restrictions, both short-term and long-term. This means different shocks can be distinguished based on whether they have an impact on a certain economic variable (zero restrictions) and the direction of their impacts according to economic theories (sign restrictions). The algorisms for imposing the restrictions are based on Binning (2013).
3 The main difference is that domestic supply and demand shocks are allowed to affect foreign prices in the short run since Mainland China is a large economy, unlike in Forbes et al. (2018), which looks at a small open economy and assumes that domestic shocks have no impact on foreign variables.
4 We view a positive supply shock as a sign of significant economic improvement, therefore restricting its impact on exchange rates to be positive. For other shocks, such as demand shocks and monetary shocks, we prefer to let the data decide how the exchange rate is affected rather than impose strict restrictions. Nevertheless, our ex-ante expectation is that positive demand shocks and monetary tightening will strengthen the exchange rate.
3
2.2 Data
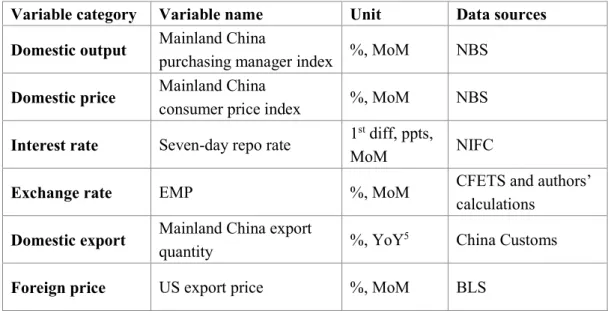
Variables used in the SVAR is presented in Table 1. Variables are of monthly frequency and the sample period is Jan 2014 – Aug 2020.
Table 1. Variables and data sources
Variable category Variable name Unit Data sources Domestic output Mainland China
purchasing manager index %, MoM NBS Domestic price Mainland China
consumer price index %, MoM NBS Interest rate Seven-day repo rate 1st diff, ppts,
MoM NIFC
Exchange rate EMP %, MoM CFETS and authors’
calculations Domestic export Mainland China export
quantity %, YoY5 China Customs
Foreign price US export price %, MoM BLS
We focus on the renminbi EMP instead of the nominal exchange rate to better reflect conditions in the foreign exchange market. The renminbi EMP is constructed as follows:
= ∆ + ∆ ,
where ∆ is the monthly change of the CNY/USD nominal exchange rate and
∆ is the monthly change in official reserves (excluding foreign exchange valuation effects6) scaled by narrow money supply. An increase in the value of the EMP means an increase in appreciation pressure on the renminbi. Following common practice in the literature, the weightings and in this study are assumed to be equal, but the results are robust to alternative weightings which are discussed in the Section IV.
III. EMPIRICAL RESULTS
We first examine how renminbi EMP would respond to structural shocks and whether the responses align with our expectations through impulse
5 While the YoY form is common for exports, results are robust to using the MoM form based on seasonality-adjusted exports.
6 The valuation effect captures changes in the book value (in US dollars) of foreign reserves due to changes in foreign exchange rates.
4
response functions (IRF).
Chart 2 presents the main IRF results. In particular, while the renminbi EMP responds most rapidly and strongly to sentiment shocks, the effects also die out quickly (i.e. the cumulative impulse response flattens out).
The response of the EMP to tightening monetary shocks tends to be positive on average. The response of the EMP to supply shocks is weaker than to demand shocks in the short run, but the effect lasts longer. Global shocks in general are found to have limited impact on the EMP7 (see Chart A1 in the Appendix for a full set of IRFs).
Chart 2. Cumulative impulse responses of the renminbi EMP to structural shocks
Positive sentiment shock Tightening monetary shock
-1.5 -1 -0.5 0 0.5 1 1.5 2
0 6 12 18 24 30 36
0 0.5 1 1.5 2 2.5
0 6 12 18 24 30 36
Positive domestic supply shock Positive domestic demand shock
3.5 2
3 1.5
2.5 1
2 0.5
1.5 1 0
-0.5 0.5
0 -1
-0.5 -1.5
0 6 12 18 24 30 36 0 6 12 18 24 30 36
Months after shock
Note: Median impulse responses are represented by solid lines. Confidence bands at the 68%
threshold are represented by dashed lines.
Next, we show in Chart 3 the historical decomposition of the EMP obtained from the model. It presents the contribution of different shocks to the fluctuation in the renminbi EMP (also see Chart A2 in the Appendix, which
7 Confidence bands tend to be wide for some impulse responses, especially shocks with few ex-ante identification restrictions. For example, the two types of global shocks have the widest confidence bands, likely due to few identification restrictions. Nevertheless, focusing on the 68% confidence bands, the interpretations for sentiment and supply shocks are quite robust.
5
combines domestic shocks and global shocks respectively to give a more succinct picture).
Chart 3. Historical decomposition of the renminbi EMP
Note: The chart depicts the contributions of the six shocks to monthly changes in the renminbi EMP.
The results shown are the average of 1,000 historical decompositions obtained from the SVAR estimation.
The general observation from Chart 3 is that in periods of large fluctuation, changes in market sentiment (blue portion) usually play a big role.
Also, while supply shocks tend to play a smaller role in general, its importance increases in periods of large volatility.
We then focus on the most notable appreciation and depreciation episodes (marked in Chart 3) since they are more closely related to financial stability. These episodes are divided into three groups based on the dominant event of the period (i.e., pre-trade war, trade war, and COVID-19 outbreak) to facilitate a better discussion.
- Pre-trade-war appreciation episode: January 2018 (yellow box in Chart 3). The results show this episode was defined by sentiment and global shocks, rather than changes in more fundamental factors such as domestic supply and demand. This seems to be consistent with the background narrative: In early 2018, there was an expectation that the strong US economy will spill over globally, making other central banks to tighten and catch up with the Fed’s
6
normalization pace. Thus changes in global environment and sentiment rather than domestic fundamentals are the main drivers of this episode.
- Trade-war depreciation episodes: June and July 2018, January 2019, May 2019, and August 2019 (orange boxes in Chart 3).
Sentiment shocks related to developments in the China-US trade tensions played important roles in these episodes. In addition, domestic demand shocks also tended to push in the same direction in these episodes, magnifying the sentiment effect. In contrast, although the US has opened trade related investigations on China as early as in mid-2017, the renminbi foreign exchange market was relatively stable on the back of a vibrant domestic economy, until economic activities slowed down in the second quarter of 2018 due to various factors, such as a tightening of local government financing which slowed down infrastructure investment.
- COVID-19 depreciation episode: February and March 2020 (blue box in Chart 3). COVID-19 outbreak is likely the main driver of this episode. In February, industrial production fell dramatically in Mainland China due to strict virus containment measures such as city lockdowns and production suspensions. In March, the effects of negative domestic shocks began to wane while negative global shocks started to set in. Meanwhile, sentiments held up relatively well and monetary shocks only had small effects. This could be because that the number of newly confirmed cases in the Mainland has been on the decline since mid-February, earlier than expected, which may have helped lift market confidence. Also, the PBoC did not conduct excessive easing in the face of the outbreak, resulting in limited depreciation pressure.
Lastly, we put together the sentiment shock and the countercyclical factor in the CNY fixing formation mechanism; the latter is meant to be implemented to counter abnormal market sentiment. Chart 4 shows that market sentiment tends to improve after the countercyclical factor is activated. This is in line with the PBoC’s assessment, which stated that the countercyclical factor counteracted the pro-cyclicality of market sentiment and alleviated the “herding effect” in the foreign exchange market, thereby promoting market rationality8.
8 See China Monetary Policy Report, Second Quarter 2017.
7
Chart 4. Sentiment shocks and the PBoC countercyclical factor
IV. Robustness check
First, we try to construct EMP in different ways. According to the literature, instead of using equal weights, we assign different weights to the two EMP components. As discussed in Goldberg and Krogstrup (2019), there is a long-standing debate regarding the optimal weighting and a specific weighting choice necessarily reflects one’s judgement of which part is more important for the EMP. In the baseline case, we give equal weights to each component. This implicitly allows changes in exchange rates (more volatile) to have a larger influence on EMP volatility; this seems to be proper given the lesser role of foreign exchange intervention in recent years. Nonetheless, we also explored different weightings; for example, similar to Kaminsky and Reinhart (1999), weights are chosen so that the EMP components have equal volatility across (1) the whole sample and (2) in each year.
While changing from equal weights to equal variance changes how the EMP looks in extreme episodes (i.e., its variance in turbulent years such as in 2018 and 2019 becomes smaller; the overall volatility is smoothed as expected), we still observe well-held-up sentiment amid the recent COVID-19 depreciation episode, compared with previous extreme episodes which are largely sentiment driven. We also extract the sentiment shock in this setting and plot it against the introduction/fade-out of the countercyclical factor. While the volatility of the sentiment shock decreased under the new weighting, the general
8
pattern remains: Market sentiment tends to improve after the countercyclical factor is activated.
Second, we change some of the identification assumptions. In particular, we allow a domestic demand shock to affect foreign export price in the long run, and let domestic inflation fall after a positive sentiment shock in the foreign exchange market (i.e., stronger currency passes through to lower domestic prices). The main results remain valid with these alternative identification restrictions.
Lastly, Mainland China has seen further opening up of its capital markets in recent years, with the launch of Shanghai-Hong Kong and Shenzhen- Hong Kong Stock Connect in 2014 and 2016 respectively and the launch of Bond Connect in July 2017. Foreign investment in Mainland capital markets has increased along with the availability of these new channels, which may raise concerns about structural changes in the renminbi foreign exchange market.
Therefore, we estimate the SVAR model again using the subsample of Aug 2017 – Aug 2020, when the above mentioned Stock Connect and Bond Connect have already been in place. The main findings from the baseline model remain valid with this alternative sample.
V. CONCLUSION
This study decomposes the market-driven part of renminbi exchange rate variance (measured by renminbi EMP) into underlying structural shocks. Such decomposition can facilitate a timely interpretation of fluctuations in the renminbi foreign exchange market. For example, while multiple forces were at work during the trade-war period, negative sentiment shocks were the key driver of the downward foreign exchange market pressure in mid-2018 and 2019. In contrast, while there was significant downward pressure on the renminbi in February and March 2020 amid the COVID-19 outbreak, sentiments held up well in this episode, with negative domestic shocks being the key drivers of foreign exchange market pressure in February and negative global shocks being the key driver in March. Our results show that in more recent period sentiment appears to have played a less important role in driving the renminbi exchange rate, although whether the trend will continue remains to be seen.
In addition to showing that movements of the renminbi EMP tend to be dominated by different types of shocks in different periods, our analysis also suggests that the activation of the countercyclical factor in the CNY fixing formation mechanism helps stabilise market sentiment. Since market sentiment can be pro-cyclical especially in stress times, the countercyclical factor helps limit the potential impact on financial stability by alleviating the “herding effect”
9
in the foreign exchange market and promoting market rationality.
10
REFERENCES
Binning, Andrew. "Underidentified SVAR models: A framework for combining short and long-run restrictions with sign-restrictions." Working Paper 2013/14.
Norges Bank (2013).
Forbes, Kristin, Ida Hjortsoe, and Tsvetelina Nenova. "The shocks matter:
improving our estimates of exchange rate pass-through." Journal of International Economics 114 (2018): 255-275.
Goldberg, Linda S., and Signe Krogstrup. “International capital flow pressures."
No. w24286. National Bureau of Economic Research (2018).
Kaminsky, Graciela L., and Carmen M. Reinhart. "The twin crises: the causes of banking and balance-of-payments problems." American Economic Review 89.3 (1999): 473-500.
Meese, Richard A., and Kenneth Rogoff. "Empirical exchange rate models of the seventies: Do they fit out of sample?" Journal of International Economics 14.1- 2 (1983): 3-24.
Molodtsova, Tanya, and David H. Papell. "Out-of-sample exchange rate predictability with Taylor rule fundamentals." Journal of International Economics 77.2 (2009): 167-180.
Patnaik, Ila, Joshua Felman, and Ajay Shah. "An exchange market pressure measure for cross country analysis." Journal of International Money and Finance 73 (2017): 62-77.
11
Appendix
Table A1. Summary of identification restrictions
Domestic supply shock
Domestic Monetary demand shock shock
Sentiment shock
Global persistent shock
Global transitory shock Short-run restrictions
Mainland China
PMI + + -
Mainland China
CPI - + -
Seven-day repo rate + + -/0
EMP + +
Mainland China
export quantity +
US export price 0 0 +
Long-run restrictions Mainland China
PMI 0 0 0 0
Mainland China CPI
Seven-day repo rate
EMP
Mainland China export quantity
US export price 0 0 0
Note: The first column shows variables used in the model and the first row shows the unobservable structural shocks. “+” means the shock has a positive effect on the variable, “-” means a negative effect.
“0” means zero effect, and a blank cell means no restriction imposed.
12
Chart A1. Impulse response functions from SVAR
Note: Median impulse responses are represented by solid lines. Confidence bands at the 68% threshold are represented by dashed lines.
Chart A2. Historical decomposition of the renminbi EMP
Note: Domestic supply and demand shocks and monetary shocks in Chart 3 are combined into domestic fundamental shocks, and the two global shocks are combined into global fundamental shocks.
13