Chapter Five
Data Analysis and Findings
This chapter presents the data analysis of two questionnaires (WAQ & VOWT), semi-structured interviews, two tests—pre and pro writing proficiency tests, and errors analysis on the two writing proficiency tests of the selected subjects.
5.1 Finalizing the Writing Attitude Questionnaire (WAQ) with Item Analysis, Factor Analysis as well as the Measurement of Reliability and Validity
The following are the description of the process of finalizing of WAQ, including item analysis, factor analysis, the measurement of reliability and the measurement of validity respectively.
.
5.1.1 Item Analysis
Item analysis suggests ways of improving the measurement characteristics of a questionnaire. Based on the correlation analysis and the criterion-referenced method for the internal consistency, we examined the correlation coefficient and critical value (CR) of each statement and found the CR value of 4 statements – namely, Q10, Q13, Q20, and Q37 -- showed no significance (p<0.3). Consequently, the four statements were considered invalid only. Thirty-six statements were left in the writing attitude questionnaire for analysis.
5.1.2 Factor Analysis
Factor analysis attempts, through statistical means, to identify the basic underlying
variables that account for the correlations among test scores. By using the ‘maximum
likelihood’ method, we analyzed the remaining thirty-six statements based on the four
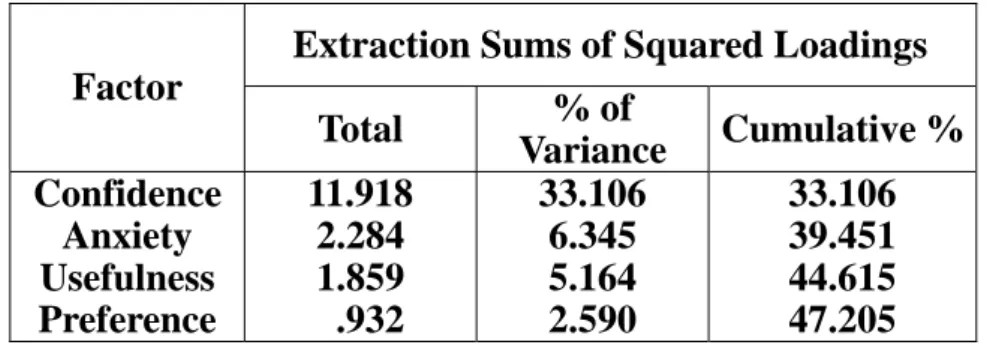
factors, namely Confidence, Anxiety, Usefulness and Preference. The variance of each factor is listed in Table 5.1 below:
Table 5.1 Summaries of Factor Extraction Sums of Squared Loading
Extraction Sums of Squared Loadings Factor
Total % of
Variance Cumulative % Confidence
Anxiety Usefulness Preference
11.918 2.284 1.859 .932
33.106 6.345 5.164 2.590
33.106 39.451 44.615 47.205
5.1.3 Reliability
To determine whether a questionnaire provides a good measure of a specific construct, we must translate the abstract construct into concrete behavioral terms. The process of providing a detailed description of the relationship between specific behaviors and an abstract construct is the key to determining the reliability of a questionnaire (Davidshofer, Charles O. & Murphy, Kevin R.; 1998). Reliability coefficients reveal something about the accuracy of predictions that are based on test scores. The measurement of the reliability showed that c oefficient for internal consistency (Cronbach α) of the WAQ was between .9378 and .9384. Cronbach α for the entire scale was 0.94. It shows that the reliability of the scale was very good.
5.1.4 Validity
Validity coefficient is an evaluative criterion revealing something about the effects
of measurement error on test scores. The measurement of the validity of the WAQ is
as follows: the variance explained by the factor Confidence was 33.10%, 2.59% for
the factor Preference, 6.35% for the factor anxiety and 5.16% for the factor
Usefulness, respectively. The total amount of variance explained by these factors was
47.20%. This is evidence showing construct validity of the scale.
5.2 Statistical Analysis of the WAQ
Descriptive analysis was employed on the data to calculate the total frequency occurrence of the four factors — Confidence, Anxiety, Usefulness, and Preference — evaluate the students’ attitude toward writing. The results are as follows:
5.2.1 Pretest and Protest of the WAQ
The differences in ranking between the pre and post questionnaire were calculated to see if there were positive or negative changes after the constructive task-based writing program. And a matched t-test was run for statistical analysis.
A statistical comparison of the participants’ responses to the WAQ before and after they received instruction shows that on the whole there was no significant difference between the Experimental group and Control group generally among the four factors.
The result is shown on Table 5.2 below:
Table 5.2 The Comparison of the Mean & Standard Deviation for the Pre-Post Tests Measurement of Writing Attitude Factors
Confidence Anxiety Usefulness Preference
Group M SD M SD M SD M SD
2.9395 .6249 3.0956 .7481 3.5577 .3073 3.0051 .6117 2.7465 .6522 3.1360 .6986 3.6772 .4059 2.9195 .6790 (Class 308)
Control Pretest Control Posttest (n=43)
2.8581 .5534 3.2319 .5418 3.5395 .2770 3.0035 .6010 2.8093 .6335 3.0774 .5926 3.5267 .2691 3.0412 .5659 (Class 302)
Experimental
Pretest
Experimental
Posttest
(n=43)
5.2.1.1 Homogeneity Test and Analysis of Covariance (ANCOVA)
With respect to the data above, there was no significant difference between the Experimental Group and Control Group among the four factors. We need to have a close analysis with the Homogeneity Test and an analysis of Covariance (ANCOVA) to evaluate the four main categorical factors individually.
A. Total Scores of Four Factors
First, we made a statistical analysis on the total scores of the four factors by Homogeneity Test and Analysis of Covariance (ANCOVA) to examine whether the underlying variables were controlled under the value (p< .05). And positively, the result below shows its steadiness.
1 Homogeneity Test
Table 5.3 Summary of the Homogeneity Test for the Within Group Regression Coefficient Source of Variance SS df MS F p Pretest*Group 5.447E-02 1 5.447E-02 1.112 .295 Within Group(error) 4.017 82 4.899E-02
Total 837.527 86
p
*<.05
2. Analysis of Covariance (ANCOVA) Table 5.4 Summary of Analysis of Covariance
Source of Variance SS df MS F p Covariance(pretest) 3. 147 1 3.147 64.157 .000 Between Groups 2.996E-04 1 2.996E-04 .006 .938 Within Group (error) 4.072 83 4.905E-02
Total 837.527 86
p
*<.05
With respect to Table 5.5 below, Four Factors Adjusted Means between the Experimental Group and Control Group shows no significance.
Table 5.5 Four Factors Adjusted Means
Adjusted Means Experimental Group Control Group
3.109 3.105
B. Factor Analysis
Since no significant change on Four Factors Adjusted Means between the Experimental Group and Control Group, we decided to analyze the four main categorical factors individually. The results showed no significance was found in the three factors—Confidence (see Table 5.6-5.8 below), Anxiety (see Table 5.9-5.11 below), and Preference (see Table 5.16-5.18 below), except the factor—Usefulness (see Table 5.12 & 5.14 and Figure 5.1 below).
The following are the detailed descriptions of the analyses.
Factor I: Confidence
The data in Table 5.6 below shows no significant difference between the two groups related to the factor—Confidence on Homogeneity Test. Also, in Table 5.7 below, the result shows no significant variance between the two factors. Nevertheless, the Experimental Group got a little higher score than the Control Group with respect to their adjusted means.
1. Homogeneity Test
Table 5.6 Summary of the Homogeneity Test for the Within Group Regression C oefficient Source of Variance SS df MS F p
Pretest*Group .101 1 .101 .456 .501
Within Group
(error)
18.179 82 .222
Total 698.450 86
p
*<.05
2. Analysis of Covariance (ANCOVA) Table 5.7 Summary of Analysis of Covariance
Source of Variance SS df MS F p Covariance (Pretest) 16.444 1 16.444 74.663 .000
Between Groups .328 1 .328 1.489 .226
Within Group (error) 18.280 83 .220
Total 698.450 86
p
*<.05
Table 5.8 Confidence Adjusted Means
Confidence Adjusted Means Control Group Experimental Group
2.716 2.840
Factor II: Anxiety 1. Homogeneity Test
Table 5.9 Summary of the Homogeneity Test for the Within Group Regression Coefficient Source of Variance SS df MS F p Pretest*Group 1 .371 1.729 .192 Within Group(error) 17.610 82 .215
Total 865.383 86
p
*<.05
2. Analysis of Covariance (ANCOVA) Table 5.10 Summary of Analysis of Covariance
Source of Variance SS df MS F p Covariance (Pretest) 17.268 1 17.268 9.707 .000
Between Groups .499 1 .499 2.304 .133
Within Group (error) 17.982 83 .217
Total 865.383 86
p
*<.05
Table 5.11 Anxiety Adjusted Means
Anxiety Adjusted Means Control Group Experimental Group
3.183 3.030
Factor III: Usefulness 1. Homogeneity Test
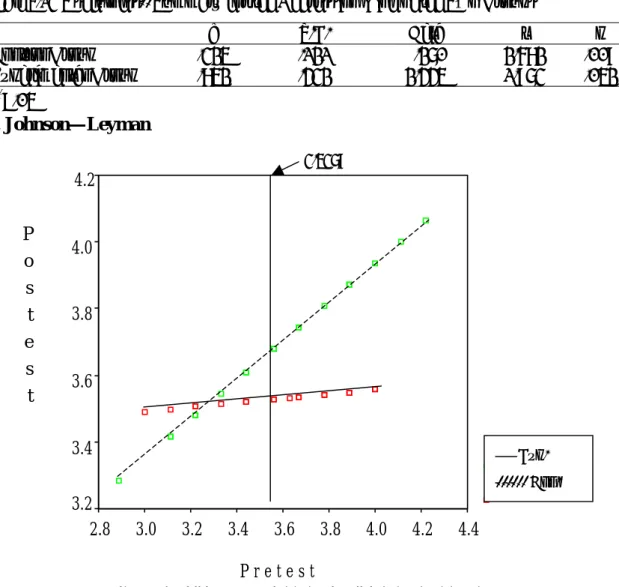
As Table 5.12 below illustrates, the value of the homogeneity test for the within group regression coefficient (p<.035) shows a significant difference. The factor ‘Usefulness’
showed a significant difference between the two groups. Therefore, the method--
Johnson—Leyman was necessarily adopted for a further investigation.
Table 5.12 Summary of the homogeneity test for the within group regression coefficient Source of Variance SS df MS F p
Pretest*Group .483 1 .483 4.609 .035
Within Group (error) 8.585 82 .105
Total 1126.232 86
p
*<.05
Table 5.13 Usefulness--Summary for the Regression Line of the Two Groups
b S.E. Beta t p
Control Group .325 .121 .270 2.682 .009 Experimental Group .852 .432 2.445 1.973 .052 p
*<.05
1. Johnson—Leyman
With respect to the analysis of Johnson—Leyman, the result indicated that the Control Group gave more positive feedback in the score of usefulness especially for those whose scores were beyond the score--3.539. In contrast, the Experimental Group was steady in this section in statistic analysis. The following are the detailed analyses after the Homogeneity Test and Analysis of Covariance on the factor
‘Usefulness'. The results are listed below in Figure 1, Table 5.14, and Table 5.15. All of them P r e t e s t
4.4 4.2 4.0 3.8 3.6 3.2 3.4
3.0 2.8 P
o s t e s
t
4.2
4.0
3.8
3.6
3.4 3.2
Exp.
--- Con.
3.5379
Fig. 5-1 Within Group Regression Line for Usefulness
indicate the consequence of the variation in the factor ‘Usefulness’.
Table 5.14 Usefulness --Summary for the Intersection Point and Critical Points of the Regression Line
____________________________________________________________________
Critical point (Lower) Intersection point of the regression line
-.3557 3.2712
Table 5.15 Summary of Descriptive Statistics for the Test Score on Usefulness
Mean The Lowest
Value
The Highest Value
Average Value
Usefulness (pretest) 86 2.89 4.22 3.5486
Usefulness(posttest)_ 86 2.78 4.56 3.6020
p
*<.05
Factor IV: Preference
The data on Table 5.16 below shows no significant difference between the two groups related to the factor—Preference on Homogeneity Test. Also, on Table 5.17 below, the result shows no significant variance between the two ones. Nevertheless, the score of the Experimental Group ranks higher than the Control Group with respect to their adjusted means.
1. Homogeneity Test
Table 5.16 Summary of the Homogeneity Test for the Within Group Regression Coefficient Source of Variance SS df MS F p Pretest*Group 2.132E-02 1 2.132E-02 .182 .670 Within Group (error) 14.080 82 .172
Total 797.028 86
p
*<.05
2. Analysis of Covariance (ANCOVA) Table 5.17 Summary of Analysis of Covariance
Source of Variance SS df MS F p Covariance (Pretest) 18.706 1 18.706 110.026 .000 Between Groups .325 1 .325 1.910 .171 Within Group (error) 14.111 83 .170
Total 797.028 86
p
*<.05
Table 5.18 Preference Adjusted Means
Preference Adjusted Means Control Group Experimental Group
2.919 3.042
5.2.1.2 Comparison of the Participants’ Responses to Each Item between the Experimental and the Control Group in the Pre and Posttest
In the section, we make a more detailed comparison regarding each items related to the Confidence, Anxiety, Usefulness and Preference.
A. Factor I—Confidence
In section I of the WAQ, when asked to judge the items on confidence in learning writing, most learners in the Experimental group and the Control Group reflected 8 negative feedbacks among 10 statements except Q18, and Q 19. The two items showed that learners viewed writing as a comfortable job and felt they had potentials in English writing, yet the Experimental Group showed much more steady confidence attitude toward activity participation (Q 14) in its post test than the Control in general.
Table 5.19 Summary of the Score Changes on the Statements related to the Confidence B. Factor II—Anxiety
Item Con-pre Exp-pre Con-post Exp-post Con. Change Exp. Change
Q5 2.49 2.37 2.07 2.35 -.42 -.02
Q6 3.37 3.19 3.00 2.95 -.37 -.24
Q7 2.95 3.02 3.00 2.93 +.05 -.09
Q14 3.35 2.95 2.95 2.88 -.40 -.07
Q15 3.07 2.84 2.84 2.72 -.23 -.12
Q16 3.00 3.09 2.86 3.00 -.14 -.09
Q18 2.51 2.58 2.74 2.84 +.23 +.26
Q19 2.65 2.67 2.40 2.98 +.25 +.31
Q26 3.05 3.02 2.88 2.72 -.17 -.30
Q27 2.95 2.84 2.72 2.72 -.23 -.12
With respect to Factor II, we focused on investigating the psychological reaction of learners’ anxiety. Table 5.20 summarizes the results of the survey on the Experimental and the Control Group before and after the program. In the pretest, the ranking of Q 13 (Fear of being flunked in the writing class) shows that the change in the Control Group is more significant than the change in the Experimental Group. Nevertheless, learners showed less anxiety in the statement in posttest-- for both the Experimental Group and the Control Group. Besides, from the ranking of Q 20, Q32, Q33, Q34, and Q36, we find the Experimental Group had less anxiety than the Control Group. Also, the Experimental Group loved to share their works with their classmates (Q 34) and felt freer to express their ideas in their compositions (Q20, 32, 33, and 36)
Table 5.20 Summary of the Score Changes on the Statements Related to the Anxiety Item Con-pre Exp-pre Con-post Exp-post Con. Change Exp. Change
Q10 2.95 2.91 3.12 2.98 +.17 +.07 Q13 3.23 3.12 2.81 3.02 -.42 -.10 Q20 2.53 2.81 3.09 2.84 +.56 +.03 Q32 2.74 3.12 2.91 2.98 +.17 -.14 Q33 3.07 3.51 3.07 3.16 .00 -.35 Q34 3.16 3.33 3.23 3.00 +0.7 -.33 Q35 3.16 3.02 3.14 3.12 -.02 .10 Q36 3.88 4.02 3.70 3.50 -.18 -.52
Factor III: Usefulness
As shown in Table 5.21 below the items about usefulness, the participants of the
Control Group ranked eight out of nine items with positive reflection. The Control
Group thought the writing class was very useful for them. From the researcher’s
observation, the Control Group did not have a lot of chances in writing practice before,
even though writing class was a required course for all of them. Their teacher did not
provide them with any writing training and practice. On the other hand, the
Experimental Group already had a series of process and paragraph writings in 2001,
and this may explain the different reflections regarding the statements of ‘Usefulness’.
Table 5.21 Summary of the Score Changes of the Statements Related to the Usefulness
Item Con-pre Exp-pre Con-post Exp-post Con. Change Exp. Change
Q1 4.26 4.40 4.53 4.26 +.27 -.14 Q2 4.28 4.21 4.51 4.07 +.23 -.14 Q3 3.95 3.79 3.77 3.70 -.18 -.09 Q4 4.12 4.09 4.19 3.95 +.07 -.14 Q8 2.93 2.56 3.07 2.79 +.14 +.23 Q11 2.67 2.88 2.91 2.93 +.24 +.05 Q12 2.51 2.60 2.58 2.84 +.07 +.24 Q23 4.05 4.02 4.19 3.93 +.14 -.09 Q24 3.26 3.30 3.35 3.28 +.09 -.02
Factor IV—Preference
Regarding the items of Preference about English writing, Table 5.22 presents the
evidence that learners in the Experimental Group gave more positive responses than
the Control Group in this category. The Experimental Group loved to use English to
write diaries (Q29), greeting cards (Q21), and E-mail (Q17). Moreover, even though it
was a time-consuming job to collect information or data for writing, the Experimental
Group still showed more passion than the Control Group (Q25). Additionally, Q22
indicates an interesting diversity between the Experimental and Control Group. The
Control made more efforts to practice English writing. In contrast, the fact that the
Experimental Group showed a little bit less enthusiasm than the Control Group proves
that necessity is the mother of hard work, because the writing proficiency test is a
requirement in the SAET.
Table 5.22 Summary of the Score Changes of the Statements Related to the Preference
Item Con-pre Exp-pre Con-post Exp-post Con. Change Exp. Change
Q9 2.65 2.88 2.56 2.74 -.09 -.14 Q17 2.47 2.63 2.42 2.65 -.05 +.02 Q21 3.93 3.65 3.98 3.93 +.05 +.28 Q22 3.35 3.47 3.40 3.35 +.05 -.12 Q25 3.12 3.09 2.79 3.07 -.33 -.02 Q28 3.21 3.28 3.16 3.26 -.05 -.02 Q29 3.12 2.98 3.05 3.12 -.07 +.14 Q30 2.58 2.51 2.51 2.58 -.07 +.07 Q31 2.63 2.53 2.42 2.67 -.21 +.14
5.2.1.3 Findings of the Analysis
From the foregoing analysis of the differences in the subjects’ attitude between the Experimental Group and the Control Group, we have the following findings to the changes:
The Experimental Group was more confident.
The Experimental Group was less anxious.
The Experimental Group favored English writing better.
The Control Group gave higher ranking in factor Usefulness due to their urgent need.
The Control Group was more afraid of sentence making than the Experimental Group.
The Control Group suffered a lot in the beginning of writing because their minds got blank when writing.
5.3 Statistical Analysis of Teaching Activities Questionnaire
The purpose of this section is to investigate the effectiveness of target design in
writing instruction and to explore the relationship between the writing curriculum and
response to the teaching activities questionnaire are analyzed to find out whether the writing units matched the needs of students and motivated their learning of writing.
Also, by interviewing randomly selected subjects of Class 302 and Class 308, the researcher was able to look deeper into what the subjects actually felt about the tasks, which is worthwhile for teachers who wish to make the writing class vivid and effective.
5.3.1 Process Writing Tasks for the Experimental Group
There were two parts in our writing curriculum for the Experimental Group—process writing and free writing. Process Paragraph Writing was divided into seven units. Table 5.23 shows students’ positive identity in each unit and Table 5.24 shows the comments for the effectiveness of each unit in the process paragraph writing (With respect to the total frequency of the items “Strong Like”, “Like”, and
“O.K.”, all the units were over 50%, thus, the subjects liked the units a lot.) Table 5.23 Preferences for Likes or Dislikes on Process Writing Tasks
Unit 1 Unit 2 Unit 3 Unit 4 Unit 5 Unit 6 Unit 7 VOTW
on PPW
(Class 302)
F % F % F % F % F % F % F %
Strongly
Like 0 1
(2.3%)
1 (2.3%)
3 (7.0%)
1
(2.3%) 0 2
(4.7%) Like 12
(27.9%)
10 (23.3%)
15 (34.9%)
20 (46.5%)
13 (30.2%)
9 (20.9%)
15 (34.9%) O.K. 25
(58.1%)
25 (58.1%)
18 (41.9%)
13 (30.2%)
19 (44.2%)
23 (53.5%)
16 (37.2%) Dislike 3
(7.0%)
3 (7.0%)
6 (14.0%)
4 (9.3%)
6 (14.0%)
6 (14.0%)
4 (9.3%) Strongly
Dislike 0 1
(2.3%) 0 0 1
(2.3%) 0 1
(2.3%) No
comments
3 (7%)
3 (7.0%)
3 (7.0%)
3 (7%)
3 (7%)
5 (11.6%)
5
(11.6%)
Table 5.24 Effectiveness of Writing Tasks in Process Writing
** BK—Blank VE—Very Effective NVE—Not Very Effective HL—Helpful to Learning HLL—Helpless to Learning CE—Creative NC—Not Creative EY—Easy DT—Difficult
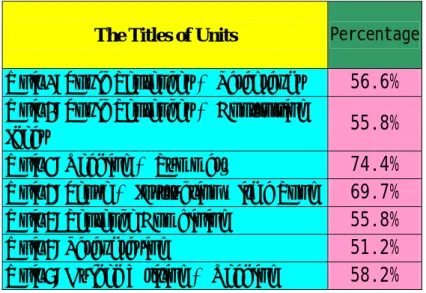
In Table 5.25, we put such comments as “Effective,” “Helpful to Learning,”
“Creativity Development,” and “Easy” together, and we see that each unit of the process paragraph writing shows more than 50 percent of agreement. This indicates clearly that the target design fits the needs of students. And Unit 3 and Unit 4 are the two most popular ones among the seven units in process paragraph writing.
Table 5.25 The Frequency of Preference for the Process Writing Tasks
From Table 5.23, the subjects’ preference of the units can be shown as follows: Unit 1 >Unit 4 >Unit 2 >Unit 7 & Unit 3 >Unit 5> Unit 6
Similarly, from Table 5.23, the subjects disfavor of the units can be shown as follows: Unit
VOTW on PPW
(Class 302)
BK VE NVE HL HLL CE NC EY DT
Unit 1 9.3% 7.0% 2.3% 44.2% 2.3% 4.7% 16.3% 7.0% 7.0%
Unit 2 9.3% 11.6% 7.0% 39.5% 2.3% 11.6% 7.0% 4.7% 7.0%
Unit 3 11.6% 11.6% 0% 48.8% 2.3% 9.3% 2.3% 4.7% 9.3%
Unit 4 11.6% 7.0% 4.7% 30.2% 4.7% 11.6% 7.0% 20.9% 2.3%
Unit 5 14.0% 9.3% 2.3% 34.9% 2.3% 2.3% 9.3% 9.3% 16.3%
Unit 6 16.3% 7.0% 7.0% 37.2% 7.0% 4.7% 2.3% 2.3% 16.3%
Unit 7 16.3% 14.0% 4.7% 30.2% 2.3% 7.0% 7.0% 7.0% 11.6%
The Titles of Units Percentage Unit 1: Topic Sentences & Paragraphs 56.6%
Unit 2: Topic Sentences & Controlling
Ideas 55.8%
Unit 3: Reading & Summary 74.4%
Unit 4: Tense & Instruction with a Song 69.7%
Unit 5: Sentence Combining 55.8%
Unit 6: Paraphrasing 51.2%
Unit 7: Guided Writing & Reading 58.2%
5 >Unit 6 & unit 3>Unit 7>Unit 2 & Unit 4 > Unit 1
Furthermore, the researcher further analyzed the subjects’ major reasons for their priority of likes in certain units based on the Questionnaire (listed on Appendix V).
Table 5.26 below presents the reasons why the subjects’ favored or disfavored a certain unit.
Table 5.26 the Characteristics of Process Writing
Characteristics Unit Very Practical Unit 7
Helpful to Learning Unit 3
Developing Creativity Unit 2 & Unit 4 Easy to Handle Unit 4
Difficult to Handle Unit 5 & Unit 6 Unable to Develop
Creativity Unit 1
Based on the results of interviews and analysis, we present a diagnostic description for the effectiveness of each unit as follows.
Unit One: Topic Sentences & Paragraphs
Learners felt it is hard for them to develop their creativity. Unit one already has a solid formula, a certain fixed principle and that is very helpful to students for their in-class practice mainly because the purpose of this unit was to develop important concepts of writing—specifically, the link between the topic sentence and the rest of paragraph.
Unit Two: Topic Sentences & Controlling Ideas
Similarly, the unit is a pedagogical rehearsal task about how to organize a
composition. It emphasizes the link between the topic sentence and controlling
ideas. With the help of pedagogical activation task, learners consider the unit
practical and helpful to learning. Also, students feel it enables them develop their
creativity due to its on-going activities, which is greatly different from the
traditional design of some textbooks.
Unit Three: Reading & Summary Writing Unit Seven: Guided Writing & Reading
Unit Three and Unit Seven have similar features. Because reading and writing are the two sides of a coin, reading supplies more input to learners and writing is an output to help students organize what they have read. By following the procedure of Reading Critical Thinking Comprehensive Reinterpretation, students learn how to write a summary in the style of informal expository writing. These units are much more difficult than the former two.
Unit Four: Tense Instruction with a Song
In the process of paragraph writing, the researcher found students were poor in the use of verbal tense. The students’ errors obviously showed that doctrine-like grammar teaching is ineffective. Without learning grammar in discourse, it is hard for students to generalize the rules. So, the researcher attempted to use English songs as a tool and model to teach correct tense usage in context.
Afterward, she asked students to do genre writing —poetry writing by describing an unforgettable person in their life. In the interview, students all agreed that this was their favorite unit, because it not only offered them a chance to challenge their creativity but also helped them to release their inner emotions and sensitivity fully. When the instructor asked the students the question
“Among all the compositions, which is your favorite?” six of the fifteen
randomly selected subjects responded that although it was not easy to find
rhyming words and that they had to think hard, they still felt the unit provide
them with a good practice. They could more flexibly express their feelings as
shown below.
Pearl: Among of works, which is your favorite?
Rachel: Unit Four of Process Writing.
Maggie: With This Love.
LaLa : But it is very difficult because of the rhyming!
Maggie: Writing a poem doesn’t need a very crucial coherence. Compared to writing a composition, poetry is much easier and flexible. Poetry can have a different theme for each stanza, but the development of a composition should follow the topic sentence.
Maggie & Rachel :It is fun to find the words for rhymes.
Sandra: Poems are easier for us to express the inner voice. Poetry could be very short and concise.
Unit Five: Sentence Combining
Most students are not familiar with the sentences with complex structure, such as adjective phrases or clauses. The purpose of this unit is to train students to express the same meanings by using different sentence structures. When they were asked, “Why is Paragraph Writing Unit Five your least favorable one?”
some subjects responded that because it was boring, impractical and did not prompt any new ideas for writing. For them, it was rare to write in this way in real life. On the other hand, some favored the unit. They thought that it was a valuable unit because it provided training in logical thinking and took them some time to contemplate how to turn the meaning into different constructions. A Chinese summary of the group interview is as follows:
Pearl: Why do you feel Unit Five of Process Writing is the most unfavorable?
Jeremy: Boring!
James : Nothing new but revision.。
Jeremy: If we could spill the sentences and recombine, we thought it would have much fun.
Leonie: That becomes very difficult.
Francis : It is not very useful!In real life, we do not write and say in that way.
Joanna : I don’t think so!It’s fun! I think it is very practical when learning grammatical structure.
Rachel: Sentence combining requires logical thinking.
Wina : Very constructive.
Unit Six: Paraphrasing
Senior high students in Taiwan are accustomed to following instructions from teachers. Therefore, paragraphing is difficult for them. The unit is a poetry paraphrasing practice. Before in-class writing practice, students had to understand fully the meaning of the poem. Then, they were asked to interpret it in a meaningful way. It takes logical thinking and reading comprehension interpretation. Nevertheless, because it is a poem, it is a good genre to provoke learning of the affective domain.
5.3.2 Free Writing Tasks for the Experimental Group and the Control Group
Both the Experimental Group and the Control Group have the same writing tasks in their free writing curriculum. Table 5.27 on next page shows students’ positive feedback to each unit and Table 5.28 on next page shows the comments on the effectiveness of each unit in the free writing.
Table 5.27 Summary of the Viewpoints on Free Writing Tasks of the Two Groups Unit 1 Unit 2 Unit 3 Unit 4 Unit 5 Unit 6 Class 302
Syllabus
F % F % F % F % F % F %
Strongly
Like 0 3
(7.0%) 2
(4.7%) 2
(4.7%) 1
(2.3%) 0
Like 14
(32.6%) 17
(39.5%) 10
(23.3%) 17
(39.5%) 10
(23.3%) 14 (32.6%)
O.K. 19
(44.2%) 13
(30.2%) 23
(53.5%) 17
(39.5%) 22
(51.2%) 16 (37.2%)
Dislike 7
(16.3%) 5
(11.6%) 5
(11.6%) 4
(9.3%) 6
(14.0%) 2 (4.7%) Strongly
Dislike 0 2
(4.7%) 0 0 0 0
Blank 3
(7.0%) 3
(7.0%) 3
(7.0%) 3
(7.0%) 4
(9.3%) 11 (25.6%)
Unit 7 Unit 8 Unit 9 Unit 10 Unit 11 Unit 12 Class 302
Syllabus
F % F % F % F % F % F %
Strongly
Like 0 1
(2.3%) 0 0 0 1
(2.3%)
Like 13
(30.2%) 7
(16.3%) 10
(23.3%) 11
(25.6%) 13
(30.2%) 10 (23.3%)
O.K. 21
(48.6%) 22
(51.2%) 23
(53.5%) 24
(55.8%) 21
(48.8%) 24 (55.8%)
Dislike 2
(4.7%) 8
(18.6%) 5
(11.6%) 4
(9.3%) 5
(11.6%) 4 (9.3%)
Strongly
Dislike 0 2
(4.7%) 1
(2.3%) 1
(2.3%) 1
(2.3%) 1 (2.3%)
Comments No 7
(16.3%) 3
(7.0%) 4
(9.3%) 3
(7.0%) 3
(7.0%) 3
(7.0%)
Table 5.28 Summary of the Comments on the Viewpoints on Writing Tasks in Free Writing Curriculum (Frequency Table)
There are twelve units in free writing. Both the Experimental and the Control Group have the same design. The results are as follow:
First, in Table 5.29 below, we put the frequency of the comments such as
“Effective,” “Helpful to Learning,” “Creativity Development,” and “Easy”
Class 302 Syllabu s
BK VP NVP HFL HLL CE ICE EY DT
Unit 1 16.3% 9.3% 4.7% 32.6% 4.7% 4.7% 2.3% 11.6% 14.0%
Unit 2 9.3% 9.3% 2.3% 27.9% 9.3% 16.3% 7.0% 9.3% 9.3%
Unit 3 9.3% 9.3% 2.3% 30.2% 0% 11.6% 9.3% 14.0% 14.0%
Unit 4 11.6% 9.3% 4.7% 9.3% 2.3% 37.2% 2.3% 7.0% 16.3%
Unit 5 14.0% 2.3% 2.3% 39.5% 4.7% 14.0% 14.0% 4.7% 4.7%
Unit 6 27.9% 11.6% 2.3% 27.9% 4.7% 14.0% 0% 9.3% 2.3%
Unit 7 16.3% 4.7% 2.3% 39.5% 7.0% 9.3% 7.0% 9.3% 4.7%
Unit 8 11.6% 18.6% 4.7% 32.6% 9.3% 9.3% 11.6% 7.0% 0%
Unit 9 9.3% 9.3% 2.3% 48.8% 0% 4.7% 11.6% 2.3% 11.6%
Unit 10 11.6% 16.3% 7.0% 41.9% 2.3% 2.3% 9.3% 4.7% 4.7%
Unit 11 11.6% 18.6% 2.3% 25.6% 4.7% 9.3% 11.6% 7.0% 9.3%
Unit 12 14.0% 4.7% 4.7% 27.9% 4.7% 16.3% 4.7% 14.0% 9.3%
Class 308 Syllabus
BK VP NVP EL NEL CE ICE EY DT
Unit 1 0 14.0% 0 30.2% 2.3% 18.6% 11.6% 7.0% 16.3%
Unit 2 0 11.6% 4.7% 44.2% 2.3% 9.3% 4.7% 7.0% 16.3%
Unit 3 0 14.0% 2.3% 23.3% 2.3% 9.3% 7.0% 18.6% 23.3%
Unit 4 2.3% 11.6% 14.0% 11.6% 7.0% 30.2% 4.7% 7.0% 11.6%
Unit 5 0 4.7% 4.7% 34.9% 0 25.6% 7.0% 11.6% 11.6%
Unit 6 2.3% 4.7% 9.3% 32.6% 2.3% 9.3% 7.0% 16.3% 16.3%
Unit 7 0 20.9% 14.0% 34.9% 4.7% 2.3% 4.7% 11.6% 7.0%
Unit 8 0 11.6% 2.3% 27.9% 9.3% 20.9% 9.3% 9.3% 9.3%
Unit 9 0 25.6% 4.7% 32.6% 7.0% 9.3% 2.3% 4.7% 14.0%
Unit 10 0 18.6% 7.0% 34.9% 4.7% 9.3% 2.3% 11.6% 11.6%
Unit 11 0 23.3% 2.3% 32.6% 4.7% 16.3% 4.7% 9.3% 7.0%
Unit 12 0 7.0% 9.3% 37.2% 7.0% 9.3% 0 11.6% 18.6%
together, and we see that each unit of the free writing shows more than 50 percent of agreement. This indicates clearly that the target design fits the needs of students. Unit 11 and Unit 5 are the two most popular ones among the seven units in free writing. Thus, the subjects liked the units a lot. (With respect to the total frequency of the items “Strong Like”, “Like”, and “O.K.”, all the units were over 50%)
Second, analyzing students’ preference for each teaching program by joining together the total statistics of the items “Strongly Like”, “Like”, “No Opinion”, we find their preference priorities as follows:
The Experimental Group (Class 302):
Unit 4 > Unit 3 & 10 > Unit 7 & 11 & 12> Unit 1 & 2 & 5 & 9> Unit 8 The Control Group (Class 308):
Unit 11 > Unit 10 > Unit 7 > Unit 6 & Unit 4 > Unit 2 > Unit 9 > Unit 12 >
Unit 1 > Unit 8 > Unit 3 > Unit 5
Third, analyzing students’ preference for each teaching program by putting the total statistics of the items “Dislike”, “Strong Dislike”, we find their dispreference priorities as follows:
The Experimental Group (Class 302): unit 8 > unit 1 & unit 2 > unit 5 & 11
> unit 3 & 10 & 12 > unit 4 & 7
The Control Group (Class 308): unit 3 > unit 1 > unit 8 >unit 12 > unit 2 > unit
11 > unit 4 > unit 5 > unit 7 > unit 10 > unit 9
Table 5.29 The Frequency of Preference in Free Writing Tasks
Unit The Exp. (302) The Con. (308)
Unit 1 : Interview & Description 58.2% 55.8%
Unit 2 : Letter to Myself 53.8% 72.1%
Unit 3 : Letter Reflection 65.7% 53.6%
Unit 4 : Complete Story 62.8% 60.2%
Unit 5 : Story Reflection (302) The Song I Love (308) 62.5% 75.8%
Unit 6 : Getting Ideas 58.2% 51.2%
Unit 7 : Getting Ideas 60.5% 69.7%
Unit 8 : Revision 65.5% 69.7%
Unit 9 : Developing Cause & Effect Paragraph 64.6% 72.2%
Unit 10 : Review & Implementation 58.9% 74.4%
Unit 11 : Comparison & Connectors 60.5% 81.5%
Unit 12 : Portfolios & Process Writing 61.9% 61.1%
Furthermore, the researcher further analyzed the subjects’ reasons for favoring a certain unit, Table 5.30 below presents the reasons why the subjects’ favored or disfavored a certain unit.
Table 5.30 the Characteristics of Each Unit on Free Writing
Characteristics The Experimental Group (Class 302) The Control Group (Class 308)
Very Practical in Use Unit 8 & 11 Unit 11
Impractical in Use
Helpful to Learning Unit 9 Unit 2
Helpless to Learning
Developing Creativity Easily Unit 4 Unit 4
Developing Creativity Hard Unit 5 Unit 5
Easy to Workout Unit 12 Unit 6
Hard to workout Unit 4 Unit 3
Based on the results of interviews and analysis of teaching techniques, we present a
diagnostic description for the effectiveness of each unit as follows.
Unit One: Interview & Description
In this unit, the teacher makes use of cooperative learning, having students to interview their classmates and collecting the information they needed in their writing. The researcher thought the topic of the in-class writing My Classmate, easy for learners to develop their ideas. However, the Control Group did not think so. They found the questions they asked each other were quite boring and too general. In contrast, the Experimental Group did not think so. From the observation of the researcher and the writings of the learners, we notice that our senior high students are not active in self-discovery type of learning and are poor at collecting and organizing data. Therefore, most of their first writings were full of senseless descriptions, and the content was usually very narrow, focusing on their routine schooldays and their opinions about the coming SAET. The Chinese summary of semi-structures group interview is listed as follows:
Wina : The Interview task on the writing—My Classmates became very artificial; our questions are like drills.
Sandra: We did not offer appropriate questions to get more information. In the same group, it was hard to find someone interesting for interviewing... Therefore, we were stuck.
Unit Two: Letter to Myself:
Letter to Myself is a practice for students to think deeply about what they are.
The topic is very personal and related to everyday life. Learners are supposed to
be able to describe their dreams and their ideals easily. To our surprise, students
did not show their potentials well. In general, the Experimental Group was
better than the Control Group in spite of the fact that the Experimental did not
strongly show their dislikes. The Chinese summary of semi-structured group
interview is listed below:
The Experimental Group (Class 302)
Pearl: Do you like to write a letter?
Joanna : It depends!
Leonnie: Letter to Myself? Even I do not understand myself; I do not know how to write it.
For a senior student, there is nothing new only studying... All we write is just how to pass the entrance examination of college.
Francis: Writing to someone is easier than writing a letter to oneself. I do not what I can write to me.
Lela: It is hard for me to write others because even I do not understand myself. Therefore, it is not easy to write others.
The Control Group (Class 308)
Pearl: Which unit is the easiest one for you?
Eric: Letter to Myself.
Angela: The Song with Love
Eric: I can go back to look at myself more completely and I think it is easier for me to write smoothly.
Furthermore, I can make the best use of words I learned if only I got some ideas.。
Angela: Because it is not an easy thing to make comments on others.
Unit Three & Unit Ten: Reflections on Letter to Myself, Review &
Implementation:
The teaching goal is to offer students opportunities to receive feedback about
their writings. Students did the job pretty well. Writing is not only a process of
learning language skills but also a process of mental thinking, so it is very crucial
for students to provide feedback to one another. Students remarked that they
could review the words and sentence structures, which they have learned
especially the parts that are still not quite clear to them. They can go back to
consult a dictionary or the teacher. Additionally, the worksheets helped them
keep the records of their writings and they are able to trace back to their weak
points repeatedly and effectively. The Chinese summary of the interview with
semi-structured questions is listed below:
Sandra (302): When writing compositions, we can go back to check the words and phrases unfamiliar to us. Then we have a firm idea about the usage of them more and more.
Wina (302): We can also keep record of our learning on the worksheets and comprehend more about our weaknesses.
Angela (308): Writing skills takes long term. Truly speaking, although we have spent time in writing, I still feel the improvement is less than I expected. However, I found writing is another interesting course. My experience tells it is not much like my pre-acknowledgement that learning English is for a pencil test; we have to involve ourselves in it. Now, after I see a movie, I will love to write my feedback. I talk to myself.
Unit Four: Story Completion
Storytelling is another meat cognitive learning, which combines listening, reading, and writing. Through hearing and seeing and the stretching imagination, we attempt to build up their multi-intelligence. Students loved this activity very much. They all mentioned that they could create a plot and atmosphere personally; they could write a narrative, a descriptive, or even an expository article. The Chinese summary of the group interview is listed below:
The Experimental Group (Class 302)
Francis: Unit 4—Story Completion on Free Writing Training is very flexible, most of us could build up our own story.
Jeremy: It is something like writing a fiction. The author can set his plot. There are no critical rules. Got a lot of things to write, to say, and to share.
James: Story Completion offers a stage to show our idea and thinking. It can be very colloquial and it can be narrative or regulative. It tests our ability in different aspects.
The Control Group (Class 308)
Pearl: Which writing style pours more creativity to your writing?
Eric: Story Strips.
Julie: The same.
Pearl: Why?
Eric: Wild imagination.
Julie: Because it only gave some part of the lines and then we could deliver ours.
Julie: In the very beginning, it only provided a prologue. We had to give our lines the following parts. It unnecessarily would be a happy ending story, in fact, it could be a tragedy. We were the master to give the story live.
Mark: If there were a topic, we could not create more. Story making is quite different.
Angela: Like a detective story, we never know the result until we reach the ending. For example, when taking the entrance test at Chung Sun University, I was asked to have writing without a topic but a personal reflection about how a writer influenced his writer. The writing did not test our grammar, sentence structure directly but test our imagination and creative thinking.
Unit Nine & Unit Ten: Comparison & Contrast and Developing Cause &
Effect Paragraphs
Based on our teaching experience, the expository article is rather difficult for most senior high school EFL learners. The data of pretest writing proficiency test showed that—among eighty-six subjects, only 2 students passed the standard of LTTC. Because of this evidence, the researcher decided to postpone the expository writing practice until the last two units. Coincidently, there was an expository article in our textbook for the English reading class and we took the chance to make use of it in our writing class with some other activities embedded. Neither the Control Group nor the Experimental Group showed their disfavor of the genre. They said when writing it, they had to follow the current public opinions. Besides, the genre already has a fixed style, unlike narration or description in which they can express their feeling and emotion more freely.
Nevertheless, from the instructor’s viewpoints, learners must learn different
genres in the process of writing practice so that they can acquire enough writing
skills. Furthermore, it is important to learn to explain one’s idea logically and
persuasively. Actually, it is not very easy at all. When asked why they liked
narrative and descriptive writing so much and why they did not perform well in last simulated tests. Students said that it was hard to write a good composition in the test, which integrates reading and writing at the same time. After finishing the reading part, their brain had got stuck. They preferred to have reading and writing tested separately. The Chinese summary of the group interview is as follows:
The Experimental Group (Class 302)
Pearl: What troubles you most when writing?
Wine: My brain got stuck even I tried hard to write something.
Maggie: The topic was not proper.
Leonie: It’s better have something related to life. Fragmentary genres were not so related to life experience. The topics around computers and internet were boring; they should be something else connected with real life more.
Maggie: Like our Chinese simulated test, the topic for writing is “How to deal with nuclear waste?”
Jeremy: I do not think so. If those were not related life, what were other else? I think maybe we can write something about food, clothing and so on.
Maggie: I prefer to write narrative articles than expository ones.
Leonie: Expository are too cliché.
Wina: I do not think expository can really show our points of view. On the otherhand, we have to balance our ideas to favor the graders.
Jeremy: Actually, expository is much easier to write.
James: Narrative ones seems freer to write and without a lot of restrictions.
Wine: We make lines freely. The plot of the writing can be very sad, or very happy. We can do whatever we want.
Pearl: But why couldn’t you express your thoughts undividedly in the previous simulated English writing test—“If you had the magic power like Harry Potter, what would you want to do?”
Leonie: It took time to get some inspiration.
The Control Group (Class 308)
Pearl: Why do you feel expository is much easier than narration.?
Ruther: It is much harder to show our ideas on narration in Chinese.
Ark: Reasoning our ideas is simpler and easier to catch points.
Mark: Each word in narration takes time to weigh. Even we has some ideas, we find it was hard to speak them out.
Wina: Expository is only for showing one’s points of view.
David: Different people have different inner voice. I think narration can really show one’s feeling. Expository sometimes seems too artificial; contrarily, narration seems more natural. When writing expository, we have to cope with current line; however, we got more space in writing narration.
Angela: Narration is easier for writers to create imagination. When we are able to show our feelings in writings, we make great improvement in English writing. Our writing skills become better.
Sharon: In narrations, we have more imagination, and we can have our own style. As to the expression, I think simple words and phrases are better than the difficult words. Too many difficult words make readers confused. Narrations offer writers more room to say something about themselves, which makes each one unique.
Eric: Because it is easier to write one’s feeling, it is easier for the beginners. Expository emphasizes on reasons for persuading others but narration focuses on personal feedback.
Ken: When writing narrations, we will not be limited in certain field. When we are free to give out thoughts, we are able to show real feeling on it.
I-Chan: There is a situation for us to follow in writing narratives. If we can deliver our thoughts and feeling to the point, the graders must give it a great score.
Julie: Saying something for a fact or for a situation, we do not have to hide ourselves behind a mask. Currently, our society is too practical, sometimes even very crucial. So, narrations offer a good chance to spread the inner voice of us.
Iris: I love writing narratives. I think I can use simple words to tell others what I feel and how I think.