Institute of Biotechnology
College of Bioresources and Agriculture
National Taiwan University Master Thesis
N
The role of gut microbiota and indole metabolite in cats with chronic kidney disease
Wei-Lun Wei
Advisors: Je-Ruei Liu Ph.D., Mong-Hsun Tsai Ph.D.
107 A 7
July, 2018
中⽂摘要
腸道微⽣物於宿主健康中扮演重要⾓⾊,其參與宿主之物質代謝、養分吸收,
並與疾病的發⽣有關聯。近年來許多研究發現腸道菌與慢性腎臟病 (chronic
kidney disease, CKD) 之間存在著關聯性。慢性腎臟病期間由於腎臟功能受損,
無法有效率地將尿毒素藉由尿液排出體外,導致毒素累積於體內,在腎臟病患者
及動物模式⽣物研究中發現尿毒素的累積會導致腸道微⽣物菌相的變化並可能
會破壞腸道屏蔽。硫酸吲哚酚 (indoxyl sulfate, IS) 是⼀種尿毒素,其來源是透過
在腸道的微⽣物將來⾃飲⾷中的⾊氨酸發酵產⽣吲哚 (indole),吲哚經由腸道吸
收進⼊⾎液循環並在肝臟被代謝成硫酸吲哚酚。慢性腎臟病在貓是⼀個常⾒的疾
病,更是造成貓死亡的疾病之⼀,因此本研究⽬的為探討貓慢性腎臟病與腸道菌
相及吲哚代謝產物之關聯性。慢性腎臟病貓與健康貓之⾎液及糞便於同⼀天收集,
並以⾼效液相層析法分析糞便中吲哚及⾎液中硫酸吲哚酚之濃度;⼀部分糞便經
純化 DNA 後,以次世代定序 (next generation sequencing, NGS) ⽐較慢性腎臟病
貓及健康貓的腸道菌群。另外於體外實驗以不同濃度之吲哚處理 Caco-2 細胞株,
探討吲哚對於腸道屏蔽之影響。結果顯⽰糞便中的吲哚及⾎液中硫酸吲哚酚濃度
在慢性腎臟貓組別較⾼,且兩者之間存在顯著的相關性。腸道菌相結果顯⽰,在
腎臟病貓中的菌相多樣性有顯著性下降,且 Enterobacteriaceae 相較於在健康貓
之菌量有顯著性較⾼;⽽Faecalibacterium prausnitzii、Sutterella spp.,及 Prevotella
copri 則在腎臟病貓中有顯著性降低。體外實驗結果顯⽰⾼濃度的吲哚可以增加
腸細胞屏蔽的完整性。綜合上述結果,慢性腎臟病的確會使貓腸道菌相產⽣變化,
且伴隨著吲哚及其代謝物濃度的提升,但吲哚並不會造成腸道屏蔽的破壞。
關鍵字:慢性腎臟病、腸道菌、次世代定序、貓、吲哚、硫酸吲哚酚
Abstract
Chronic kidney disease (CKD) is one of the most influential causes of morbidity and mortality in cats. A growing number of studies have highlighted the relationship between the kidney and gastrointestinal microbiota in patients with CKD. During CKD, a large number of uremic toxins derived from increased bacterial fermentation of proteins are accumulated in the body. Retention of uremic toxins has been associated with damage of the intestinal epithelial barrier and alteration of gut microbiota in CKD rats and human patients. Indoxyl sulfate, one of the uremic toxins, is produced by the breakdown of indole, which is from the fermentation of tryptophan by microbiomes in the intestine. No studies of the gut microbiota and its metabolite in cats with CKD have been investigated. Therefore, the objectives of this study were to compare the composition of fecal microbiota in CKD and non-CKD cats, and to determine the concentration of indole as well as indoxyl sulfate. The effect of indole on the integrity of intestinal barrier was also studied. Fecal samples were collected from CKD and corresponding control cats, and each sample was analyzed by Illumina sequencing of the 16S rRNA gene. Total bacterial diversity in feces was significantly reduced in CKD cats compared to the control group. Based on the unweighted UniFrac distance metric, the composition of fecal microbiota in cats with CKD and the control group was significantly different. Heat map, linear discriminate analysis, and 2-fold-change analysis identified an enrichment of Enterobacteriaceae in CKD groups whereas Faecalibacterium prausnitzii, Sutterella spp., and Prevotella copri were more prevalent in the control group. On the other hand, concentrations of indole and indoxyl sulfate were higher in cats with CKD compared to the controls. In vitro, the expression of tight
junction proteins and the integrity of intestinal epithelium was increased by treating higher concentration of indole. In conclusion, the composition of fecal microbiota was altered by the presence of CKD in cats, followed by the increased concentration of indole and IS. While increased concentration of indole may not cause the damage of intestinal epithelium. However, further studies are needed to provide more conclusive evidence.
Keywords: Chronic kidney disease, gut microbiota, next generation sequencing, cats, indole, indoxyl sulfate
Contents
... I
Abstract ... III Contents ... VI List of Figures ... VIII List of Tables ... X
Introduction ... 1
Material and Methods ... 10
2.1 Sample collection ... 10
2.2 Detection of IS in the plasma ... 12
2.2.1 Sample preparation ... 12
2.2.2 HPLC analysis for IS ... 12
2.3 Detection of indole in the feces ... 13
2.3.1 Sample preparation ... 13
2.3.2 HPLC analysis for indole ... 13
2.4 Metagenomic analysis ... 17
2.4.1 Primary treatment of fecal samples and DNA extraction ... 17
2.4.2 Next generation sequencing (NGS) and bioinformatics analysis ... 17
2.4.3 Quantitative real-time PCR (qPCR) ... 18
2.5 In vitro test the integrity of Caco-2 cells by indole treatment ... 21
2.5.1 Cell culture ... 21
2.5.2 Indole preparation ... 21
2.5.3 MTT assay ... 21
2.5.4 Transepithelial resistance (TER) measurements ... 22
2.5.5 Western blot ... 23
2.6 Statistical analysis ... 23
Results ... 24
3.1 Clinical characteristics ... 24
3.2 Concentrations of indole and IS in CKD and healthy groups ... 25
3.3 Diversity and gut microbial composition in cats with CKD ... 28
3.4 Difference of operational taxonomic units between CKD and healthy groups . 35 3.5 In vitro test the integrity of Caco-2 cells by indole treatment ... 45
Discussion ... 50
Conclusions ... 54
References ... 55
List of Figures
Figure 1-1. Scheme of this study. ... 9 Figure 2-1. HPLC chromatogram of (A) indoxyl sulfate and (B) indole. ... 15 Figure 2-2. HPLC standard curve of (A) indoxyl sulfate and (B) indole. ... 16 Figure 3-1. Concentration of (A) indoxyl sulfate and (B) indole in cats with chronic
kidney disease and controls. ... 27 Figure 3-2. Alpha diversity metrics of (A) PD whole tree and (B) Shannon diversity
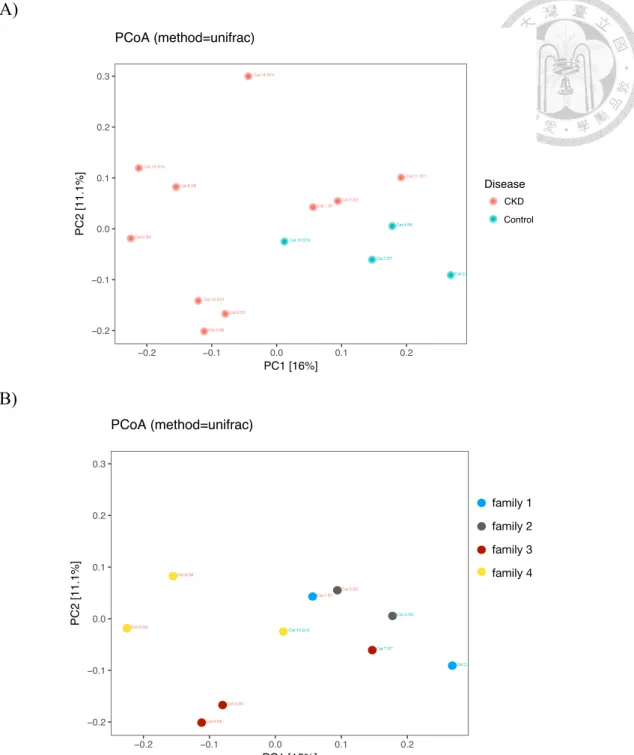
from cats with chronic kidney disease and controls. ... 31 Figure 3-3. Principle coordinate analysis of gut microbiota from (A) cats with chronic
kidney disease and controls, and (B) four different living conditions. ... 32 Figure 3-4. Relative abundance (A) and average relative abundance (B) of the gut
microbiota at the phylum level. ... 33 Figure 3-5. Relative abundance (A) and average relative abundance (B) of the gut
microbiota at the order level. ... 34 Figure 3-6. Heat map of the relative abundance of bacteria from operational
taxonomic unit (OTU) in CKD and control individuals. ... 38 Figure 3-7. Indicator microbial groups within two groups with logarithmic linear
discriminant analysis score higher than 2 determined by effect size (LefSe) at the (A) genus level and (B) species level. ... 40 Figure 3-8. Venn diagram of shared and unique OTUs in the gut microbiota of cats. 41 Figure 3-9. Absolute quantification of bacterial groups by qPCR expressed as log10
bacteria per gram of stool. ... 43
Figure 3-10. Relative abundance of indole-producing bacteria. ... 44 Figure 3-11. Effect of indole on the cell viability of Caco-2 cells assayed by MTT. .. 47 Figure 3-12. Effect of indole on the expression of tight junction proteins (A) occludin
and (B) ZO-1 in Caco-2 cells. ... 48 Figure 3-13. Effect of indole on the transepithelial resistance of Caco-2 cells. ... 49
List of Tables
Table 2-1. Classification of chronic kidney disease in cats based on blood creatinine concentration. ... 11 Table 2-2 Primers used for quantitative real-time PCR (qPCR) in this study. ... 20 Table 3-1. Clinical parameters among controls and CKD cats. ... 26 Table 3-2. The correlation between indole metabolite and clinical parameters in cats.
... 26 Table 3-3. The relative richness of gut microbiota in CKD and control cats in different classification level. ... 30 Table 3-4. Bacterial groups that were either enriched or depleted in CKD cats
compared to the controls. ... 39 This table was expanded upon the information given from the heat map. ... 39 Table 3-5. Bacterial groups shared among three and four family domains in CKD cats
compared to the controls. ... 42 This table was expanded upon the information given from the Venn diagram. ... 42 Table 4-1. Summary of bacterial groups that were enriched or depleted in CKD cats
analyzed by three methods. ... 53
CHAPTER I Introduction
The kidney is comprised of thousands of nephrons, which are responsible for filtering waste and removing excess fluid from the blood to form urine. A healthy kidney performs the control of fluid osmolality, acid-base status, electrolyte balance, blood pressure and the secretion of hormones, such as erythropoietin, calcitriol and renin. However, damage of the nephron including the glomerulus, tubule, interstitial tissue or vasculature can result in irreversible impairment and loss of renal function, which leads to disturbed renal metabolism, impaired glomerular filtration, and tubular secretion/reabsorption problems. Chronic kidney disease (CKD) is characterized by reduced renal function and/or evidence of kidney damage for more than approximately 3 months (Bartges, 2012).
CKD is a common disease in cats, especially elder cats (Bartges, 2012). Compared to other animals, cats are more susceptible to CKD (White et al., 2011). The estimated incidence of CKD in the general population of cats is from 0.5% to 1.5% and more than 30% of cats over 15 years old are diagnosed with CKD (Polzin, 2011). However, the exact reason for elder cats susceptibility to kidney disease is still unclear and the cause of feline CKD in general is usually hard to determine. The common cause of CKD in cats includes tubulointerstitial nephritis, renal lymphosarcoma, renal amyloidosis, chronic pyelonephritis, chronic glomerulonephritis, feline infectious peritonitis (FIP), and neoplasia. While amyloidosis and polycystic kidney disease are more known to be common in certain breeds (DiBartola et al., 1987). Because the kidney cannot function
as normal during CKD, hundreds of compounds that are normally excreted or metabolized by the kidney are retained in the body, resulting in increased blood concentration. These compounds have been proven to have adverse biological activity and are recognized as uremic toxins (Duranton et al., 2012). According to the European Toxin Work Group, uremic toxins can be categorized into three groups based on their removal pattern during dialysis: (1) small water-soluble molecules (<500 Dalton [Da]) that can pass through any dialysis filter, (2) large water-soluble molecules (³500 Da) that may be partly removed by a dialysis filter depending on membrane characteristics, (3) protein-bound molecules that are hardly removed by the dialysis because of their augmented size (Vanholder et al., 2003). Two protein-bound molecules, indoxyl sulfate (IS) and p-cresyl sulfate (PCS), have been well studied due to their inability to be removed by dialysis and their association with CKD progression as well as cardiovascular disease (Lin et al., 2012). In particular, the level of IS has been proven to be correlated with CKD severity in cats (Cheng et al., 2015).
IS is a small solute with a molecular weight of 231 Da. Normally about 90% of IS are bound to plasma albumin with a rapid equilibrium between the bound, unbound and free state. The unbound solute is taken up by organic anion transporters (OAT1 and OAT3) in tubule cells located on the basolateral membrane of the proximal and distal tubules (Deguchi et al., 2002; Nigam et al., 2015; Wikoff et al., 2011). The free state of IS is filtrated by the glomerulus. However, when tubular dysfunction and the glomerular filtration rate (GFR) decreases, IS cannot be filtrated efficiently.
Additionally, because dialysis does not replicate tubular excretion, the plasma level of IS is higher in patient with dialysis compared to normal (Sirich et al., 2013). The
accumulation of IS has been associated with various adverse outcomes, such as kidney disease progression, cardiovascular disease, bone disease and others. Administration of IS increased the expression of genes related to glomerular sclerosis, including transforming growth factor (TGF)-b1, tissue inhibitor of metalloproteinaises (TIMP-1) and pro-a1(I) (Miyazaki et al., 1997). Other investigations also reported that IS impaired the proliferation and repair of umbilical vein endothelial cells, causing vascular injury (Dou et al., 2004). A recent study showed that IS reduced the production of new bone by suppressing the expression of genes related to bone formation and bone resorption, such as bone morphogenetic protein 2 (BMP2) and osterix (Watanabe et al., 2017).
Interestingly, IS is generated by the bacterial fermentation of tryptophan in the gastrointestinal (GI) tract. Some of gut microbiota, such as Escherichia coli, produces tryptophanase, an enzyme that converts dietary tryptophan into indole, which is then absorbed by the gut. Once it reaches the liver via the hepatic portal system, it is metabolized into indoxyl sulfate (Cummings, 1983). To date, at least 85 indole- producing species of bacteria, including both Gram-negative and Gram-positive bacteria, have been identified (Lee and Lee, 2010). In uremic rats, administration of indole has been associated with the progression of glomerular sclerosis through the production of IS (Niwa et al., 1994). In fact, gut microbiota produces not only indole, but also phenols, amines and others as the precursors of uremic toxins. As these toxic products generated by the gut microbiota may contribute to progression of CKD (Lin et al., 2011; Wu et al., 2010), more and more researchers have tried to study the link
between CKD and gut microbiota (Al Khodor and Shatat, 2017; Ramezani and Raj, 2013; Vitetta et al., 2013).
Gut microbiota is a group of microbes which colonize along the GI tract and include bacteria, fungi, protozoans, viruses, and archaea. This microbial community has a tremendous impact on the host’s health and well-being, resulting in potential positive and negative effects (Suchodolski, 2011). It forms a natural defense barrier to against colonization of GI tract by pathogens (Stecher and Hardt, 2011), produce substances that act as a sources of energy for epithelial cells, synthesize vitamins (B and K), modulate immune function of the host, influence metabolism of compounds/drugs and nutrient absorption. Alteration of gut microbiota may result from many types of internal and external factors, including host genetics, host life-style, diet (Lubbs et al., 2009; Swanson et al., 2011), antibiotic use (Suchodolski et al., 2009), and others. A disturbance in normal composition and structure of gut microbiota is known as dysbiosis and it may cause an increase in pathogen colonizes, which will trigger inflammation by releasing endotoxins. Dysbiosis is associated with the pathogenesis of intestinal and extra-intestinal disorders. Intestinal disorders include inflammatory bowel disease (Kostic et al., 2014; Nishida et al., 2018), irritable bowel syndrome (Collins et al., 2009), and celiac disease (Cenit et al., 2015). On the other hand, extra-intestinal diseases include obesity (Bäckhed et al., 2007), diabetes (Brugman et al., 2006), cancer (Francescone et al., 2014; Rogers et al., 2014), cardiovascular disease (Tang et al., 2017), and kidney disease (Ramezani and Raj, 2014).
Although most current studies focus on the GI microbiota in human populations, an increasing number of investigations have studied intestinal microbes in other animals, especially dogs and cats (Suchodolski, 2011). Molecular phylogenetic studies, typically based on 16S rRNA gene analysis, have improved our knowledge about the composition, dynamics, and functionality of the intestinal ecosystem in cats (Desai et al., 2009; Ritchie et al., 2008). The large intestine of cats was found to have higher bacterial diversity and richness (number of species) when compared with the stomach and all regions of the small intestine (Ritchie et al., 2008). The bacteria in the large intestine, especially colonic bacteria, play an important role in preventing colonization by pathogenic bacteria and in the fermentation of dietary fiber, resulting in the production of short chain fatty acids (SCFA). These include butyrate, acetate, and propionate, which are considered to be important sources of energy for colonic cells (Wong et al., 2006). The fecal microbiota of healthy cats has been analyzed by a metagenomic approach and the results suggest that bacteria was the dominant group (97.8%), with Bacteroidetes being the most abundant (~ 68%), followed by Firmicutes (~13%) and Proteobacteria (~6%), while eukaryotes, archaea, and viruses representing the remaining 3% (Tun et al., 2012). Although the gut microbiota in healthy cats have been studied, the gut microbiota in cats with CKD have not yet been investigated.
In recent year, a growing number of observations have suggested that the gut microbiota is quantitatively and qualitatively altered in CKD human patients and animal models. Firstly, the absolute quantification of total bacteria by real-time polymerase chain reaction (RT-PCR) is significantly reduced in end stage renal disease (ESRD) patients (Jiang et al., 2017) and overgrowth of anaerobic bacteria is detected
in hemodialysis patients (Hida et al., 1996). Secondly, qualitative change of the gut microbiota is demonstrated by isolating bacterial DNA in the feces of ESRD and healthy subjects. Phylogenic microarray analysis shows significant differences in the abundance of 190 bacterial operational taxonomic units (OTUs) between patients with ESRD and healthy controls (Vaziri et al., 2013). Microbial genomic analysis suggests dominance of bacteria families possessing urease, p-cresol- and indole-forming enzymes in ESRD individuals (Wong et al., 2014). High-throughput sequencing analysis reports Bacteroides are more prevalent in ESRD patients. However, Roseburia, Feacalibacterium, Clostridium, Coprococcus, and Prevotella are reduced in the ESRD group (Jiang et al., 2017). To further confirm the effect of uremia on gut microbial composition, the fecal microbiomes are studied in nephrotomized rats. Compared with sham-operated control rats, CKD rats show significant differences in the abundance of 175 OTUs, most notably with decreases in the Lactobacillaceae and Prevotellaceae families, suggesting that uremia profoundly alters the composition of gut microbiome (Vaziri et al., 2013).
Not only the composition of gut microbiota is changed during CKD, but also the disintegration of intestinal epithelium is found in patients and animals with CKD.
Normally, there is a specialized complex between neighboring intestinal epithelial cells to form selective barriers that control the transport of molecules and maintain tissue compartments with different compositions. This complex consists of tight junctions (zonula occludens and ZO), adherens junctions, gap junctions and desmosomes (Fanning et al., 1999). The tight junctions represent the major barrier regulating the paracellular pathway (Madara and Dharmsathaphorn, 1985). However, the immune-
histology and Western blot analyses demonstrated that protein expression of tight junction complexes (occludin, ZO-1, and claudin-1) was significantly reduced in CKD rats compared with control groups (Vaziri et al., 2011). Nevertheless, there is no significant difference in the messenger RNA expression of occludin, ZO-1, and claudin-1in CKD rats, which suggests that post-transcriptional/post-translational modification may be the cause of the observed depletion of the tight junction proteins (Vaziri et al., 2012). The same groups of tight junction proteins were also examined by incubating human enterocytes with uremic plasma from CKD patients and the results showed significant reductions in the expression of occludin, ZO-1, and claudin-1.
Therefore, the possible mechanism of intestinal damage in CKD may be caused by the compounds present in uremic plasma (Vaziri et al., 2012). The disintegration of the intestinal barrier allows the permeation of luminal antigens, endotoxins and bacteria metabolites into the systemic circulation, which contributes to inflammation, uremic toxicity, progression of CKD, and associated cardiovascular disease (Bischoff et al., 2014; El Asmar et al., 2002; Nalle and Turner, 2015; Szeto et al., 2008).
In this study, we aim to investigate the role of gut microbiota and its metabolite in cats with CKD. Since IS is one of the uremic toxins that is originated from the fermentation of gut microbiota, and indole is the precursor of IS in the intestine, we tested the relationship of CKD progression with IS and indole by using high performance liquid chromatography (HPLC) in the feces and the plasma to detect the concentrations of two compounds. The stool and plasma from cats with CKD and the corresponding control cats were collected at the same day. To compare the gut microbial composition between cats with CKD and the controls, some parts of fecal
samples were used for extracting bacterial DNA to run metagenomic analysis by next- generation sequencing while other parts were used for quantifying the specific bacteria amount by quantitative real-time PCR (qPCR). In vitro, we tested the effect of indole on the integrity of the intestinal epithelium by using Caco-2 cell lines, which were colonic epitheliums and have been widely used as a model of the intestinal barrier (Sambuy et al., 2005). After indole treatment, MTT assay was first used to determine the indole cytotoxicity and epithelial integrity on Caco-2 cells as well as its expression of tight junction proteins.
Figure 1-1. Scheme of this study. The aim of this study is to investigate the role of the gut microbiota and its metabolite in cats with chronic kidney disease. Both indoxyl sulfate and indole were detected by HPLC in the plasma and the feces, respectively.
Bacteria DNA was extracted from the feces and used for metagenomics analysis and quantitative real-time PCR (qPCR). In vitro, the integrity of Caco-2 intestinal epithelium cells was tested by indole treatment.
The role of gut microbiota and indole metabolite in cats with CKD
CKD and healthy Cats
MTT assay
TER measurement
Western blot
Plasma Feces
Bacteria DNA
Metagenomic analysis Indole
Indoxyl
sulfate qPCR
HPLC HPLC
in vitro test of Caco 2 cells by indole treatment
CHAPTER II Material and Methods
2.1 Sample collection
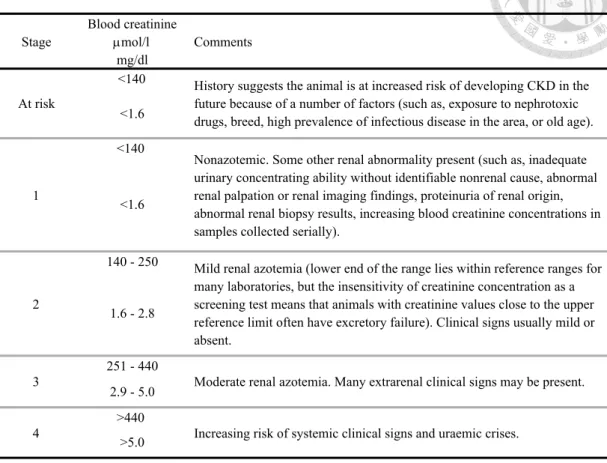
All cats in this study were diagnosed by the veterinaries in Sheng-Li cat hospital in Tainan and all owners were signed the informed consent. Cats with history of renal disease for more than 3 months and blood urea nitrogen (BUN) and creatinine levels higher than references levels were classified as CKD group. More specifically, according to International Renal Interest Society (IRIS), CKD cats were classified into four groups based on creatinine concentration in the blood (Table M-1). Cats lacking clinical signs and with no history of renal disease that were presented for healthy examination or that had both BUN and creatinine levels within reference intervals were considered as controls. Additionally, to reduce the effect of environmental factor to the gut microbiota, CKD and corresponding control cats were from the same family. Fecal samples and blood from 7 CKD cats and 4 control cats were collected at the same day.
Fresh fecal samples were collected in sterile containers and stored at -80oC. Blood samples were collected and centrifuged at 3000 x g at 4oC for 10 min. The supernatants (plasma) were separated in 1.5 mL tubes and immediately frozen at -80oC.
Table 2-1. Classification of chronic kidney disease in cats based on blood creatinine concentration.
Source : http://www.iris-kidney.com/guidelines/staging.html
Blood creatinine µmol/l
mg/dl
<140
<1.6
<140
<1.6
140 - 250
1.6 - 2.8
251 - 440 2.9 - 5.0
>440
>5.0
Nonazotemic. Some other renal abnormality present (such as, inadequate urinary concentrating ability without identifiable nonrenal cause, abnormal renal palpation or renal imaging findings, proteinuria of renal origin, abnormal renal biopsy results, increasing blood creatinine concentrations in samples collected serially).
1
History suggests the animal is at increased risk of developing CKD in the future because of a number of factors (such as, exposure to nephrotoxic drugs, breed, high prevalence of infectious disease in the area, or old age).
At risk
Comments Stage
Increasing risk of systemic clinical signs and uraemic crises.
4
Moderate renal azotemia. Many extrarenal clinical signs may be present.
3
Mild renal azotemia (lower end of the range lies within reference ranges for many laboratories, but the insensitivity of creatinine concentration as a screening test means that animals with creatinine values close to the upper reference limit often have excretory failure). Clinical signs usually mild or absent.
2
2.2 Detection of IS in the plasma 2.2.1 Sample preparation
All blood samples were collected in heparinized tubes and centrifuged at 2000 x g for 5 min. Separated supernatant (plasma) was stored at -80oC. One hundred µL of acetonitrile was added to 25 µL of plasma to extract IS, and the mixture was vortexed for 30 s and then centrifuged at 2000 x g for 5 min. The supernatant was filtrated through a 0.22 µm filter and applied to HPLC analysis.
2.2.2 HPLC analysis for IS
IS (potassium salt) was purchased from Sigma-Aldrich (St. Louis, MO, USA).
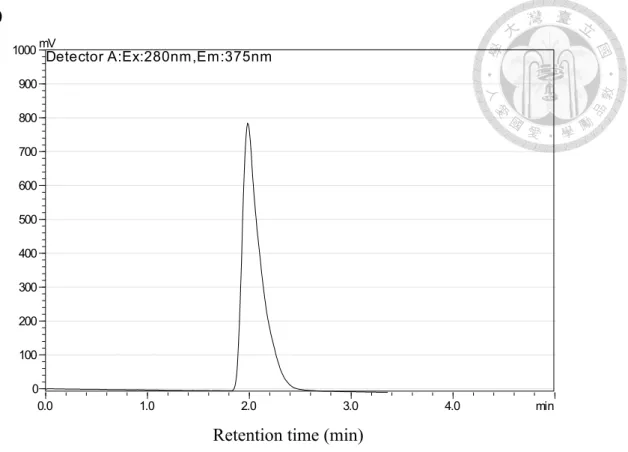
HPLC analysis was performed with a Prominence Preparative HPLC system (Shimadzu, Kyoto, Japan) using a HPLC pump (LC-20AT) with a fluorescence detector (RF-10AXL) and a HPLC column (C-18, 4.6 x 250 mm). Detection of IS concentration was determined as followed according to the published method (Al Za'abi et al., 2012), with minor modification. Samples of 10 µL each were injected into the column by auto- sampler at room temperature. The mobile phase consisted of sodium acetate buffer (pH 4.5) and acetonitrile (10:90, v/v). The sodium acetate buffer consisted of 0.1 M of sodium acetate and acetic acid. The flow rate was 1.3 mL/min, and the excitation and emission wavelength were set at 280 and 375 nm, respectively. The retention time of IS was 1.9 ± 0.2 min. The sensitivity of the method was defined as the concentration of standard at which the peak height exceeded the base-line noise by at 3-fold. Because plasma is a complicated mixture and there is no suitable internal standard in pure form that can be regarded as a blank, sample extraction with a satisfactory recovery and clean chromatography baseline was used to determine IS concentration in this study.
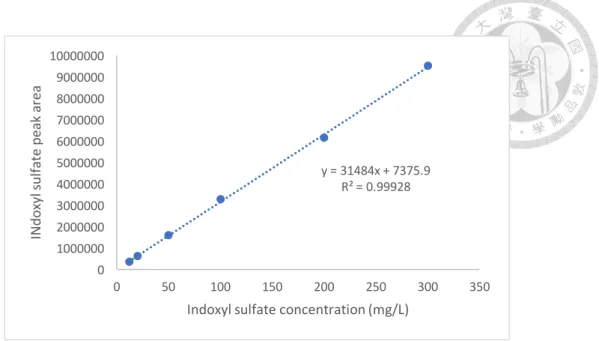
The calibration curve was constructed by adding various concentrations of standard IS solutions into normal plasma collected from a healthy cat (5:1, v/v) to produce spiked plasma concentrations of 5, 10, 50, 100, 200, and 300 ng/mL. The background IS concentration without plasma sample was also detected. A linear relationship between the known IS concentration and peak area, with the regression analysis R2 ³ 0.99, were determined to calibrate IS concentration in the unknown sample.
2.3 Detection of indole in the feces 2.3.1 Sample preparation
Fresh stools were collected into a sterile fecal collection tube and each fecal sample was weighted. A 10-fold (v/w) volume of methanol was added and the feces were homogenized. Four hundred µL of the suspension were transferred to a new tube, and 400 µL of methanol was added. The mixture was then incubated at -20oC for 2 h, and centrifuge at 20,000 x g for 15 min at 4oC. Subsequently, 200 µL of the supernatant was collected and 200 µL of distilled water was added. The solution was centrifuged at 20,000 x g for 15 min at 4oC and the supernatant was applied to HPLC analysis.
2.3.2 HPLC analysis for indole
Indole was purchased from Sigma-Aldrich (St. Louis, MO, USA). Detection of indole concentration was determined by a published method (Shimada et al., 2013), with minor modification. Samples of 10 µL each were injected in to the column by auto-sampler at room temperature. Two solvents were used in this study. Solvent A was 0.1% (v/v) formic acid, and solvent B was acetonitrile. The initial composition of the
binary solvent was B 50% from 0 to 5.0 min. Solvent B was increased from 50 to 100%
over 5 min. The composition of solvent remained for 5.0 min at B 100%, with the flow rate set at 1.0 mL min-1. The excitation and emission wavelengths were 280 and 335 nm respectively. The data at one run acquired for 10 min. Since a suitable internal standard in pure form is not readily available for determining indole concentration in the feces, an internal standard was not used in this study.
The calibration curve was constructed by adding various concentrations of standard indole solutions into fecal sample collected from a healthy cat in order to produce spiked plasma concentrations of 1, 2, 5, 15, 20 ng/mL. The background indole concentration without fecal sample was also detected. A linear relationship between the known indole concentration and peak area, with the regression analysis R2 ³ 0.99, were determined to calibrate indole concentration in the unknown sample.
(A)
Retention time (min)
(B)
Retention time (min)
Figure 2-1. HPLC chromatogram of (A) indoxyl sulfate and (B) indole.
0.0 1.0 2.0 3.0 4.0 min
0 100 200 300 400 500 600 700 800 900 1000mV
Detector A:Ex:280nm,Em:375nm
0.0 2.5 5.0 7.5 10.0 min
-300 -200 -100 0 100 200 300 400 500 600
mVDetector A:Ex:280nm,Em:335nm
(A)
(B)
Figure 2-2. HPLC standard curve of (A) indoxyl sulfate and (B) indole.
y = 713276x + 1E+06 R² = 0.99962 0
2000000 4000000 6000000 8000000 10000000 12000000 14000000
0 2 4 6 8 10 12 14 16
Indole peak area
Indole concentration (mg/L) y = 31484x + 7375.9
R² = 0.99928
0 1000000 2000000 3000000 4000000 5000000 6000000 7000000 8000000 9000000 10000000
0 50 100 150 200 250 300 350
INdoxyl sulfate peak area
Indoxyl sulfate concentration (mg/L)
2.4 Metagenomic analysis
2.4.1 Primary treatment of fecal samples and DNA extraction
Fresh stools were collected into a sterile fecal collection tube and the tubes were stored at -80oC until use for the pretreatment for DNA extraction. Primary treatment of feces for total DNA extraction was done as followed. Each fecal sample was weighted, suspended in 2 volumes of sterile PBS to make 2-fold (v/w) dilution, and the mixture was subjected to vigorous vortex to make a uniform fecal homogenate. The DNA of isolated bacteria was extracted using QIAampÒ fast DNA stool mini kit (QIAGEN) following the manufacturer’s protocol for pathogen detection. Extracted DNA were quantified using NanoDropÒ ND-1000 spectrophotometer (Thermo Fisher Scientific, Inc., Waltham, MA, USA).
2.4.2 Next generation sequencing (NGS) and bioinformatics analysis
Isolated fecal DNA was used as a template for amplification of 16S rRNA V3-4 region using the universal primer (Forward: 5’-TCGTCGGCAGCGTCAGATGTGTA TAAGAGACAGCCTACGGGNGGCWGCAG-3’; Reverse: 5’-GTCTCGTGGGCTC
GGAGATGTGTATAAGAGACAGGACTACHVGGGTATCTAATCC-3’). The
reaction mixture (25 µL) was composed of 12.5 µL KAPA HIFI HotStart Ready Mix, 2.5 µL template DNA, 5 µL 1 µM amplicon forward primer, and 5 µL 1 µM amplicon reverse primer. The PCR cycle conditions were an initial denaturation at 95oC for 3 min, 25 cycles of 95oC for 30 seconds, 55oC for 30 seconds, and 72oC for 30 seconds, and final extension at 72oC for 5 min. PCR products were sequenced using Illumina MiSeq system.
Sequencing results were clustered by Illumina paired barcoded-sequencing (end) process for preliminary analysis and the rest of the sequences were screened by UCHIME and removed the suspected chimeric sequence. All reads were sorted into different samples according to their barcodes. Then the effective reads were used for clustering to extract the operational taxonomical units (OUT) according to the Greengenes 16S rRNA taxonomy database. Principle coordinates analysis (PcoA) based on UniFrac distance was performed with software package (QIIME v.1.9.1).
The linear discriminant analysis (LDA) with effective size measurements (LEfSe) were used to identify differentially abundant features that can be used as potential metagenomics biomarkers (Segata et al., 2011). The analysis carried out through LEfSe was performed by the galaxy server (Goecks et al., 2010). The alpha parameter significance threshold for the Kruskal-Wallis test among classes in LEfSe was set at 0.05, and the logarithmic LDA score was set at 2.0. Estimated biomarkers were represented according to the effect size.
The Venn diagram with bacterial amounts that were twice enriched or depleted in CKD groups was perform by RStudio (Northern Ave, Boston, MA, USA). However, there were some bacterial groups that were completely depleted in CKD or control group, which could not compare the amounts of bacteria to each other. For those bacterial groups which had no amounts of bacteria were picked when the amount of that specific bacteria was greater than 1% in total amounts of bacteria.
2.4.3 Quantitative real-time PCR (qPCR)
The bacteria chosen for qPCR are well-known bacteria in the gut. Escherichia coli (E. coli) belongs to Proteobacteria. Bifidobacterium spp. belongs to Actinobacteria.
Lactobacillus spp. belongs to Firmicutes. Based on the sequencing data, Faecalibacterium prausnitzii was chosen because of its decrease in CKD cats. qPCR primers are listed in Table 2-1. qPCR assays were performed in a 384-well optical plate on a LightCyclerÒ 480 Real-Time PCR system. The reaction mixtures were consisted of 5 µL CyberGreenÒ, 2 µL isolated fecal DNA, 1 µL 1 µM forward primer, 1 µL 1 µM reverse primer, and 1 µL double-distilled H2O. The copy number of target DNA was determined by serially diluting standards (101 to 107 copies of corresponding bacterial DNA) running in the same plate. Bacterial quantity was expressed as log10
bacteria per gram of stool.
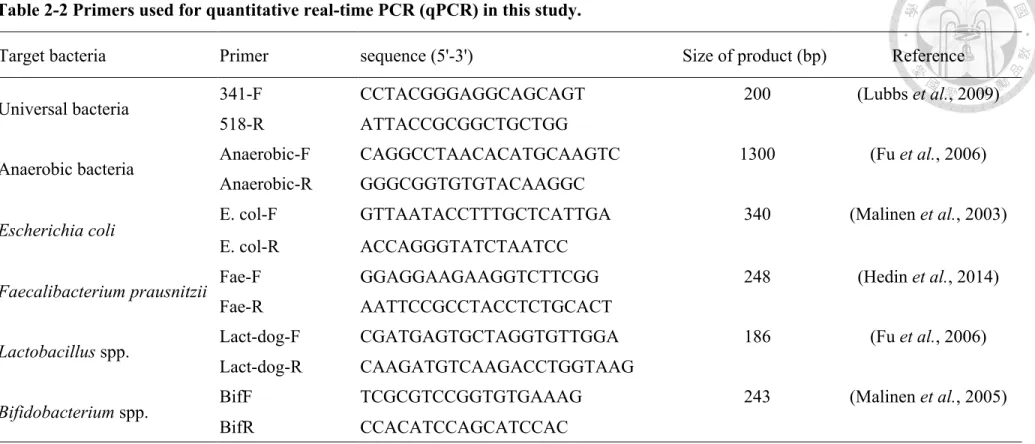
Table 2-2 Primers used for quantitative real-time PCR (qPCR) in this study.
Target bacteria Primer sequence (5'-3') Size of product (bp) Reference
Universal bacteria 341-F CCTACGGGAGGCAGCAGT 200 (Lubbs et al., 2009)
518-R ATTACCGCGGCTGCTGG
Anaerobic bacteria Anaerobic-F CAGGCCTAACACATGCAAGTC 1300 (Fu et al., 2006)
Anaerobic-R GGGCGGTGTGTACAAGGC
Escherichia coli E. col-F GTTAATACCTTTGCTCATTGA 340 (Malinen et al., 2003)
E. col-R ACCAGGGTATCTAATCC
Faecalibacterium prausnitzii Fae-F GGAGGAAGAAGGTCTTCGG 248 (Hedin et al., 2014)
Fae-R AATTCCGCCTACCTCTGCACT
Lactobacillus spp. Lact-dog-F CGATGAGTGCTAGGTGTTGGA 186 (Fu et al., 2006)
Lact-dog-R CAAGATGTCAAGACCTGGTAAG
Bifidobacterium spp. BifF TCGCGTCCGGTGTGAAAG 243 (Malinen et al., 2005)
BifR CCACATCCAGCATCCAC
2.5 In vitro test the integrity of Caco-2 cells by indole treatment 2.5.1 Cell culture
The Caco-2 cell, an epithelial cell line derived from human colon adenocarcinoma, was obtained from the American Type Culture Collection (ATCC) and grown in a humidified incubator at 37oC with 5% CO2 and 95% air. Cells were maintained in Dulbecco’s Modified Eagle medium (DMEM, GibcoÒ Life technology, NY, USA) at pH7.4 supplemented with 10% fetal bovine serum (FBS, GibcoÒ Life technology, NY, USA), 1% penicillin-streptomycin (GibcoÒ Life technology, NY, USA), and 0.01 mg/mL of human transferrin (Sigma-Aldrich, Inc., St. Louis, MO, USA). Cells between passage 20 and 40 were used for all experiments. Upon 70%-80% confluence, cells were passaged by 0.05% trypsin and 0.53 mmol/L EDTA, counted using hemacytometer and were seeding at 8 x 10⁵ cells/10 mm-dish with 10 mL of medium.
2.5.2 Indole preparation
Indole (Sigma-Aldrich, Inc., St. Louis, MO, USA) was dissolved in N, N- dimethylformamide (DMF) (J. T. Baker, Phillipsburg, NJ, USA) to prepare 10M stock, and different concentrations of indole for cell treatment were prepared by serial dilution.
Then, 0.1% of indole was mixed with growth medium to incubate with cells.
2.5.3 MTT assay
The 3(- 4,5-cimethylthiazol-2-yl)-2,5-diphenyltetrazolium bromide MTT) assay has been widely used to assess cell viability. The enzymatic reduction of MTT to MTT- formazan (dark blue product) is catalyzed by mitochondrial dehydrogenases in living but not in dead cells (Mosmann, 1983). Caco-2 cells used for MTT assay were seeded into 24-well at 150,000 cells/well and pre-incubated for 24 h before indole treatment.
The cells were then treated with indole at various concentrations (10-2 to 10-9 M) for 24 h, while the cells for positive control were treated with 10% sosdium dodecyl sulfate (SDS) containing 0.1 N HCl. After treatment, indole solutions were removed and washed with DPBS. Finally, the cells were incubated with 100 µL MTT containing medium for 2 h. Then the medium was removed, and the formazan crystal formed in living cells was dissolved in 100 µL dimethyl sulfoxide (DMSO, Amresco, Llc., Solon, OH, USA) per well. The relative viability (%) was calculated based on absorbance at 570 nm using a microplate reader. Viability of non-treated control was defined as 100%
(Chae et al., 2005).
Relative cell viability = !"(!"#$%,'()*+, . !"#$%,/+(01 2344
#$%,670897+ . !"#$%,/+(01)
2.5.4 Transepithelial resistance (TER) measurements
Caco-2 cells were first cultured in 10-mm dish. Upon confluence, cells were seeded into 12-well with Transwell inserts (Corning Incorporated, USA) at 150,000 cells/well. To form a polarized monolayer, cells were maintained for 21 days in complete medium, with 500 µL medium at apical side and 1.2 mL medium at basolateral side. The medium was changed every other day and TER was measured regularly using a Millicell ERS-2 Meter (EMD Millipore Inc., Billerica, Mass., USA).
When a TER exceeding 1,000 mW/cm2 was reached, the monolayers were incubated for 24 h in DMEM medium containing 0.1% indole dissolved in DMF with final concentration from 10-3 to 10-9 M. At the conclusion of the 24 h incubation period, the TER was measured and cells were processed for Western blot analysis.
2.5.5 Western blot
The cells were lysed with RIPA buffer containing protease inhibitor (Roche Diagnostics GmbH, Sandhofer Str., Mannheim, Germany). Protein concentration in the cell lysate was determined by Bradford protein assay using bovine serum albumin as standard. Thirty µg of total protein from each sample were fractionated on 8-10%
sodium dodecyl sulfate polyacrylamide gel electrophoresis (SDS-PAGE) gels at 120V for 2 h, and the separated proteins were transferred to a nitrocellulose membrane. After blocking with 5% skim milk in phosphate buffered saline containing 0.1% Tween-20 (PBST) for 1 h at room temperature, the membrane was incubated overnight at 4oC with primary antibodies against ZO-1 at 1:500 dilution, occludin at 1:1000 dilution, and beta-actin antibody at 1:2000 dilution, respectively. The secondary antibody (HRP- linked anti-rabbit IgG) was used at 1:5000 dilution. The membrane was visualized by ECL detection kit. Densitometric analysis of specific bands were performed using the Image J software (National Institute of Health, Bethesda, MD, USA).
2.6 Statistical analysis
Statistical analyses were performed with the statistical software (GraphPad Prism 6). Differences between CKD and controls were analyzed by Mann-Whitney U test due to the non-normal distribution of data. Differences among more than three groups were analyzed by the one-way analysis of variance (ANOVA) test followed by Turkey’s test and Dunnett’s test. Values are expressed as mean±standard deviation. Pearson correlation was calculated to estimate the linear correlations between indole and indoxyl sulfate. The significance level was set at p < 0.05.
CHAPTER III Results
3.1 Clinical characteristics
Eleven cats were recruited in this study. Cats with blood urea nitrogen (BUN) and creatinine within reference intervals were classified as control groups. While CKD groups were classified into stage 2 to 4 based on the creatinine concentrations in the blood. There were two cats with IRIS stage 2, four cats with IRIS stage 3, and 1 cat with IRIS stage 4. The clinical characteristics were summarized in Table 3-1. BUN and creatinine were significantly higher in CKD groups compared to the control group whereas age and body weight had no significant difference between the two groups.
3.2 Concentrations of indole and IS in CKD and control groups In order to investigate the relationship of CKD progression and indole metabolism, concentrations of IS and indole in the plasma and in the feces of cats were detected by HPLC, respectively. As shown in Table 3-1, IS concentration was significantly higher in CKD cats compared to control groups, while indole concentration was higher in CKD groups but there was no significant increase. Additionally, the relationship among IS, indole, and clinical parameters were tested by Spearman correlation. The results indicated that there was a significant correlation between indole and IS, but the correlation between other variables were not statistically significant (Table 3-2).
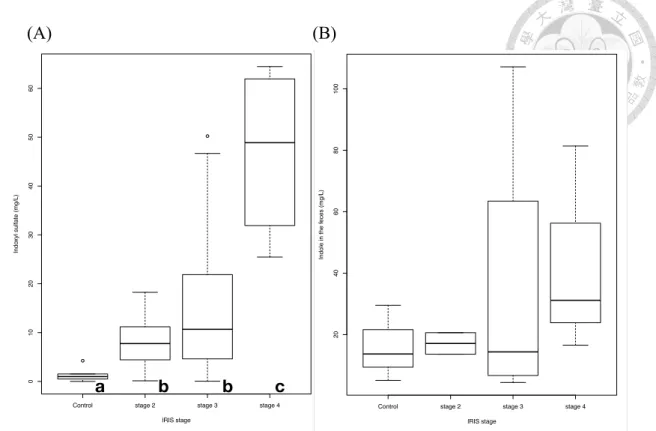
According to the IRIS guideline, cats with CKD could be classified into four stages based on their blood creatinine concentration. The concentration of IS had been reported to be gradually increased as the severity of kidney disease increased (Cheng et al., 2015), and indole is the precursor of IS in the intestine, therefore, we arranged the concentration of IS and indole in cats based on IRIS classification. These results were shown in Figure 3-1. Cats in the IRIS stage 4 had the significantly higher concentrations of IS compared to other groups. However, there was no significant differences in IS between IRIS stage 3 and IRIS stage 2. The IRIS stage 2 had a significantly higher concentration of IS when compared to control groups. On the other hand, the concentration of indole in the feces was gradually higher as CKD stage increased, but there was no statistical difference between each group.
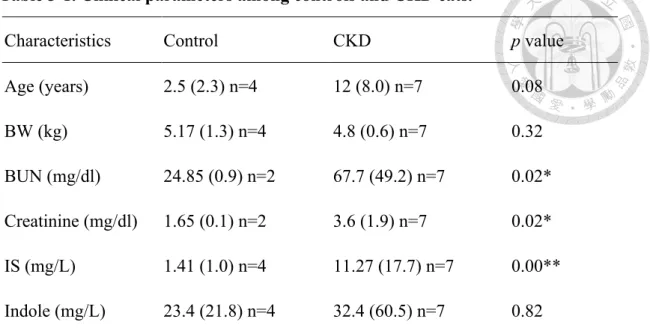
Table 3-1. Clinical parameters among controls and CKD cats.
Characteristics Control CKD p value
Age (years) 2.5 (2.3) n=4 12 (8.0) n=7 0.08 BW (kg) 5.17 (1.3) n=4 4.8 (0.6) n=7 0.32 BUN (mg/dl) 24.85 (0.9) n=2 67.7 (49.2) n=7 0.02*
Creatinine (mg/dl) 1.65 (0.1) n=2 3.6 (1.9) n=7 0.02*
IS (mg/L) 1.41 (1.0) n=4 11.27 (17.7) n=7 0.00**
Indole (mg/L) 23.4 (21.8) n=4 32.4 (60.5) n=7 0.82 Variables were tested by the Mann-Whitney U test and were represented as the
median (interquartile range). *p < 0.05; **p < 0.01. Abbreviations: BW, body weight;
BUN, Blood Urea Nitrogen; IS, indoxyl sulfate.
Table 3-2. The correlation between indole metabolite and clinical parameters in cats.
Variable Spearman correlation p value
Indole: IS 0.622 0.035*
Indole: Creatinine 0.203 0.528
Indole: BUN -0.175 0.588
IS: Creatinine 0.524 0.084
IS: BUN 0.252 0.43
*p < 0.05. Abbreviations: IS, indoxyl sulfate; BUN, Blood Urea Nitrogen.
(A) (B)
Figure 3-1. Concentration of (A) indoxyl sulfate and (B) indole in cats with chronic kidney disease and controls. Solid horizontal bars represent medium values and boxes represent the 25th-75th percentiles. Whiskers represent the 5th-95th percentiles, and open dots represent the number below Q1-1.5 IQR or above Q3 + 1.5 IQR. Statistical analysis was performed using Mann-Whitney U test to examine the differences between each group. The different letters (a, b, c) indicate that a significant difference between groups (p < 0.05).
Control stage 2 stage 3 stage 4
0102030405060
IRIS stage
Indoxyl sulfate (mg/L)
a b b c
Control stage 2 stage 3 stage 4
20406080100
IRIS stage
Indole in the feces (mg/L)
Control stage 2 stage 3 stage 4
0102030405060
IRIS stage
Indoxyl sulfate (mg/L)
a b b c
Control stage 2 stage 3 stage 4
20406080100
IRIS stage
Indole in the feces (mg/L)
3.3 Diversity and gut microbial composition in cats with CKD
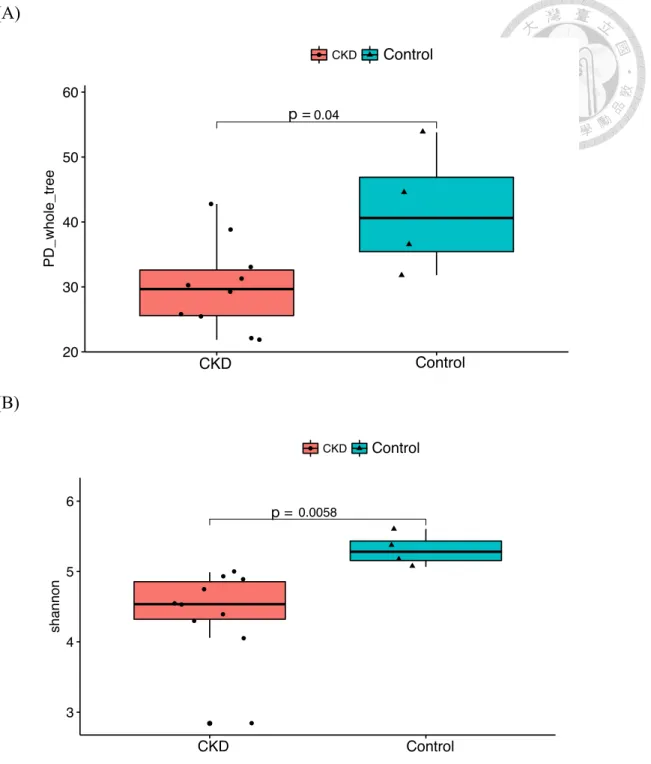
Many studies have found that the gut microbiota was altered in the human patients and animal models with CKD (Jiang et al., 2017; Yoshifuji et al., 2016). As a result, we performed the metagenomics analysis to investigate the gut microbiota in cats with CKD. The relative richness of gut microbiota at different classification level was shown in Table 3-3. Compared to the controls, the relative richness of gut microbiota in cats with CKD was decreased. More specifically, because the diversity is concerned with both richness and evenness, the diversity of gut microbiota was assessed by PD (phylogenetic diversity) whole tree and Shannon diversity. The results showed that the diversity of gut microbiota in cats with CKD was significantly decreased compared to the controls (Fig. 3-2).
Principle coordinate analysis (PCoA) based on the UniFrac metric revealed a separation trend of control and CKD groups. However, cats from the same living conditions did not show a cluster in the PCoA analysis, which suggested that the gut microbial composition in control cats and cats with CKD was different and the effect of disease to the gut microbiota was more dominant than the effect of environmental factors (Fig. 3-3).
According to the sequencing data, the gut microbial composition of each sample at different taxonomic levels was generated. In general, Bacteroides was the most abundant phylum in both control and CKD cats, representing 54.20% and 43.20% of total valid reads respectively. Firmicutes was the second most abundant phylum in both groups, with average relative abundance of 36.5% in the control group and 29.20% in CKD cats. However, the average abundance of Proteobacteria was higher in CKD
groups compared to the controls, accounting for 21.7% of total fecal microbiota in CKD groups and 5.20% in the controls. The other dominant phyla were Fusobacteria, Actinobacteria, Cyanobacteria and others (Fig. 3-4). Based on the average relative abundance, 8 oders were dominant (> 1%) at the order level. Bacteroides, Firmicutes and Fusobacteria were more abundant in the control group, while Proteobacteria and Actinobacteria were enriched in CKD individuals (Fig. 3-5).
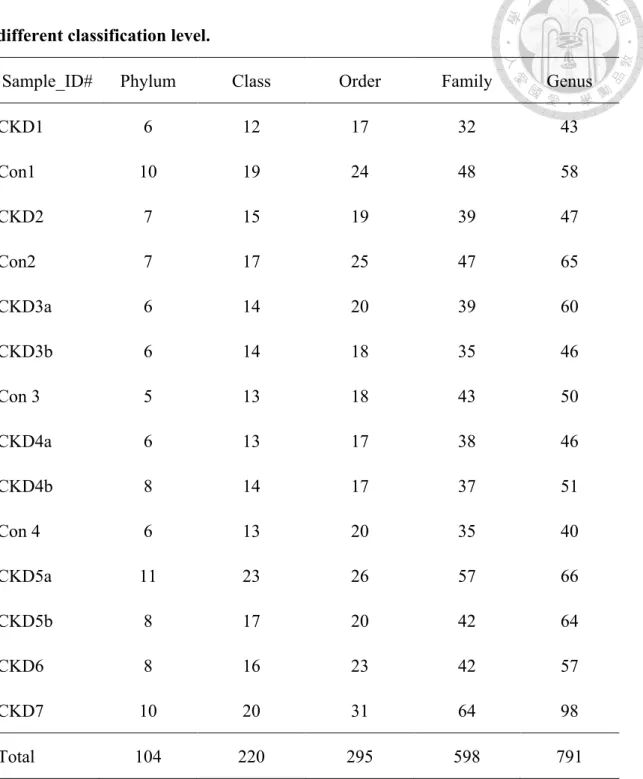
Table 3-3. The relative richness of gut microbiota in CKD and control cats in different classification level.
Sample_ID# Phylum Class Order Family Genus
CKD1 6 12 17 32 43
Con1 10 19 24 48 58
CKD2 7 15 19 39 47
Con2 7 17 25 47 65
CKD3a 6 14 20 39 60
CKD3b 6 14 18 35 46
Con 3 5 13 18 43 50
CKD4a 6 13 17 38 46
CKD4b 8 14 17 37 51
Con 4 6 13 20 35 40
CKD5a 11 23 26 57 66
CKD5b 8 17 20 42 64
CKD6 8 16 23 42 57
CKD7 10 20 31 64 98
Total 104 220 295 598 791
Each control and the corresponding CKD cat were from the same family. The different letter (a, b) indicated samples collected from the same cat at different times.
Abbreviation: Con, control.
(A)
(B)
Figure 3-2. Alpha diversity metrics of (A) PD whole tree and (B) Shannon diversity from cats with chronic kidney disease and controls. Statistical analysis was performed using Mann-Whitney U test (p <0.05). Abbreviation: PD, phylogenetic diversity.
●
●●
●
●
●
●
●
●
●
0.04 Kruskal−Wallis, p = 0.034
20 30 40 50 60
CKD WT
Disease
PD_whole_tree
Disease ● CKD WT
Alpha Diveristy(PD_whole_tree)
Statistic comparisons by kruskal.test & wilcox.test
●
●
●
●
●
●
●
●
●
●
●
0.0058 Kruskal−Wallis, p = 0.0047
3 4 5 6
CKD WT
Disease
shannon
Disease ● CKD WT
Alpha Diveristy(shannon)
Statistic comparisons by kruskal.test & wilcox.test
p = p =
Control
CKD CKD Control
Control Control
●
●●
●
●
●
●
●
●
●
0.04 Kruskal−Wallis, p = 0.034
20 30 40 50 60
CKD WT
Disease
PD_whole_tree
Disease ● CKD WT
Alpha Diveristy(PD_whole_tree)
Statistic comparisons by kruskal.test & wilcox.test
●
●
●
●
●
●
●
●
●
●
●
0.0058 Kruskal−Wallis, p = 0.0047
3 4 5 6
CKD WT
Disease
shannon
Disease ● CKD WT
Alpha Diveristy(shannon)
Statistic comparisons by kruskal.test & wilcox.test
p = p =
Control
CKD CKD Control
Control Control
(A)
(B)
Figure 3-3. Principle coordinate analysis of gut microbiota from (A) cats with chronic kidney disease and controls, and (B) four different living conditions. The first two axes of the PCoA are represented with principle coordinate axis 1 (16%
variability) and principle coordinate axis 2 (11.1% variability). Abbreviation: PCoA, Principle coordinate analysis.
●
●
●
●
●
●
●
●
●
●
●
●
●
●
Cat.4.S4
Cat.5.S5
Cat.1.S1
Cat.2.S2 Cat.3.S3
Cat.8.S8 Cat.13.S13
Cat.11.S11 Cat.14.S14
Cat.6.S6
Cat.10.S10
Cat.12.S12
Cat.7.S7 Cat.9.S9
−0.2
−0.1 0.0 0.1 0.2 0.3
−0.2 −0.1 0.0 0.1 0.2
PC1 [16%]
PC2 [11.1%]
Disease
●a
●a
CKD WT
PCoA (method=unifrac)
Control
●
●
●
●
●
●
●
●
●
●
●
●
●
●
Cat.4.S4
Cat.5.S5
Cat.1.S1
Cat.2.S2 Cat.3.S3
Cat.8.S8 Cat.13.S13
Cat.11.S11 Cat.14.S14
Cat.6.S6
Cat.10.S10
Cat.12.S12
Cat.7.S7 Cat.9.S9
−0.2
−0.1 0.0 0.1 0.2 0.3
−0.2 −0.1 0.0 0.1 0.2
PC1 [16%]
PC2 [11.1%]
Disease
●a
●a
CKD WT
PCoA (method=unifrac)
family 1 family 2 family 3 family 4
(A)
(B)
Figure 3-4. Relative abundance (A) and average relative abundance (B) of the gut microbiota at the phylum level. Microbial compositions in healthy cats (n =4, H1-H4) and cats with chronic kidney disease (n= 7, CKD1-CKD7) were based on 16S rRNA sequencing. The different letter (a, b) indicated samples collected from the same cat at different times. Others represented unclassified bacteria.
0%
10%
20%
30%
40%
50%
60%
70%
80%
90%
100%
CKD1 H1 CKD2 H2 CKD3a CKD3b H3 CKD4a CKD4b H4 CKD5a CKD5b CKD6 CKD7
Relative abundance (%)
Others (Bacteria) Firmicutes Fusobacteria Actinobacteria Proteobacteria Bacteroidetes
0%
10%
20%
30%
40%
50%
60%
70%
80%
90%
100%
CKD Healthy
Relative abundance (%)
Firmicutes Fusobacteria Actinobacteria Proteobacteria Bacteroidetes Cyanobacteria
(A)
(B)
Figure 3-5. Relative abundance (A) and average relative abundance (B) of the gut microbiota at the order level. (A) Microbial compositions in healthy cats (n =4, H1- H4) and cats with chronic kidney disease (n= 7, CKD1-CKD7) were based on 16S rRNA sequencing. The different letter (a, b) indicated samples collected from the same cat at different times. Others represented unclassified bacteria.
0%
10%
20%
30%
40%
50%
60%
70%
80%
90%
100%
CKD1 H1 CKD2 H2 CKD3a CKD3b H3 CKD4a CKD4b H4 CKD5a CKD5b CKD6 CKD7
Relative abundance (%)
Others (Bacteria)
p_Firmicutes;c__Bacilli;o__Lactobacillales p_Firmicutes;c__Erysipelotrichi;o__Erysipelotrichales p_Firmicutes;c__Clostridia;o__Clostridiales p_Fusobacteria;c__Fusobacteriia;o__Fusobacteriales p_Actinobacteria;c__Actinobacteria;o__Bifidobacteriales p_Actinobacteria;c__Coriobacteriia;o__Coriobacteriales p_Proteobacteria;c__Deltaproteobacteria;o__Desulfovibrionales p_Proteobacteria;c__Betaproteobacteria;o__Burkholderiales p_Proteobacteria;c__Epsilonproteobacteria;o__Campylobacterales p_Proteobacteria;c__Gammaproteobacteria;o__Pseudomonadales p_Proteobacteria;c__Gammaproteobacteria;o__Aeromonadales p_Proteobacteria;c__Gammaproteobacteria;o__Enterobacteriales p_Bacteroidetes;c__Bacteroidia;o__Bacteroidales
0%
10%
20%
30%
40%
50%
60%
70%
80%
90%
100%
CKD Healthy
Relative abundance (%)
p__Cyanobacteria;c__Chloroplast;o__Streptophyta p__Firmicutes;c__Bacilli;o__Lactobacillales p__Firmicutes;c__Erysipelotrichi;o__Erysipelotrichales p__Firmicutes;c__Clostridia;o__Clostridiales p__Fusobacteria;c__Fusobacteriia;o__Fusobacteriales p__Actinobacteria;c__Actinobacteria;o__Bifidobacteriales p__Actinobacteria;c__Coriobacteriia;o__Coriobacteriales p__Proteobacteria;c__Deltaproteobacteria;o__Desulfovibrionales p__Proteobacteria;c__Betaproteobacteria;o__Burkholderiales p__Proteobacteria;c__Epsilonproteobacteria;o__Campylobacterales p__Proteobacteria;c__Gammaproteobacteria;o__Pseudomonadales p__Proteobacteria;c__Gammaproteobacteria;o__Aeromonadales p__Proteobacteria;c__Gammaproteobacteria;o__Enterobacteriales p__Bacteroidetes;c__Bacteroidia;o__Bacteroidales
3.4 Difference of operational taxonomic units between CKD and control groups
To clarify the difference of gut microbial composition in the control and CKD cats, the average relative abundance of observed OTUs was performed by Mann-Whitney U test. The heat map showed significantly different OTUs (p <0.05) between CKD and control groups (Fig. 3-6). In total, there were significant differences in the abundance of 222 OTUs between CKD and control groups. Specifically, 14 OTUs were significantly enriched and 208 OTUs were significantly depleted in CKD groups compared to the controls. OTUs that were significantly enriched or depleted in CKD cats were further summarized in Table 3-4. OTUs that were significantly enriched in CKD groups were classified as Enterobacteriaceae, Ruminococcaceae, and Erysipelotrichaceae. OTUs that were significantly depleted in CKD groups were classified as Blautia, Coprococcus, Roseburia, Faecalibacterium etc.
The results of linear discriminant analysis (LDA) with effective size measurements (LEfSe) at genus and species level exhibited many biomarkers for cats with CKD and control cats (Fig 3-7). Enterococcus was enriched in CKD groups while Faecalibacterium, Adlercreutzia, Sutterella, Odoribacter, and Turicibacter were enriched in the control group (LDA > 2.0, p < 0.05). At species level, Eubacterium dolichum was enriched in CKD groups while Prevotella copri, Clostridium perfringens, and F. prausnitzii were significantly enriched in the controls.
In order to look for the gut microbiota that could be a potential biomarker in cats with CKD, the result of NGS data was analyzed by comparing bacterial abundance in cats from the same living conditions (family). Venn Diagram showed bacterial groups
which were either enriched or depleted by at least twice as much in CKD cats compared to the controls (Fig 3-8). Enterobacteriaceae was the only bacterial group that was shared among all four family domains and was enriched with a greater than 2-fold- change in CKD groups. In contrast, Bacteroides, Sutterella, and F. prausnitzii were bacterial groups that were shared among four family domains and the amounts of these bacteria were two times depleted in CKD groups. Table 3-5 summarized bacterial groups that were either two times enriched or two times depleted in CKD groups and were shared among three or four family domains.
The microbial community analyzed by next generation sequencing demonstrated a relative abundance of gut microbiota. To confirm the results of NGS and assess the changes in bacterial quantity, absolute quantification of gut microbiota was performed by qPCR (Fig 3-9). Bacterial copy numbers were converted into logarithmic values before analysis. Quantities of universal bacteria, total anaerobic bacteria, F. prausnitzii, Lactobacillus group, and Bifidobacteirum group were decreased in CKD groups compared to the controls, while E. coli was increased in CKD groups. However, only Bifidobacterium group had a statistical significance between the two groups (p = 0.047).
In CKD cats, the abundance of universal bacteria and F. prausnitzii was decreased, consistent with the sequencing results.
Since the concentration of indole was higher in CKD cats compared to the controls, we further determined the abundance of indole-producing bacteria in two groups based on the sequencing data. To date, at least 85 bacteria had been reported to have ability to produce indole (Lee and Lee, 2010), and two specific bacteria; E. coli and Propionibacterium acnes were identified in this study. Compared to controls, the
abundance of E. coli and Propionibacterium acnes were more prevalent in CKD groups (Fig 3-10).