行政院國家科學委員會專題研究計畫 成果報告
低體重嬰兒之全民健保醫療費用分析
計畫類別: 個別型計畫
計畫編號: NSC94-2416-H-038-003-
執行期間: 94 年 08 月 01 日至 95 年 07 月 31 日 執行單位: 臺北醫學大學醫務管理學系
計畫主持人: 湯澡薰 共同主持人: 許玫玲
報告類型: 精簡報告
處理方式: 本計畫可公開查詢
中 華 民 國 95 年 10 月 31 日
INTRODUCTION
Rapid economic developments over recent decades and the resultant changes in
social structures have dramatically brought down the birth rate in the developing
world. However, the incidence and improved survival chances of low birthweight
infants has increased, which is attributed primarily to recent medical advances in
perinatal practices, ranging from assisted ventilation to surfactant therapy.1-2From
1992 through 2002 in Taiwan, the birth rates dropped 29 per cent from 15.5 to 11.0
per 1000 women.3In the same period, the percentage of live born babies weighing
2500 mg and less increased 45 per cent from 4.99% to 7.23%. The reported incidence
of very-low-birth-weight (VLBW) and extremely-low-birth-weight (ELBW) babies
have increased at an even faster rate. The percentage of live born babies weighing less
than 1500 g in Taiwan increased 51 per cent from 0.31% in 1992 to 0.47% in 2002
and that of live born babies weighting less than 1000 g increased by 2.6 times from
0.07% to 0.25%.4
The increasing incidence and improved survival chances of infants of low
birthweight, combined with the diffusion of new technologies, have increased the
demand for and expenditure of care provided to these children in the infancy and
beyond and consumed a significantly portion of the finite health care resources. Most
of the studies in the scientific literature have focused on assessing treatment costs
consumed by low birth weight infants in the neonatal intensive care unit (NICU),5-12
relatively few studies have documented the longer-term costs of low birthweight
infants following their discharge from the neonatal unit. Some investigators reported
that low birthweight children have significantly more health service costs than do
normal birth weight in the first year of life13-16. In contrast, other studies followed up
the increase use and cost of health care services consumed by low birth weight infants
into early childhood17-21and even up to later childhood of age 8-9 years.22-23
Among all the aforementioned studies dealt with health care costs for low
birthweight, most of the studies focused on very-low-birth-weight (VLBW)5-6, 8-10, 13-16,
19-22
or extremely-low-birth-weight (ELBW).7,14,17,18,22
Less has been reported about
the costs of moderately-low-birth-weight (MLBW) infants.13,15,22In addition, very few
studies provided detailed and disaggregated information on the access to and
utilization of each type of health services.14,16,18Furthermore, most of the findings in
the prior studies were based upon a sampling frame or confined in a limited setting
when examining the effects of low birthweight on health care use, and the cost
estimates cannot be extrapolated and generalized.5-18,20
The purpose of this study is to fill the gap in the literature by conducting a
comprehensive economic assessment of low birthweightinfants’resource use and
costs associated with outpatient services and inpatient services in the first year of life
after birth.
METHODS
Data and Study Population
All infants born in Taiwan during January 1, 2000 and December 31, 2000
were first identified from the birth certificate data (n= 305,720). Second, random
samping scheme was employed to retrieve one tenth of the population as our study
sample. The incidence rate of low birthweight babies were 5.74% for MLBW infants,
0.43% for VLBW and 0.26% for ELBW. The birth certificate dataset comprises of
variables indicating maternal and paternal age and education, infant birth weight, sex,
gestation period (in weeks),and themother’sgravidity,maritalstatusand county of
residence.
ID numbers and date of birth were then used to match the National Health
Insurance enrollment history and the death file. Those who were not continuously
covered in the NHI plan for at least 1 year after birth or who died within one year
after birth were excluded (n= 154). Cases of missing birthweight information were
further deleted (n=23). The resulting number of records available for analysis was
30,328 infants.
ID numbers were also used to match NHI-paid claims history files to extract
records of all outpatient and inpatient services received by each infant following the
infant’sinitialdischargefrom theneonatalunitand beforeturning age2.The
beginning dateofservice on each NHIclaim wascompared to theinfant’sdateof
birth to determine if the specific claim falls into the first year of life. The initial
neonatal hospitalization was also included.
Statistical Methods and Analysis
For the purpose of analysis, 4 dummy variables were initially created to stratify
allinfantsinto 5 subgroupsaccording to theinfants’birthweight:<1,000 grams
(extremely-low-birth-weight; ELBW); 1000 to 1499 grams (very-low-birth-weight;
VLBW); 1,500 to 2,499 grams (moderately-low-birth-weight; MLBW); 2,500 to
4,499 grams (normal-birth-weight; NBW), or4,500 grams (large for gestational age, LGA), with NBW infants as the reference group. However, the pooled comparison of
LGA and NBW versus ELBW, VLBW or MLBW did not differ in resource use and
medical costs. Therefore, when the analyses were performed, NBW and LGA infants
were pooled together as one group.
The analyses were descriptive in nature, including mean, standard deviation (SD),
and percentages for categorical variables. Costs, outpatient visits, admissions, and
hospital day were tabulated on a per-case basis for one year after birth. All statistical
analyses were undertaken using SAS/Stats program (SAS software program package,
version 8.02, SAS Institute, Cary, NC).
RESULTS
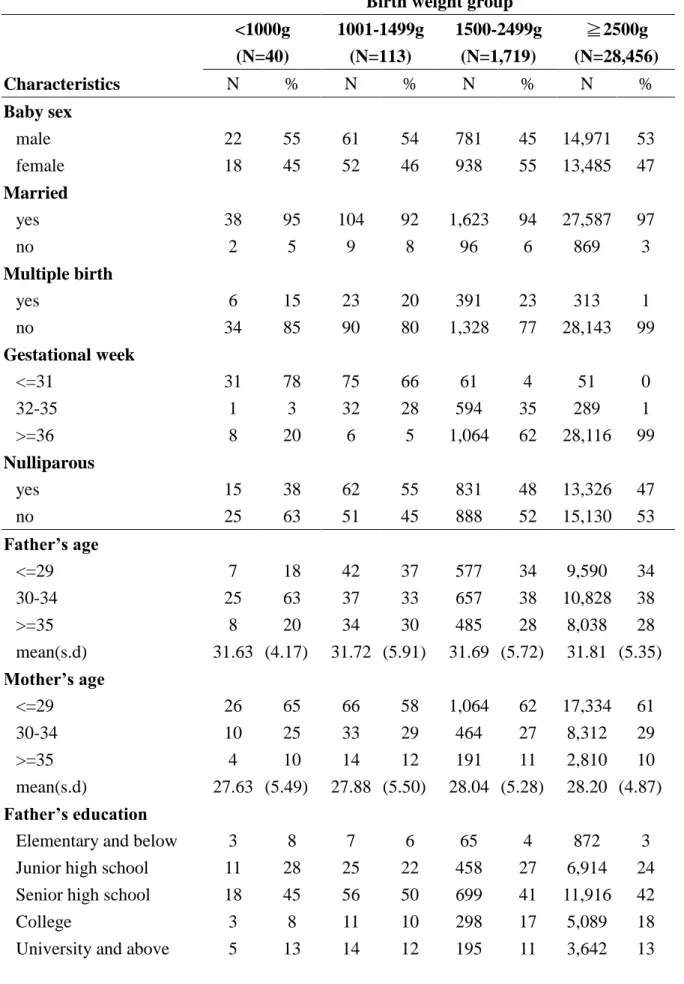
Table1 presents the socio-demographic characteristics of infants and their parents
varied according to birthweight. The incidence of low birthweight was higher for
unmarried couples and multiple births. The incidence of VLBW and ELBW were also
higher among preterm babies. Mean ofparents’agewereyoungeramong thethree
low birthweight groups versus NBW group. Parents with senior high-school education
were the most common among the all birthweight groups.
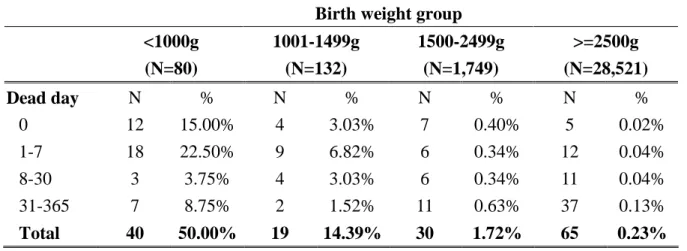
Table 2 shows the mortality rate of infants within one year after birth. The
neonatal death rate rises as the birth weight reduces. The infant mortality rate was
0.23% for NBW infants, 1.72% for MLBW infants, 14.39% for VLBW and 50.00%
for ELBW. Death of the ELBW and VLBW groups occurred more often within 7 days
after birth (37.50%, 9.85%).
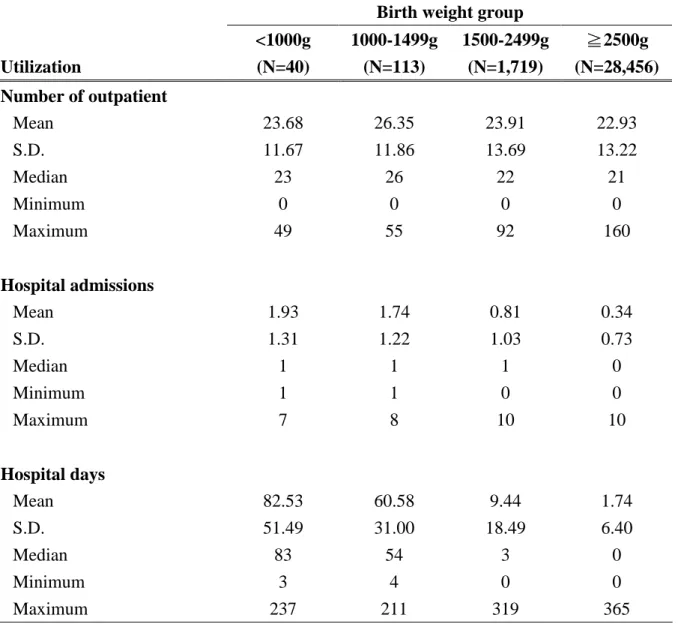
Table 3 shows the mean, standard error, median, minimum and maximum of
resourceoneyearafterinfants’birth according to birthweight group. Outpatient
utilization was similar across birthweight groups.
There exists significant differences in inpatient care across birthweight groups.
Mean number of admissions for the ELBW and VLBW were 1.93 and 1.74, which
were much higher than those of MLBW (0.81) and NBW (0.34). Number of hospital
days also increases as with reduced birthweight. Mean number of hospital days for
ELBW and VLBW during the first year of life were 82.53 and 60.58 days, which were
significantly higher than those of MLBW (9.44) and NBW (1.74).
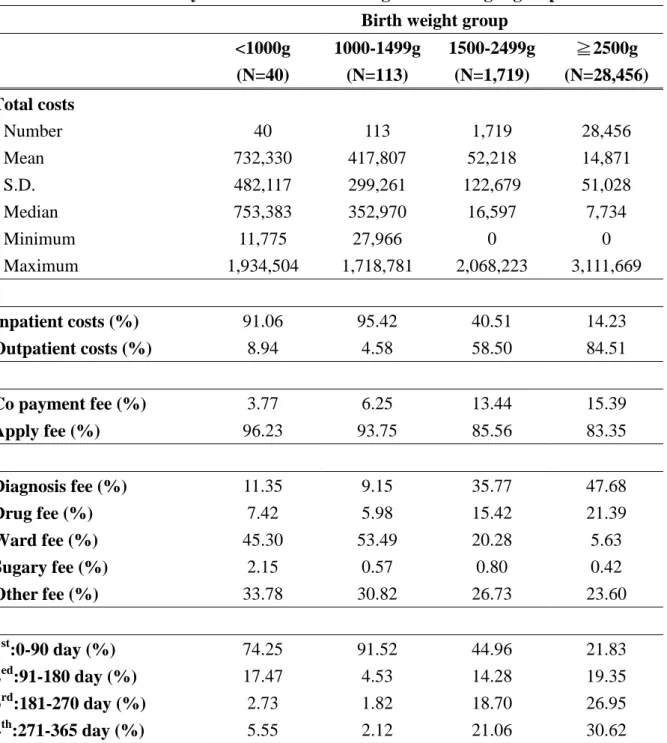
Table 4 shows medical costs of infants one year after birth. Mean costs of ELBW
and VLBW were 49 and 28 times higher, respectively, than those of the NBW group.
Similarly, median costs of ELBW and VLBW were 97 and 46 times higher than those
of the NBW group.
Table 4 also displays the distribution of costs by types of care, category of costs,
and time points when costs incurred. For ELBW and VLBW groups, costs were
mostly concentrated on inpatient care. Inpatient costs consists 91.06% and 95.42% of
total medical costs for ELBW and VLBW infants, respectively. Conversely, only
40.51% and 14.23% of total costs were spent in inpatient care for MLBW and NBW
infants, respectively.
Percentage of copayment reduced as birthweight increased. Ward fees took up
the largest proportion of costs for ELBW and VLBW group (45.30% and 53.49%,
respectively). Conversely, diagnosis fees and drugs fees took up 51.19% and 69.07%
of total costs for MLBW and NBW group, respectively. With regarding to the
distribution of costs across four quarters of the year, costs occurred within the 1st
quarter took up about 74.25% and 91.52% of total costs for ELBW and VLBW infants;
whereas costs for MLBW and NBW infants were much more spreading out into the
2nd, 3rdand 4thquarters.
DISCUSSION
This study used NHI claims data in Taiwan to provide estimates of medical
treatmentcostsduring theinfant’sfirstyearoflife on low birthweightinfantsversus
normal birthweight infants.
A search of the publication in the literature revealed that relatively few studies
have estimated the medical treatment costs after discharge from the initial
hospitalization following birth. Neither had much publication dealt with medical
treatment costs of low birthweight other than hospital services costs. Moreover, very
few of the cost estimates of the low birthweight in the existing literature came from
the developing world. As the incidence of low birthweight infants has been increasing
in a faster rate during these years in the developing countries due to technology
advance in medical practices, economic burden on low birthweight infants will
become more and more substantial.
The major strengths of this study are that it was based on the random sampling of
a population-based linked datasets which included a comprehensive and validated
record of demographic background as well as health service data. The availability of
linked data enabled us to relate birthweight at birth to 1-year follow-up on outpatient
and emergency visitsand admissionsand to sum each infant’ssuccessivevisits,
admissions and expenditures to calculate their total volume of services and
expenditures prior to turning age 2. The study cost accounting was comprehensive and
included all significant outpatient, emergency and inpatient cost items. This provided
a reliable basis for estimating the economic implications of low birthweight.
This study was limited in that it has adopted a narrow perspective of view. A
small number of studies have shown that survivors of low birthweight consume
significantly greater education services and social requirements than infants born at
normal birthweight.23In addition, a wider costs to society, such as productivity loss
of the parents of low birthweight infants, was evidenced to be substantial.24-25
Moreover, the effect of low birthweight has showed to persist into late childhood.22,23
Consequently, a broader and longer-term term impacts are required to provide a
complete economic evaluation.
The second limitation is that in this study costs were estimated based on the NHI
claims data. The reimbursement rates may include elements arising from the financial
decision of the Bureau of NHI and therefore be poor proxies for the real
resources-based costs of caring for low birthweight infants.
Despite the limitations of our study, the results have important clinical and policy
implications. Given the recent evidence of an increasing incidence of low birthweight,
it is crucial for clinical decision-makers and health authorities concerned to recognize
the overall economic impact of low birthweight and to devise the cost-effectiveness
strategies of preventing and treating low birthweight infants.
REFERENCES
1. Horbar JD, Wright EC, Onstad L, et al. Decreasing mortality associated with the
introduction of surfactant therapy: an observational study of neonates weighing 601-1300
grams at birth. Pediatrics. 1993;92:191-196.
2. Schwartz RM, Luby AM, Scanlon JW, Kellogg RJ. Effect of surfactant on morbidity,
mortality, and resource use in newborn infants weighing 500 to 1500 g. N Engl J Med.
1994;330:1476-1480.
3. Ministry of Interior. 2002 Taiwan-Fuchien Demographic Fact Book, Republic of China,
2002.
4. Statistics calculated by authors using birth certificates dataset from the
Department of Interior Affairs.
5. Cheah IGS, Soosai AP, Wong SL, Lim TO. Cost-Effectiveness Analysis of
Malaysian Neonatal Intensive Care Units. J Perinatoloty. 2004;1-7.
6. Stolz JW, McCormick MC. Restricting access to neonatal intensive care: effect on
mortality and economic savings. Pediatrics. 1998;101:344-348.
7. Perlstein PH, Atherton HD, Donovan EF, et al. Physician variations and the
ancillary costs of neonatal intensive care. Health Serv Res. 1997;32:299-311.
8. Tudehope DI, Lee W, Harris F, Addison C. Cost analysis of neonatal intensive
and special care. Aust Paediatr J. 1989;25:61-65.
9. Pharoah OD, Stevenson RC, Cooke RW, Sandu B. Costs and benefits of neonatal
intensive care. Arch Dis Child. 1988;63:715-718.
10. Boyle MH, Torrance GW, Sinclair JC, Horwood SP. Economic evaluation of
neonatal intensive care of very-low-birth-weight infants. N Engl J Med.
1983;308:1330-1337.
11. Phibbs CS, Williams RL, Phibbs RH. Newborn risk factors and the costs of
neonatal intensive care. Pediatrics. 1981;68:313-321.
12. McCarthy JT, Koops BL, Honeyfield PR, Butterfield LJ. Who pays the bill for
neonatal intensive care? J Pediatr. 1979;95:755-761.
13. Rolnick SJ,Jackson JM,O’ConnorP,DeForT.Impactofbirthweighton health
charges within a managed care organization. Am J Manag Care.
2000;6:1289-1296.
14. Rogowski J. Cost-effectiveness of care for very low birth weight infants.
Pediatrics. 1998;102:35-43.
15. Lewit EM, Baker LS, Corman H, Shiono PH. The direct cost of low birth weight.
Future Child. 1995;5:35-56.
16. McCormick MC, Bernbaum JC, Eisenberg JM, Kustra SL, Finnegan E. Costs
incurred by parents of very low birth weight infants after the initial neonatal
hospitalization. Pediatrics. 1991;88:533-541.
17. Doyle LW, Ford G, Davis N. Health and hospitalizations after discharge in
extremely low birth weight infants. Semin in Fet and Neon Med. 2003;8:137-145.
18. Tommiska V, Tuominen R, Fellman V. Economic costs of care in extremely low
birthwieght infants during the first 2 years of life. Pediatr Crit Care Med.
2003;4:157-163.
19. Stevenson RC, Pharoah PO, Cooke RW, Sandhu B. Predicting costs and outcomes
of neonatal intensive care for very low birthweight infants. Public Health.
1991;105:121-126.
20. Kitchen WH, Ford GW, Doyle LW, Rickards AL, Kelly EA. Health and hospital
readmissions of very-low-birth-weight and normal-birth-weight children. Amer J
Dis Child. 1990;144:213-218.
21. Brooten D, Kumar S, Brown LP, et al. A randomized clinical trial of early hospital
discharge and home follow-up of very-low-birth-weight infants. N Engl J Med.
1986;315:934-939.
geographically determined population of low birthweight infants to age 8-9 years.
I. Children without disability. Archives of Disease in Childhood.
1996;74:F114-F117.
23. Stevenson RC, Pharoah PO, Stevenson CJ, McCabe CJ, Cooke RW. Cost of care
for a geographically determined population of low birthweight infants to age 8-9
years. II. Children with disability. Archives of Disease in Childhood.
1996;74:F118-F121.
24. Chaikind S, Corman H. The impact of low birthweight on special education costs.
J Health Economics. 1991;10:291-311.
25. Gennaro S. Leave and employment in families of preterm low birthweight infants.
Image: Journal of Nursing Scholarship. 1996;28:193-198.
Table1 Infant’scharacteristicsaccording to birth weightgroup
Birth weight group
<1000g (N=40)
1001-1499g (N=113)
1500-2499g (N=1,719)
2500g
≧
(N=28,456)
Characteristics N % N % N % N %
Baby sex
male 22 55 61 54 781 45 14,971 53
female 18 45 52 46 938 55 13,485 47
Married
yes 38 95 104 92 1,623 94 27,587 97
no 2 5 9 8 96 6 869 3
Multiple birth
yes 6 15 23 20 391 23 313 1
no 34 85 90 80 1,328 77 28,143 99
Gestational week
<=31 31 78 75 66 61 4 51 0
32-35 1 3 32 28 594 35 289 1
>=36 8 20 6 5 1,064 62 28,116 99
Nulliparous
yes 15 38 62 55 831 48 13,326 47
no 25 63 51 45 888 52 15,130 53
Father’sage
<=29 7 18 42 37 577 34 9,590 34
30-34 25 63 37 33 657 38 10,828 38
>=35 8 20 34 30 485 28 8,038 28
mean(s.d) 31.63 (4.17) 31.72 (5.91) 31.69 (5.72) 31.81 (5.35) Mother’sage
<=29 26 65 66 58 1,064 62 17,334 61
30-34 10 25 33 29 464 27 8,312 29
>=35 4 10 14 12 191 11 2,810 10
mean(s.d) 27.63 (5.49) 27.88 (5.50) 28.04 (5.28) 28.20 (4.87) Father’seducation
Elementary and below 3 8 7 6 65 4 872 3
Junior high school 11 28 25 22 458 27 6,914 24
Senior high school 18 45 56 50 699 41 11,916 42
College 3 8 11 10 298 17 5,089 18
University and above 5 13 14 12 195 11 3,642 13
Mother’seducation
Elementary and below 0 0 6 5 69 4 842 3
Junior high school 8 20 28 25 414 24 6,366 22
Senior high school 26 65 53 47 818 48 13,368 47
College 3 8 14 12 260 15 5,131 18
University and above 3 8 11 10 155 9 2,728 10
Table 2 Infant’smortality rate according to birth weight group
Birth weight group
<1000g (N=80)
1001-1499g (N=132)
1500-2499g (N=1,749)
>=2500g (N=28,521)
Dead day N % N % N % N %
0 12 15.00% 4 3.03% 7 0.40% 5 0.02%
1-7 18 22.50% 9 6.82% 6 0.34% 12 0.04%
8-30 3 3.75% 4 3.03% 6 0.34% 11 0.04%
31-365 7 8.75% 2 1.52% 11 0.63% 37 0.13%
Total 40 50.00% 19 14.39% 30 1.72% 65 0.23%
Table 3 Health care resource use one year after birth according to birth weight group
Birth weight group
Utilization
<1000g (N=40)
1000-1499g (N=113)
1500-2499g (N=1,719)
2500g
≧
(N=28,456) Number of outpatient
Mean 23.68 26.35 23.91 22.93
S.D. 11.67 11.86 13.69 13.22
Median 23 26 22 21
Minimum 0 0 0 0
Maximum 49 55 92 160
Hospital admissions
Mean 1.93 1.74 0.81 0.34
S.D. 1.31 1.22 1.03 0.73
Median 1 1 1 0
Minimum 1 1 0 0
Maximum 7 8 10 10
Hospital days
Mean 82.53 60.58 9.44 1.74
S.D. 51.49 31.00 18.49 6.40
Median 83 54 3 0
Minimum 3 4 0 0
Maximum 237 211 319 365
Table 4 Medical costs one year after birth according to birth weight group Birth weight group
<1000g (N=40)
1000-1499g (N=113)
1500-2499g (N=1,719)
2500g
≧
(N=28,456) Total costs
Number 40 113 1,719 28,456
Mean 732,330 417,807 52,218 14,871
S.D. 482,117 299,261 122,679 51,028
Median 753,383 352,970 16,597 7,734
Minimum 11,775 27,966 0 0
Maximum 1,934,504 1,718,781 2,068,223 3,111,669
Inpatient costs (%) 91.06 95.42 40.51 14.23
Outpatient costs (%) 8.94 4.58 58.50 84.51
Co payment fee (%) 3.77 6.25 13.44 15.39
Apply fee (%) 96.23 93.75 85.56 83.35
Diagnosis fee (%) 11.35 9.15 35.77 47.68
Drug fee (%) 7.42 5.98 15.42 21.39
Ward fee (%) 45.30 53.49 20.28 5.63
Sugary fee (%) 2.15 0.57 0.80 0.42
Other fee (%) 33.78 30.82 26.73 23.60
1st:0-90 day (%) 74.25 91.52 44.96 21.83
2ed:91-180 day (%) 17.47 4.53 14.28 19.35
3rd:181-270 day (%) 2.73 1.82 18.70 26.95
4th:271-365 day (%) 5.55 2.12 21.06 30.62