Magnetic properties of Fe
3C nanograins embedded in carbon matrix
Y. H. Lee,a) T. C. Han, and J. C. A. Huang
Physics Department, National Cheng-Kung University, Tainan 70101, Taiwan, Republic of China 共Presented on 15 November 2002兲
Magnetron dc cosputtering of a composite target of graphite disk plus iron rods was used in manufacturing carbon films with Fe3C nanograin inclusions. Both temperature- and field-dependent magnetizations, M (T) and M (H), were measured for samples of various carbon concentrations 共from 37% to 85%兲. M(T) were measured in both conditions of zero-field cooling and a field cooling at H⫽100 Oe. Experimental results of(T), obtained from M (T), of zero-field cooling, were theoretically fitted by using Wolhfarth’s model of noninteracting particles with log–normal distribution function of particle size. © 2003 American Institute of Physics.
关DOI: 10.1063/1.1555852兴
High-density magnetic recording medium, on the order of 100 Gb/in.2, is a target that many investigators are striving for. Although many different materials and techniques1–7 have been proposed to reach the goal, there are common important features existing among these proposals. They are fine magnetic particles/grains on the order of nanometer and well magnetically insulated in order to have high enough density and signal-to-noise ratio. Besides, due to ultrafine magnetic particles, thermal stability is especially important. Thus, high coercivity or high magnetocrystalline anisotropy of a material is concerned. Based on our long-term research on the topic of diamond-like carbon 共DLC兲 films, we chose making Fe–C composite films for the application of high-density recording media. We have succeeded in making pure Fe3C nanograins embedded in amorphous carbon films pos-sessing room-temperature coercivity of 965 Oe, which is higher than the reported values among other works on Fe–C composites.8 –10
Amorphous carbon films containing Fe3C nanograins were made by sputtering a 2-in.-diam graphite target with several pieces of iron rods, 2 mm diam and 4 mm long, on top of it. Figure 1 shows the carbon concentration of films changing with the sputtering pressure and the number of pieces of iron rods. The dashed line in Fig. 1, obtained by referring to the results of transmission electron microscopy 共TEM兲 studies,11is used to identify a region of lower pres-sures and higher carbon concentrations, in which pure Fe3C grains are produced.
Temperature-dependent magnetizations, M (T), were measured in a field of H⫽100 Oe in both conditions of zero-field cooling共ZFC兲 and a field cooling 共FC兲. The results of (T)⫽M(T)/H of the samples made at a constant pressure of 8.5 mTorr with carbon concentrations of 42%, 65%, and 85%, respectively, are selected and displayed in Fig. 2. The films with 42 and 65 at. % C contain both Fe and Fe3C grains but the film with 85 at. % C contains only Fe3C grains. In Fig. 2, all ZFC curves of susceptibilities, Z(T), show an
increasing behavior with temperature until a maximum is
reached at T⫽TB, temporarily called the ‘‘blocking
tem-perature,’’ after which it decreases with temperature. The susceptibilities of the FC curves,FC(T), increase with de-creasing temperature until reaching a maximum. The maxi-mum is maintained in Fig. 2共a兲 at low temperatures. How-ever, a low-temperature minimum appears, additionally, in bothFC(T) of Figs. 2共b兲 and 2共c兲, but it is much weaker in 共c兲. An additional low temperature minimum in Z(T) is
observed only in Fig. 2共b兲. It is also found thatFC(T) de-viates from Z(T) at T⫽Tirr⫽TB as the temperature
de-creases. Both the difference between Z(T) and FC(T) at TB⭐T⭐Tirrand the temperature range between Tirrand TB are getting smaller from Figs. 2共a兲–2共c兲 with carbon concen-tration getting larger. These characteristic behaviors of Z(T) andFC(T) can be understood in the framework of superparamagnetism.12 On considering a system of single domain magnetic particles, relaxation time is important in determining how quickly the remanence Mr relaxes to its
a兲Electronic mail: [email protected]
FIG. 1. Relation of carbon concentration changes with sputtering pressure and number of pieces of iron rods. Dashed line is used to indicate a region of low pressure and high carbon concentration, in which pure Fe3C grains
are obtained.
JOURNAL OF APPLIED PHYSICS VOLUME 93, NUMBER 10 15 MAY 2003
8462
0021-8979/2003/93(10)/8462/3/$20.00 © 2003 American Institute of Physics
equilibrium value at temperature T. The relaxation time is derived and expressed as12
⫺1⫽ f
oexp共⫺KaV/kBT兲. 共1兲
Ka is the magnetic anisotropy constant, V the particle
vol-ume, kB the Boltzmann constant, T the absolute temperature,
and fo the frequency factor which has a value of 109– 1011s⫺1. Obviously, the value ofdepends on both V and T. For a typical time of experiment, ⫽100 s is a rea-sonable value to mark the transition to a stable behavior. At temperature T, an upper limit of particle volume Vm
⫽29.9kBT/Ka is estimated for being superparamagnetic.
Be-cause⬍100 s for particles with V⬍Vm, it shows
paramag-netism and gives zero coercivity. For particles of constant size V, there exists a temperature TB⫽KaV/29.9kB. When T⬍TB (⬎100 s), paramagnetism disappears and hysteresis
appears. TBis thus called blocking temperature. In Fig. 2, all
curves of Z(T) increase gradually from low temperature to
a maximum at T⫽TB, indicating a nonconstant size of
grains existing in the films. TB is thus more proper to be
called the ‘‘most probable blocking temperature’’ and Vm,
calculated from TB, is the ‘‘most probable maximum grain
volume.’’ For simplicity, we still call TB the blocking
tem-perature and Vm the maximum grain volume. By assuming
the grain as a spherical ball, the maximum grain diameter, Dm, is used, instead.
The curve of theZ(T) changes with temperature is gov-erned by the grain size distribution. By fitting Z(T) theo-retically, we can obtain anisotropy constant Ka together with TB, Vm, and grain size distribution function f (x), from which the mean grain volume
具
V典
, and thus the mean grain diameter, 具D典, can be calculated. A model of Wohlfarth’s noninteracting magnetic particles is adopted in the process of fitting. According to Wohlfarth,13we getx f共x兲⫽关3Ka/Ms
2
ln共2fo兲⫺1兴 d
dT共T兲. 共2兲 the volume fraction occupied by ferromagnetic particles and is approximated as one; Msthe saturation magnetization and is obtained separately from M (H) measurements. In fit-ting the experimental results of (d/dT)(T), f (x) was as-sumed a log–normal distribution function as
f共x兲⫽共1/冑2x兲exp
冋
⫺共ln x兲 222
册
. 共3兲x⫽V/
具
V典
⫽TB/具
TB典
and具
TB典
is the mean blockingtem-perature; is a fitting parameter which is related with the dispersion of grain size distribution. Equation 共3兲 is then used in calculating Z(T) 共Ref. 14兲 of the films with
non-constant grains as Z共T兲⫽ Ms 2
具
V典
3kBT冕
0 Vm共T兲 x f共x兲dx⫹Ms 2 3Ka冕
Vm共T兲 ⬁ f共x兲dx. 共4兲FIG. 2. Temperature dependence of susceptibility,(T), for samples of共a兲 42 at. % C,共b兲 65 at. % C, and 共c兲 85 at. % C and for conditions of zero-field cooling共ZFC兲 and field cooling 共FC兲. Solid line shows results of calculation by using Wohlfarth’s model of non-interacting magnetic particles.
TABLE I. Most probable blocking temperature and grain diameter, TBand
Dm, fitting parameter , coercivity, and saturation magnetization at the
temperature of 5 K, Hc(5 K), and Ms(5 K), are listed for the films
contain-ing both Fe and Fe3C grains and only Fe3C grains.
Sample TB 共K兲 Dm 共nm兲 HC共Oe兲共5 K兲 MS共5 K兲 共emu/cm3 兲 at. % C Pressure 共mTorr兲 42a 85 52 6.5 1.20 402 400 65a 8.5 32 6.4 0.52 208 227 85b 8.5 13 4.9 0.47 170 148 78b 6 15 5.1 0.50 400 365 75b 6 15 5.1 0.51 410 380 72b 4 20 5.2 0.55 503 395
aThe sample contains both Fe and Fe 3C grains. b
The sample contains only Fe3C grains.
8463
J. Appl. Phys., Vol. 93, No. 10, Parts 2 & 3, 15 May 2003 Lee, Han, and Huang
The results of the calculations are shown as solid lines in Fig. 2. A very good fit is observed only in Fig. 2共c兲 where the film contains pure Fe3C grains. However, discrepancies are observed in Figs. 2共a兲 and 2共b兲, which are attributed to Fe grains existing in these films. The discrepancy decreases with increasing carbon concentration 共or decreasing iron concentration兲. From TEM images11of the film with 42 at. % C, some specially large Fe grains were observed near the edges of the film, which result in not only a large deviation between the results of calculation and experiment but also a shoulder-like behavior in(T) at the high temperature. From fitting, results of TB, Dm,具D典,, and Kaof the films used in Fig. 2 are obtained. Only those related to the discussion here, like TB, Dm, and are listed in Table I. Also included in Table I are the results of the films being made at lower pres-sures and containing pure Fe3C grains with carbon concen-tration of 78%, 75%, and 72%, respectively. For the films made at the constant pressure of 8.5 mTorr, decreases when carbon concentration increases from 42% to 85%.
Smaller implies more uniform grain size distribution, therefore, less difference betweenZ(T) andFC(T). Thus, both the deviation betweenZ(T) andFC(T) and the range between Tirrand TBare getting smaller from Figs. 2共a兲–2共c兲.
The additional low-temperature minimum in bothZ(T) and
FC(T) in Fig. 2共b兲 is due to the very fine grains, which are not blocked at very low temperatures. Comparing to Dm
⫽6.4 nm of 65 at. % C, grains of 85 at. % C are much smaller with Dm⫽4.9 nm. Thus, a much weaker
low-temperature minimum ofFC(T) is observed in Fig. 2共c兲 and that ofZ(T), which is assumed to occur at the temperature
lower than our measuring temperature, is not observed. Field-dependent magnetization measurements, M (H), were taken at both temperatures of 298 and 5 K. All films as deposited are paramagnetic at room temperature. Coercivity, Hc, and saturation magnetization, Ms, obtained from M (H)
are the values at T⫽5 K and listed in Table I. Focusing at the films with pure Fe3C grains in Table I, Dmincreases slightly
with decreasing carbon concentration from 85% to 72% and both HC and MS increase with increasing Dm. It implies
Fe3C grains are single magnetic domain. In order to obtain coercivity at room temperature, the film with 72 at. % C and the largest Dm was chosen for postdeposition annealing at
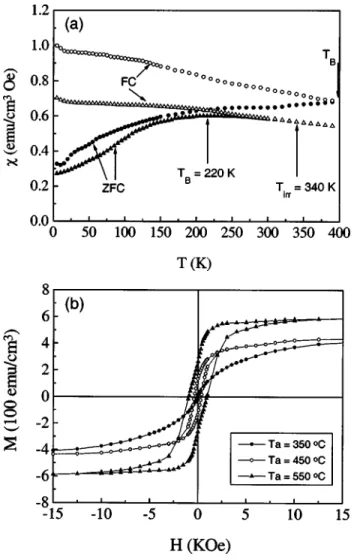
temperatures Ta⫽250– 600 °C for 60 min. In Fig. 3共a兲,(T) of Ta⫽250 and 550 °C, measured at H⫽100 Oe, are dis-played. TB, thus Dm, increases strongly with increasing Ta. M (H) measured at T⫽298 K for Ta⫽350, 450, and 550 °C, respectively, is displayed in Fig. 3共b兲. At Ta⭓450 °C, non-zero-room-temperature coercivity is observed and increasing with Ta. MS increases also with Ta. At Ta⫽600 °C, Fe3C
grains decomposed. The largest Ms⫽585 emu/cm3 and Hc(298 K)⫽965 Oe are obtained at Ta⫽550 °C. The
aver-aged grain size for Ta⫽550 °C is estimated, from the TEM
images,11to be about 18 nm.
The authors would like to acknowledge the financial support of this work by the Republic of China’s National Science Council under Grant No. NSC90-2112-M006-031.
1M. J. Bonder, E. M. Kirkpatrick, T. Martin, S.-J. Kim, R. D. Rieke, and D.
L. Leslie-Pelecky, J. Magn. Magn. Mater. 222, 70共2000兲.
2J. A. Christodoulides, Y. Huang, Y. Zhang, and G. C. Hadjipanayis, J.
Appl. Phys. 87, 6938共2000兲.
3S.-I. Hirano and S. Tajima, J. Mater. Sci. 25, 4457共1990兲. 4
J.-J. Delaunay, T. Hayashi, M. Tomita, and S. Hirono, Jpn. J. Appl. Phys., Part 1 36, 7801共1997兲.
5X. Bao, R. M. Metzger, and W. D. Doyle, J. Appl. Phys. 73, 6734共1993兲. 6C. L. Chien, J. Appl. Phys. 69, 5267共1991兲.
7S. Y. Chou, P. R. Krauss, and L. Kong, J. Appl. Phys. 79, 6101共1996兲. 8
C. Chen, O. Kitakami, and Y. Shimada, J. Appl. Phys. 84, 2184共1998兲.
9K. Watanabe, M. Munakata, and K. Goto, Jpn. J. Appl. Phys., Part 2 26,
L28共1987兲.
10S. Tajima and S. Hirano, J. Mater. Sci. 28, 2715共1993兲. 11
Y. H. Lee, T. C. Han, J. C. A. Huang, and C. R. Lin, J. Appl. Phys.
共submitted兲.
12B. D. Cullity, Introduction to Magnetic Materials共Addison-Wesley,
Read-ing, MA, 1992兲, Chap. 11.
13T. Bitoh, K. Ohba, M. Takamatsu, T. Shirane, and S. Chikazawa, J. Magn.
Magn. Mater. 154, 59共1996兲.
14E. Zubov, P. Byszewski, V. Chabanenko, E. Kowalska, L. Gladczuk, and
R. Kochkanjan, J. Magn. Magn. Mater. 222, 89共2000兲. FIG. 3. 共a兲 Temperature dependence of susceptibility (T); triangle and
circle are for Ta⫽250 °C and Ta⫽550 °C, respectively; and 共b兲 field
de-pendence of magnetization M (H) for sample of 72 at. % C made at pressure of 4 mTorr and annealed at temperature of 550 °C.
8464 J. Appl. Phys., Vol. 93, No. 10, Parts 2 & 3, 15 May 2003 Lee, Han, and Huang