表 4.1.1 運動訓練與月經週期規律性對受試者生理參數之主要效果及交互作用效果分析1 Table 4.1.1 Anthropometric parameters of the subjects, analyzed by two-way ANOVA1
Age (years)
Height (cm)
Weight (kg)
Estradiol (pg/ml)
Age at menarche (years)
Exercise status .0729 .6579 .3732 .2753 .1907
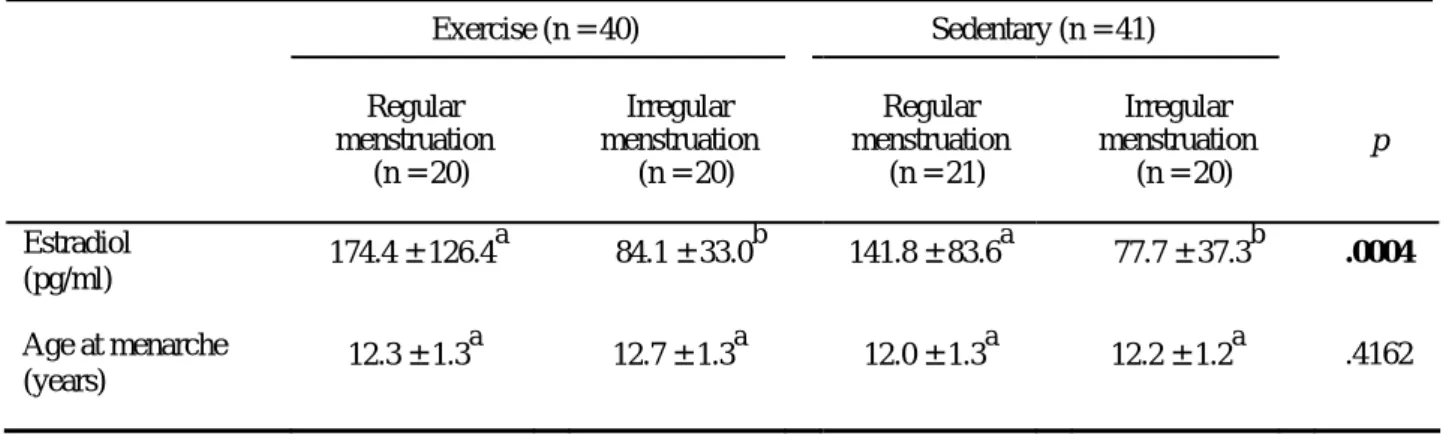
Menstrual status .2508 .5985 .6010 <.0001 .3355
Interaction .2508 .6884 .4819 .4641 .6651
1p-values of main effect.
表 4.1.2 各組受試者之生理參數1
Table 4.1.2 Anthropometric parameters of the subjects, analyzed by one-way ANOVA1
1Values are mean ± S.D.. Values with same superscripts are not significantly different (p<.05).
Exercise (n = 40) Sedentary (n = 41) Regular
menstruation (n = 20)
Irregular menstruation
(n = 20)
Regular menstruation
(n = 21)
Irregular menstruation
(n = 20)
p
Age (years) 19.8 ± 1.1a 19.8 ± 1.0a 20.0 ± 1.5a 20.7 ± 1.7a .1252
Height (cm) 161.2 ± 5.4a 161.3 ± 5.9a 160.1 ± 4.2a 161.3 ± 5.8a .8835
Weight (kg) 53.7 ± 6.3a 54.0 ± 6.3a 53.4 ± 7.0a 51.5 ± 8.8a .6698
表 4.2 各組受試者之運動習慣1
Table 4.2 Exercise status of the subjects, analyzed by one-way ANOVA1
1Values are mean ± S.D.. Values with same superscripts are not significantly different (p<.05).
表 4.3 各組受試者之血清雌激素濃度與初經年齡調查1
Table 4.3 Serum estradiol concentration and age at menarche of the subjects, analyzed by one-way ANOVA1
1Values are mean ± S.D.. Values with same superscripts are not significantly different (p<.05).
Exercise (n = 40) Sedentary (n = 41) Regular
menstruation (n = 20)
Irregular menstruation
(n = 20)
Regular menstruation
(n = 21)
Irregular menstruation
(n = 20)
p
Exercise frequency
(times/week) 6.6 ± 2.6a 6.8 ± 2.9a 1.7 ± 2.6b 0.9 ± 1.5b <.0001 Exercise time
(hours/week) 18.8 ± 4.5a 19.0 ± 8.4a 0.9 ± 1.3b 1.0 ± 1.9b <.0001 Exercise duration
(years) 7.5 ± 3.1a 7.8 ± 3.7a 0.7 ± 1.6b 0.5 ± 0.8b <.0001
Exercise (n = 40) Sedentary (n = 41) Regular
menstruation (n = 20)
Irregular menstruation
(n = 20)
Regular menstruation
(n = 21)
Irregular menstruation
(n = 20)
p
Estradiol
(pg/ml) .174.4.±.126.4a .84.1.±.33.0b
0
141.8.±.83.6a .77.7.±.37.3b
00
.0004 Age at menarche
(years) 12.3 ± 1.3a 12.7 ± 1.3a 12.0 ± 1.3a 12.2 ± 1.2a .4162
表 4.4.1 運動訓練與月經週期規律性對受試者自我體型認知之主要效果及交互作用效果分析1 Table 4.4.1 Self-perceived body image of the subjects, analyzed by two-way ANOVA1
Desired somatotype
Current somatotype
Difference in somatotype
Desired BMI
Current BMI
Difference in BMI
Desired WHR
Current WHR
Difference in WHR
Exercise status .0001 .9728 .0329 .4959 .4467 .2118 .9526 .7784 .7256 Menstrual status .5650 .9159 .6782 .6842 .3866 .2317 .1430 .9293 .1235 Interaction .8446 .1663 .2129 .9430 .2861 .2256 .1999 .2660 .9077
1p-values of main effect. Difference = Desired – Current. BMI, body mass index; WHR, waist to hip ratio.
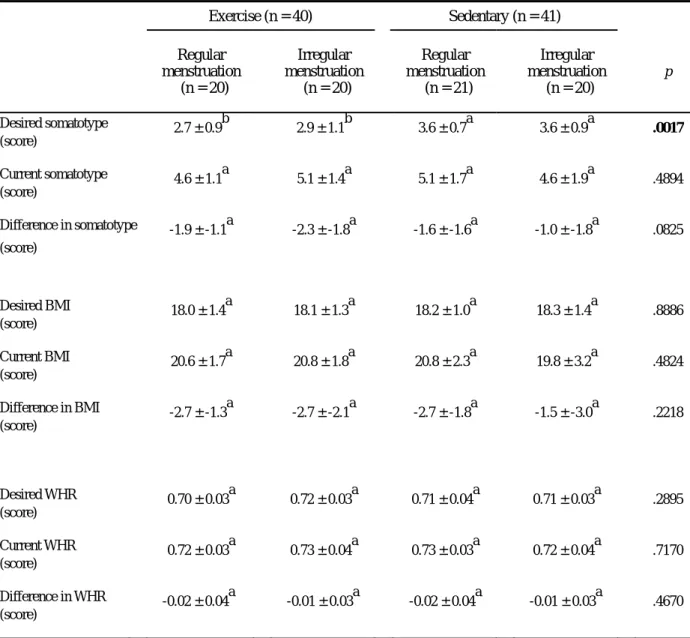
表 4.4.2 各組受試者之自我體型認知1
Table 4.4.2 Self-perceived body image of the subjects, analyzed by one-way ANOVA1
1Values are mean ± S.D.. Values with same superscripts are not significantly different (p<.05). Difference = Desired – Current. BMI, body mass index; WHR, waist to hip ratio.
Exercise (n = 40) Sedentary (n = 41) Regular
menstruation (n = 20)
Irregular menstruation
(n = 20)
Regular menstruation
(n = 21)
Irregular menstruation
(n = 20)
p
Desired somatotype (score)
2.7 ± 0.9b
2.9 ± 1.1b
3.6 ± 0.7a
3.6 ± 0.9a
.0017
Current somatotype (score)
4.6 ± 1.1a
5.1 ± 1.4a
5.1 ± 1.7a
4.6 ± 1.9a
.4894
Difference in somatotype (score)
-1.9 ± -1.1a
-2.3 ± -1.8a
-1.6 ± -1.6a
-1.0 ± -1.8a
.0825
Desired BMI (score)
18.0 ± 1.4a
18.1 ± 1.3a
18.2 ± 1.0a
18.3 ± 1.4a
.8886
Current BMI (score)
20.6 ± 1.7a
20.8 ± 1.8a
20.8 ± 2.3a
19.8 ± 3.2a
.4824
Difference in BMI (score)
-2.7 ± -1.3a
-2.7 ± -2.1a
-2.7 ± -1.8a
-1.5 ± -3.0a
.2218
Desired WHR (score)
0.70 ± 0.03a
0.72 ± 0.03a
0.71 ± 0.04a
0.71 ± 0.03a
.2895
Current WHR (score)
0.72 ± 0.03a
0.73 ± 0.04a
0.73 ± 0.03a
0.72 ± 0.04a
.7170
Difference in WHR (score)
-0.02 ± 0.04a
-0.01 ± 0.03a
-0.02 ± 0.04a
-0.01 ± 0.03a
.4670
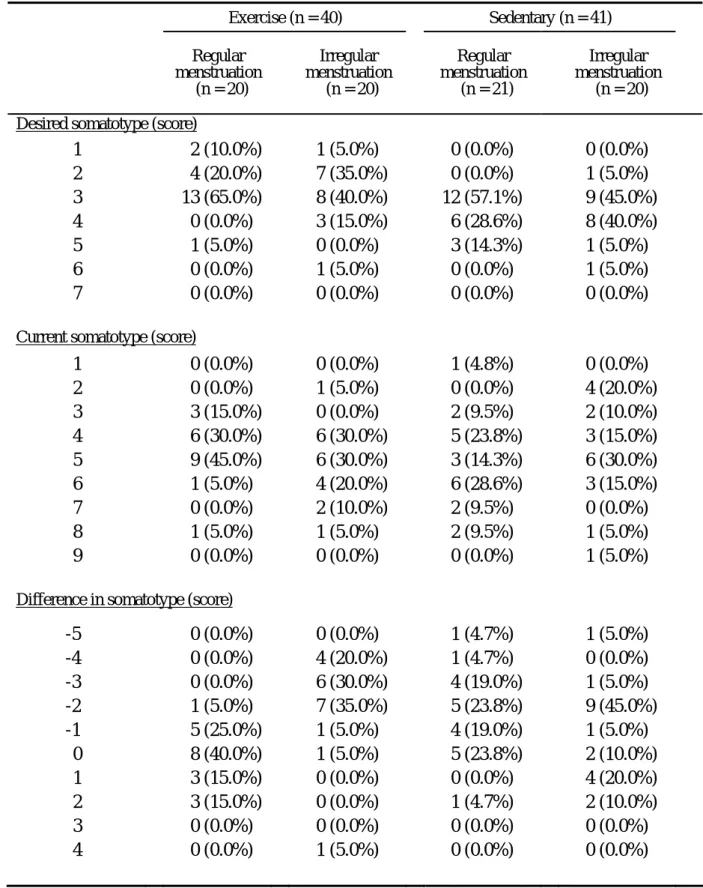
表 4.4.3 各組受試者自我體型(somatotype)認知之分布1 Table 4.4.3 Self-perceived body image (somatotype) of the subjects1
1Difference = Desired – Current.
Exercise (n = 40) Sedentary (n = 41) Regular
menstruation (n = 20)
Irregular menstruation
(n = 20)
Regular menstruation
(n = 21)
Irregular menstruation
(n = 20) Desired somatotype (score)
1 2 3 4 5 6 7
2 (10.0%) 4 (20.0%) 13 (65.0%) 0 (0.0%) 1 (5.0%) 0 (0.0%) 0 (0.0%)
1 (5.0%) 7 (35.0%) 8 (40.0%) 3 (15.0%) 0 (0.0%) 1 (5.0%) 0 (0.0%)
0 (0.0%) 0 (0.0%) 12 (57.1%)
6 (28.6%) 3 (14.3%) 0 (0.0%) 0 (0.0%)
0 (0.0%)
1 (5.0%) 9 (45.0%) 8 (40.0%) 1 (5.0%) 1 (5.0%) 0 (0.0%)
Current somatotype (score)
1
2 3 4 5 6 7 8 9
0 (0.0%) 0 (0.0%) 3 (15.0%) 6 (30.0%) 9 (45.0%) 1 (5.0%) 0 (0.0%) 1 (5.0%) 0 (0.0%)
0 (0.0%) 1 (5.0%) 0 (0.0%) 6 (30.0%) 6 (30.0%) 4 (20.0%) 2 (10.0%) 1 (5.0%) 0 (0.0%)
1 (4.8%) 0 (0.0%) 2 (9.5%) 5 (23.8%) 3 (14.3%) 6 (28.6%) 2 (9.5%) 2 (9.5%) 0 (0.0%)
0 (0.0%)
4 (20.0%) 2 (10.0%) 3 (15.0%) 6 (30.0%) 3 (15.0%) 0 (0.0%) 1 (5.0%) 1 (5.0%)
Difference in somatotype (score)
.-5
.-4 .-3 .-2 .-1 0 1 2 3 4
0 (0.0%) 0 (0.0%) 0 (0.0%) 1 (5.0%) 5 (25.0%) 8 (40.0%) 3 (15.0%) 3 (15.0%) 0 (0.0%) 0 (0.0%)
0 (0.0%) 4 (20.0%) 6 (30.0%) 7 (35.0%) 1 (5.0%) 1 (5.0%) 0 (0.0%) 0 (0.0%) 0 (0.0%) 1 (5.0%)
1 (4.7%) 1 (4.7%) 4 (19.0%) 5 (23.8%) 4 (19.0%) 5 (23.8%) 0 (0.0%) 1 (4.7%) 0 (0.0%) 0 (0.0%)
1 (5.0%)
0 (0.0%)
1 (5.0%)
9 (45.0%)
1 (5.0%)
2 (10.0%)
4 (20.0%)
2 (10.0%)
0 (0.0%)
0 (0.0%)
表 4.4.4 各組受試者自我體型(BMI)認知之分布1 Table 4.4.4 Self-perceived body image (BMI) of the subjects1
1Difference = Desired – Current. BMI, body mass index.
Exercise (n = 40) Sedentary (n = 41) Regular
menstruation (n = 20)
Irregular menstruation
(n = 20)
Regular menstruation
(n = 21)
Irregular menstruation
(n = 20) Desired BMI (kg/m2)
15.5 ~ 16.4 16.5 ~ 17.4 17.5 ~ 18.4 18.5 ~ 19.4 19.5 ~ 20.4 20.5 ~ 21.4 21.5 ~ 22.4
2 (10.0%) 5 (25.0%) 8 (40.0%) 1 (5.0%) 2 (10.0%) 2 (10.0%) 0 (0.0%)
2 (10.0%) 2 (10.0%) 10 (50.0%) 3 (15.0%) 2 (10.0%) 1 (5.0%) 0 (0.0%)
1 (4.8%) 5 (23.8%) 9 (42.9%) 3 (14.3%) 3 (14.3%) 0 (0.0%) 0 (0.0%)
1 (5.0%) 6 (30.0%) 7 (35.0%) 2 (10.0%) 3 (15.0%) 0 (0.0%) 1 (5.0%)
Current BMI (kg/m2)
15.5 ~ 16.4 16.5 ~ 17.4 17.5 ~ 18.4 18.5 ~ 19.4 19.5 ~ 20.4 20.5 ~ 21.4 21.5 ~ 22.4 22.5 ~ 23.4 23.5 ~ 24.4 24.5 ~
0 (0.0%) 0 (0.0%) 0 (0.0%) 6 (30.0%) 7 (35.0%) 2 (10.0%) 1 (5.0%) 2 (10.0%) 2 (10.0%) 0 (0.0%)
0 (0.0%) 1 (5.0%) 1 (5.0%) 2 (10.0%) 5 (25.0%) 4 (20.0%) 5 (25.0%) 1 (5.0%) 0 (0.0%) 1 (5.0%)
1 (4.8%) 0 (0.0%) 2 (9.5%) 4 (19.0%) 2 (9.5%) 4 (19.0%) 3 (14.3%) 1 (4.8%) 3 (14.3%) 1 (4.8%)
2 (10.0%) 3 (15.0%) 2 (10.0%) 3 (15.0%) 4 (20.0%) 2 (10.0%) 2 (10.0%) 0 (0.0%) 0 (0.0%) 2 (10.0%)
Difference in BMI (kg/m2)
-4.6 ~ -3.6 ~ -4.5 -2.6 ~ -3.5 -1.6 ~ -2.5 -0.6 ~ -1.5 -0.5 ~ -0.5 -0.6 ~ .1.5 -1.6 ~ .2.5 -2.6 ~ .3.5 -3.6 ~ .4.5
2 (10.0%) 4 (20.0%) 3 (15.0%) 6 (30%) 4 (20.0%) 1 (5.0%) 0 (0.0%) 0 (0.0%) 0 (0.0%) 0 (0.0%)
3 (15.0%) 3 (15.0%) 5 (25.0%) 5 (25.0%) 2 (10.0%) 1 (5.0%) 0 (0.0%) 0 (0.0%) 1 (5.0%) 0 (0.0%)
5 (23.8%) 1 (4.8%) 4 (19.0%) 5 (23.8%) 5 (23.8%) 1 (4.8%) 1 (4.8%) 0 (0.0%) 0 (0.0%) 0 (0.0%)
1 (5.0%)
2 (10%)
2 (10.0%)
4 (20.0%)
4 (20.0%)
3 (15.0%)
1 (5.0%)
2 (10.0%)
1 (5.0%)
0 (0.0%)
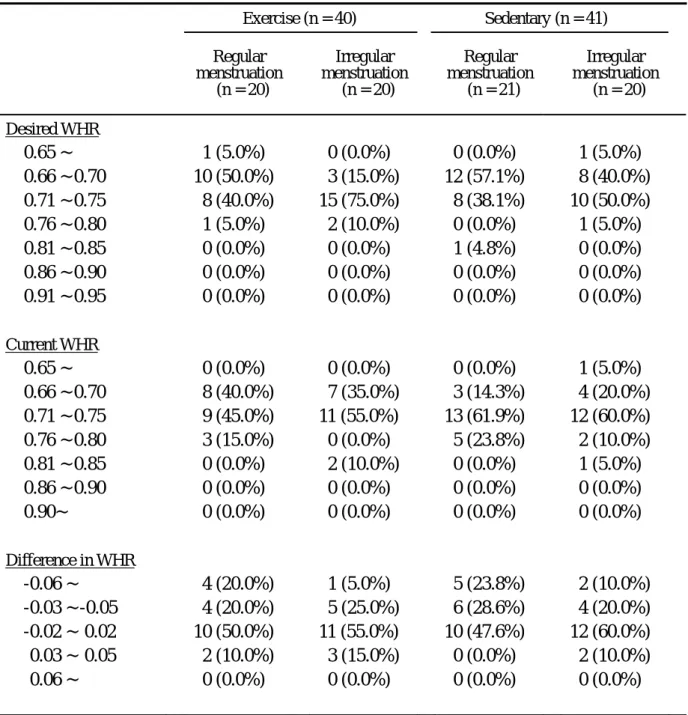
表 4.4.5 各組受試者自我體型(WHR)認知之分布1 Table 4.4.5 Self-perceived body image (WHR) of the subjects1
1Difference = Desired – Current. WHR, waist to hip ratio.
Exercise (n = 40) Sedentary (n = 41) Regular
menstruation (n = 20)
Irregular menstruation
(n = 20)
Regular menstruation
(n = 21)
Irregular menstruation
(n = 20) Desired WHR
0.65 ~ 0.66 ~ 0.70 0.71 ~ 0.75 0.76 ~ 0.80 0.81 ~ 0.85 0.86 ~ 0.90 0.91 ~ 0.95
1 (5.0%) 10 (50.0%)
8 (40.0%) 1 (5.0%) 0 (0.0%) 0 (0.0%) 0 (0.0%)
0 (0.0%) 3 (15.0%) 15 (75.0%) 2 (10.0%) 0 (0.0%) 0 (0.0%) 0 (0.0%)
0 (0.0%) 12 (57.1%)
8 (38.1%) 0 (0.0%) 1 (4.8%) 0 (0.0%) 0 (0.0%)
1 (5.0%) 8 (40.0%) 10 (50.0%) 1 (5.0%) 0 (0.0%) 0 (0.0%) 0 (0.0%)
Current WHR
0.65 ~ 0.66 ~ 0.70 0.71 ~ 0.75 0.76 ~ 0.80 0.81 ~ 0.85 0.86 ~ 0.90 0.90~
0 (0.0%) 8 (40.0%) 9 (45.0%) 3 (15.0%) 0 (0.0%) 0 (0.0%) 0 (0.0%)
0 (0.0%) 7 (35.0%) 11 (55.0%) 0 (0.0%) 2 (10.0%) 0 (0.0%) 0 (0.0%)
0 (0.0%) 3 (14.3%) 13 (61.9%) 5 (23.8%) 0 (0.0%) 0 (0.0%) 0 (0.0%)
1 (5.0%) 4 (20.0%) 12 (60.0%) 2 (10.0%) 1 (5.0%) 0 (0.0%) 0 (0.0%)
Difference in WHR
-0.06 ~
-0.03 ~ -0.05 -0.02 ~ .0.02 -0.03 ~ .0.05 -0.06 ~
4 (20.0%) 4 (20.0%) 10 (50.0%) 2 (10.0%) 0 (0.0%)
1 (5.0%) 5 (25.0%) 11 (55.0%) 3 (15.0%) 0 (0.0%)
5 (23.8%) 6 (28.6%) 10 (47.6%) 0 (0.0%) 0 (0.0%)
2 (10.0%)
4 (20.0%)
12 (60.0%)
2 (10.0%)
0 (0.0%)
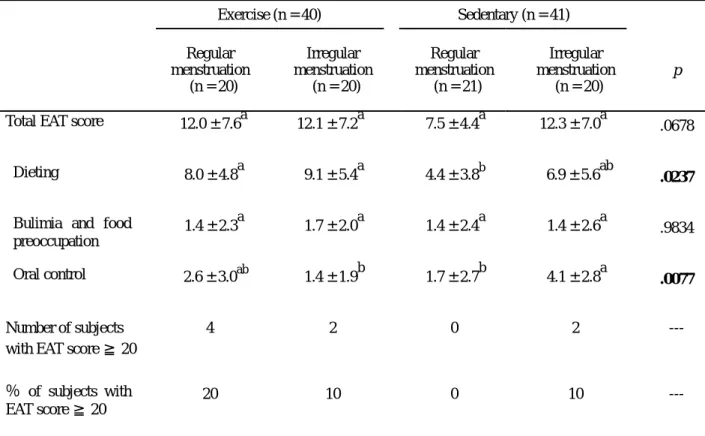
表 4.5.1 運動訓練與月經週期規律性對受試者飲食態度之主要效果及交互作用效果分析1 Table 4.5.1 Eating Attitudes Test of the subjects, analyzed by two-way ANOVA1
Total EAT score Dieting Bulimia and food preoccupation
Oral control
Exercise status .1611 .0102 .8315 .1238
Menstrual status .1025 .1172 .8315 .3140
Interaction .1172 .5332 .7890 .0030
1p-values of main effect.
表 4.5.2 各組受試者之飲食態度1
Table 4.5.2 Eating Attitudes Test of the subjects, analyzed by one-way ANOVA1
1Values are mean ± S.D.. Values with same superscripts are not significantly different (p<.05).
Exercise (n = 40) Sedentary (n = 41) Regular
menstruation (n = 20)
Irregular menstruation
(n = 20)
Regular menstruation
(n = 21)
Irregular menstruation
(n = 20)
p
Total EAT score 12.0 ± 7.6a . 12.1 ± 7.2a 7.5 ± 4.4a 12.3 ± 7.0a .0678
Dieting ..8.0 ± 4.8a ..9.1 ± 5.4a 4.4 ± 3.8b . 6.9 ± 5.6ab .0237
Bulimia and food preoccupation
. 1.4 ± 2.3a ..1.7 ± 2.0a 1.4 ± 2.4a ..1.4 ± 2.6a .9834
Oral control . .2.6 ± 3.0ab ..1.4 ± 1.9b . ..1.7 ± 2.7b 4.1 ± 2.8a .0077
Number of subjects with EAT score ≧ 20
4 2 0 2 ---
% of subjects with EAT score ≧ 20
20 10 0 10 ---
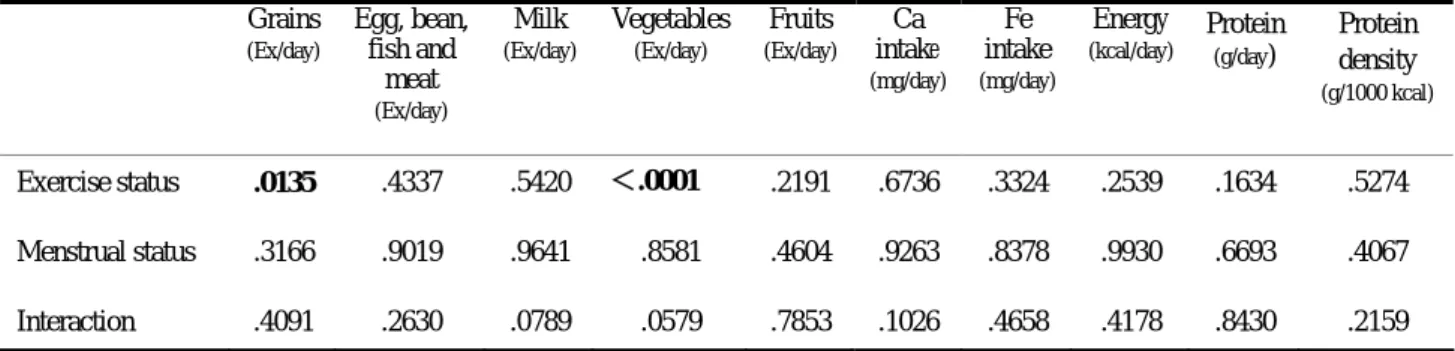
表 4.6.1 運動訓練與月經週期規律性對受試者食物攝取調查之主要效果及交互作用效果分析1 Table 4.6.1Dietary survey of the subjects, analyzed by two-way ANOVA1
Grains
(Ex/day)
Egg, bean, fish and
meat
(Ex/day)
Milk
(Ex/day)
Vegetables
(Ex/day)
Fruits
(Ex/day)
Ca intake
(mg/day)
Fe intake
(mg/day)
Energy
(kcal/day)
Protein
(g/day)
Protein density
(g/1000 kcal)
Exercise status .0135 .4337 .5420 <.0001 .2191 .6736 .3324 .2539 .1634 .5274 Menstrual status .3166 .9019 .9641 .8581 .4604 .9263 .8378 .9930 .6693 .4067
Interaction .4091 .2630 .0789 .0579 .7853 .1026 .4658 .4178 .8430 .2159
1p-values of main effect. Ex, exchange.
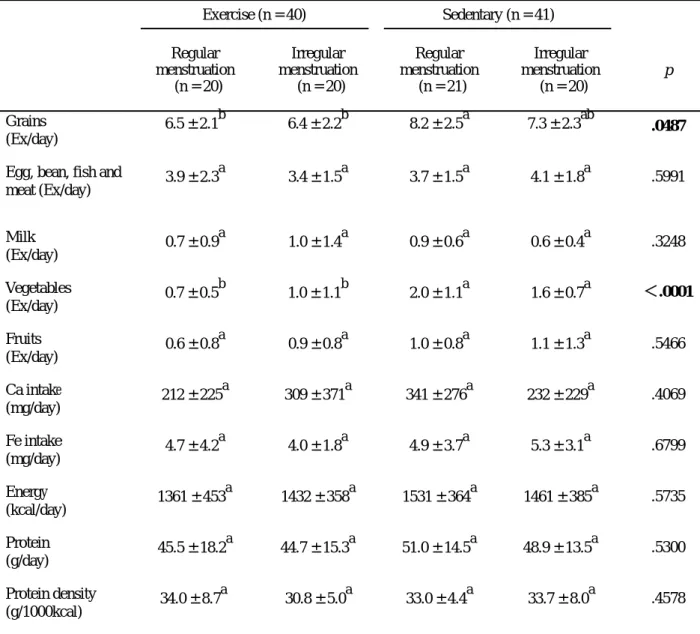
表 4.6.2 各組受試者之食物攝取調查1
Table 4.6.2 Dietary survey of the subjects, analyzed by one-way ANOVA1
1Values are mean ± S.D.. Values with same superscripts are not significantly different (p<.05). Ex, exchange.
Exercise (n = 40) Sedentary (n = 41) Regular
menstruation (n = 20)
Irregular menstruation
(n = 20)
Regular menstruation
(n = 21)
Irregular menstruation
(n = 20)
p
Grains (Ex/day)
6.5 ± 2.1b 6.4 ± 2.2b 8.2 ± 2.5a 7.3 ± 2.3ab .0487
Egg, bean, fish and
meat (Ex/day) 3.9 ± 2.3a 3.4 ± 1.5a 3.7 ± 1.5a 4.1 ± 1.8a .5991
Milk
(Ex/day) 0.7 ± 0.9a 1.0 ± 1.4a 0.9 ± 0.6a 0.6 ± 0.4a .3248 Vegetables
(Ex/day) 0.7 ± 0.5b 1.0 ± 1.1b 2.0 ± 1.1a 1.6 ± 0.7a <.0001 Fruits
(Ex/day) 0.6 ± 0.8a 0.9 ± 0.8a 1.0 ± 0.8a 1.1 ± 1.3a .5466 Ca intake
(mg/day) 212 ± 225a 309 ± 371a 341 ± 276a 232 ± 229a .4069 Fe intake
(mg/day) 4.7 ± 4.2a 4.0 ± 1.8a 4.9 ± 3.7a 5.3 ± 3.1a .6799 Energy
(kcal/day) ..1361 ± 453a ..1432 ± 358a ..1531 ± 364a ..1461 ± 385a .5735 Protein
(g/day) 45.5 ± 18.2a 44.7 ± 15.3a 51.0 ± 14.5a 48.9 ± 13.5a .5300 Protein density
(g/1000kcal) .34.0 ± 8.7a ...30.8 ± 5.0a ...33.0 ± 4.4a .33.7 ± 8.0a .4578
表 4.6.3 運動訓練與月經週期規律性對受試者熱量分配調查之主要效果及交互作用效果分析1 Table 4.6.3Energy intake survey of the subjects, analyzed by two-way ANOVA1
Breakfast
(times/week)
Lunch and Supper
(times/week)
Snack
(times/week)
Late snack
(times/week)
Drinks
(times/week)
Drinks
(Ex/day)
Exercise status .0553 .0019 .0098 .7257 .1547 .0143
Menstrual status .2719 .6141 .7510 .0662 .5746 .5835
Interaction .4059 .5088 .1627 .4789 .2380 .1926
Meal
(kcal/day)
Snack
(kcal/day)
Late snack
(kcal/day)
Drinks
(kcal/day)
Meal
(%)
Snack
(%)
Late snack
(%)
Drinks
(%)
Exercise status .0029 .0191 .8312 .0515 .0002 .0030 .7602 .0013 Menstrual status .6702 .1909 .2564 .7268 .4119 .1703 .2129 .5061
Interaction .1387 .7875 .2056 .1974 .6827 .7374 .3598 .1507
1p-values of main effect. Snack: consumed before supper, in addition to regular meals. Late snack: consumed after supper and before sleep.
表 4.6.4 各組受試者之熱量分配調查1
Table 4.6.4 Energy intake survey of the subjects, analyzed by one-way ANOVA1
1Values are mean ± S.D.. Values with same superscripts are not significantly different (p<.05). Snack:
consumed before supper, in addition to regular meals. Late snack: consumed after supper and before sleep.
Ex, exchange.
Exercise (n = 40) Sedentary (n = 41) Regular
menstruation (n = 20)
Irregular menstruation
(n = 20)
Regular menstruation
(n = 21)
Irregular menstruation
(n = 20)
p
Consumption frequency (times/week)
Breakfast 6.1 ± 1.2a 5.4 ± 1.6a 5.0 ± 2.0a 5.0 ± 1.5a .1380 Lunch and Supper ..10.2 ± 3.4b ..10.3 ± 3.3b ..12.6 ± 1.9a 11.9 ± 2.6ab .0147 Snack 5.1 ± 2.6a 4.5 ± 2.6a 2.8 ± 2.2b .3.8 ± 2.8ab .0243 Late snack 1.2 ± 1.7a 2.3 ± 1.7a 1.6 ± 1.9a 2.1 ± 2.1a .2632 Drinks 8.9 ± 6.7a 6.4 ± 4.4a 5.2 ± 5.2a 6.1 ± 8.5a .2913
Energy source Drinks
(Ex/day) 2.7 ± 1.9a ..1.9 ± 1.3ab 1.2 ± 1.5b 1.5 ± 2.2b .0466 Meal
(kcal/day) 973 ± 295b .1051 ± 387b 1305 ± 371a 1165 ± 225ab .0104 Snack
(kcal/day) 149 ± 130a ...175 ± 94a 84 ± 85a 123 ± 124a .0618 Late snack
(kcal/day) 23 ± 35a 48 ± 40a 39 ± 52a 37 ± 53a .4054
Drinks
(kcal/day) 215 ± 160a 159 ± 109a 103 ± 117a 136 ± 206a .1333 Energy distribution (%)
Meal (%) 73.2 ± 12.2b 72.1 ± 13.5b 84.6 ± 9.8a 81.3 ± 12.2a .0023 Snack (%) 10.4 ± 7.1ab . 13.1 ± 8.5a 6.0 ± 6.5b 7.7 ± 6.6b .0130 Late snack (%) 1.6 ± 2.5a 3.5 ± 3.1a 2.7 ± 4.1a 3.0 ± 5.4a .4814 Drinks (%) 14.8 ± 8.3a 11.3 ± 7.1ab 6.8 ± 6.3b 8.1 ± 8.3b .0051
表 4.7.1 運動訓練與月經週期規律性對受試者身體組成之主要效果及交互作用效果分析1 Table 4.7.1 Body composition of the subjects, analyzed by two-way ANOVA1
BMI (kg/m2)
WHR TSF
(mm)
Fat Mass
(kg) FFM
(kg) TBW
(kg) BM (kg)
Fat mass (%)
FFM (%)
Muscle mass (%)
TBW (%)
BM (%)
DBUA (dB/MHz)
NDBUA
(dB/MHz)
Exercise status
.4667 .7784 .0923 .3202 .0077 .0078 .0081 .0900 .0887 .0733 .0797 .6224 .0097 .0005
Menstrual status
.3866 .9293 .2502 .4381 .9268 .9307 .9149 .3222 .2918 .3551 .3582 .6224 .7349 .7427
Interaction .2861 .2660 .9812 .8633 .2773 .2700 .2722 .9528 .9225 .8956 .9126 .3521 .2616 .0382
1p-values of main effect. BMI, body mass index; WHR, waist to hip ratio; TSF, triceps skinfold thickness; FFM, fat –free mass; TBW, total body water; BM, bone mass; DBUA, dominant calcaneus broadband ultrasound attenuation; NDBUA, non-dominant calcaneus broadband ultrasound attenuation; dB/MHz, decibels/megahertz.
表 4.7.2 各組受試者之身體組成分析1
Table 4.7.2 Body composition of the subjects, analyzed by one-way ANOVA1
1Values are mean ± S.D.. Values with same superscripts are not significantly different (p<.05). BMI, body mass index; WHR, waist to hip ratio; TSF, triceps skinfold thickness; FFM, fat –free mass; TBW, total body water;
BM, bone mass; DBUA, dominant calcaneus broadband ultrasound attenuation; NDBUA, non-dominant calcaneus broadband ultrasound attenuation; dB/MHz, decibels/megahertz.
Exercise (n = 40) Sedentary (n = 41) Regular
menstruation (n = 20)
Irregular menstruation
(n = 20)
Regular menstruation
(n = 21)
Irregular menstruation
(n = 20)
p
BMI (kg/m2) 20.6.±.1.7a 0 20.8.±.1.8a 0 20.8.±.2.3a 0 19.8.±.3.2a 0 .4824
WHR 0.72.±.0.03a 0.73.±.0.04a 0.73.±.0.03a 0.72.±.0.04a .7170
TSF(mm) ..18.7.±.2.4a ..17.8.±.3.2a ..20.0.±.3.3a .19.2.±.4.6a .2400
Fat mass (kg) .12.8.±.3.2a 0 12.3.±.3.6a 0 14.0.±.4.3a 0 13.1.±.5.9a 0 .6462
FFM (kg) ..40.9.±.3.8ab 0
41.8.±.4.1a 0 39.5.±.3.6ab 0
38.4.±.4.3b 0 .0416
TBW (kg) .28.3.±.2.7ab 0 28.9.±.2.9a 0 27.3.±.2.5ab 0
26.5.±.3.0b 0 .0414
BM (kg) .2.36.±.0.17ab 2.40.±.0.18a .2.29.±.0.16ab 2.25.±.0.19b .0426
Fat mass (%) 23.7.±.3.7a 0 .22.4.±.4.8a 0 25.6.±.5.5a 0 24.5.±.7.0a 0 .2716
FFM (%) 76.43±.3.9a 0 77.7.±.4.8a 0 74.3.±.5.5a 0 75.5.±.7.1a 0 .2545
Muscle mass (%) 72.0.±.3.6a 0 73.2.±.4.6a 0 70.0.±.5.1a 0 71.0.±.6.5a 0 .2480
TBW (%) 52.8.±.2.6a 0 53.6.±.3.3a 0 51.3.±.3.8a 0 52.1.±.4.8a 0 .2639
BM (%) 4.4.±.0.5a 4.4.±.0.5a 4.2.±.0.4a 4.4.±.0.6a .7077
DBUA (dB/MHz) 90.1.±.12.3a 92.6.±.17.5a .85.1.±.11.4ab 80.4.±.16.3b .0466
NDBUA (dB/MHz) 86.8.±.11.6ab 94.0.±.14.5a .82.4.±.12.8bc 77.2.±.13.6c .0012
表 4.8 各組受試者之維生素 D 受器基因型頻度1
Table 4.8 Vitamin D receptor gene polymorphism frequencies of the subjects1
1Vitamin D receptor gene polymorphism is defined by BsmI. The presence of a restriction site at the VDR gene locus was specified as“b”, whereas absence of this site was“B”.
Exercise (n = 40) Sedentary (n = 41) Total (n = 81) Regular
menstruation (n = 20)
Irregular menstruation
(n = 20)
Regular menstruation
(n = 21)
Irregular menstruation
(n = 20) Number of subjects
with
BB
genotype1 (5.0%) 1 (5.0%) 1 (4.8%) 1 (5.0%) 4 (4.9%)
Number of subjects with
Bb
genotype1 (5.0%) 0 (0.0%) 0 (0.0%) 0 (0.0%) 1 (1.2%)
Number of subjects with
bb
genotype18 (90.0%) 19 (95.0%) 20 (95.2%) 19 (95.0%) 76 (93.8%)
表 4.9.1 運動訓練與月經週期規律性對受試者尿液分析之主要效果及交互作用效果分析1 Table 4.9.1Urinary analysis of the subjects, analyzed by two-way ANOVA1
HP/Crt
(µmole/mg) 3-MH/Crt
(µmole/mg) Ca/Crt
(µg/mg) pH
Exercise status 0.7685 0.7729 0.9630 0.7534 Menstrual status 0.9303 0.1125 0.2329 0.1020
Interaction 0.5248 0.7123 0.9506 0.4366
1p-values of main effect. HP, hydroxyproline; Crt, creatinine; 3-MH, 3-methylhistidine.
表 4.9.2 各組受試者之尿液分析1
Table 4.9.2 Urinary analysis of the subjects, analyzed by one-way ANOVA1
1Values are mean ± S.D.. Values with same superscripts are not significantly different (p<.05). HP, hydroxyproline; Crt, creatinine; 3-MH, 3-methylhistidine.
Exercise (n = 40) Sedentary (n = 41) Regular
menstruation (n = 20)
Irregular menstruation
(n = 20)
Regular menstruation
(n = 21)
Irregular menstruation
(n = 20)
p
HP/Crt
(µmole/mg) 0.080 ± 0.043a 0.073 ± 0.033a 0.076 ± 0.040a 0.082 ± 0.054a .9190 3-MH/Crt
(µmole/mg) 0.152 ± 0.107a 0.129 ± 0.049a 0.164 ± 0.090a 0.128 ± 0.078a .4244 Ca/Crt
(µg/mg) 69.1 ± 41.1a 57.7 ± 41.3a 69.2 ± 51.7a 56.6 ± 44.7a .6943
pH value 5.93 ± 0.40a 6.29 ± 0.89a 6.00 ± 0.46a 6.13 ± 0.74a .3376
表 4.10.1 運動組體型意識、熱量攝取與身體組成之相關分析1
Table 4.10.1 Correlations among body image, dietary intake and body composition of the exercise group1 Desired
somatotype
Current somatotype
Difference somatotype
Energy (kcal/day)
Weight (kg)
BMI (kg/m2)
WHR TSF (mm)
FM (kg)
FM (%)
Desired --- .134 .527*** .003 .246 .023 .042 -.121 .068 -.083 Current --- --- -.772*** -.011 .563*** .552*** .331* .373* .520*** .368*
Difference --- --- --- .012 -.325* -.459** -.257 -.397* -.403* -.369*
Energy (kcal/day) --- --- --- --- .147 .164 .115 .169 .170 .162 Weight (kg) --- --- --- --- --- .796*** .417** .527*** .824*** .545***
BMI (kg/m2) --- --- --- --- --- --- .510*** .863*** .943*** .849***
WHR --- --- --- --- --- --- --- .306 .405** .285
TSF (mm) --- --- --- --- --- --- --- --- .905*** .978***
FM (kg) --- --- --- --- --- --- --- --- --- .918***
1Difference = Desired – Current. BMI, body mass index; WHR, waist to hip ratio; TSF, triceps skinfold thickness; FM, fat mass (N = 40).
*p<.05, **p<.01, ***p<.001.
表 4.10.2 靜態組體型意識、熱量攝取與身體組成之相關分析1
Table 4.10.2 Correlations among body image, dietary intake and body composition of the sedentary group1 Desired
somatotype
Current somatotype
Difference somatotype
Energy (kcal/day)
Weight (kg)
BMI (kg/m2)
WHR TSF (mm)
FM (kg)
FM (%)
Desired --- .329* .101 .218 .131 .192 .120 .193 .189 .192 Current --- --- -.906*** .134 .823*** .887*** .429** .838*** .857*** .816***
Difference --- --- --- -.044 -.808*** -.849*** -.398** -.796*** -.819*** -.773***
Energy (kcal/day) --- --- --- --- .142 .119 .013 .025 .043 -.024 Weight (kg) --- --- --- --- --- .908*** .345* .807*** .907*** .749***
BMI (kg/m2) --- --- --- --- --- --- .472** .929*** .945*** .867***
WHR --- --- --- --- --- --- --- .389* .375* .335*
TSF (mm) --- --- --- --- --- --- --- --- .975*** .973***
FM (kg) --- --- --- --- --- --- --- --- --- .944***
1Difference = Desired – Current. BMI, body mass index; WHR, waist to hip ratio; TSF, triceps skinfold thickness; FM, fat mass (N = 41).
*p<.05, **p<.01, ***p<.001.
表 4.11.1 運動組骨量、骨質與運動習慣、飲食攝取、身體組成之相關分析1
Table 4.11.1 Correlations among bone mass, calcaneus broadband ultrasound attenuation, exercise status, dietary intake and body composition of the exercise group1 BM
(kg)
DBUA
(dB/MHz)
NDBUA
(dB/MHz)
Exercise frequency
(times/week)
Exercise time
(hours/week)
Exercise duration
(years)
Weight
(kg)
BMI
(kg/m2)
Estradiol
(pg/ml)
Ca intake
(mg/day)
Milk
(Ex/day)
HP/Crt
(µmole/mg)
Ca/Crt
(µmole/mg)
BM
(kg)
--- .250 .182 -.062 -.026 .296 .875*** .450** -.020 .156 .153 -.024 .049
DBUA
(dB/MHz)
--- --- .780*** -.116 -.070 -.025 .133 -.070 .015 -.028 -.003 -.202 .068
NDBUA
(dB/MHz)
--- --- --- -.248 -.248 -.040 .135 .037 -.215 .226 .197 -.128 .005
1BM, bone mass; DBUA, dominant calcaneus broadband ultrasound attenuation; NDBUA, non-dominant calcaneus broadband ultrasound attenuation; dB/MHz, decibels/megahertz; BMI, body mass index; Ex, exchange; HP, hydroxyproline; Crt, creatinine (N = 40).
*p<.05, **p<.01, ***p<.001.
表 4.11.2 靜態組骨量、骨質與運動習慣、飲食攝取、身體組成之相關分析1
Table 4.11.2 Correlations among bone mass, calcaneus broadband ultrasound attenuation, exercise status, dietary intake and body composition of the sedentary group1 BM
(kg)
DBUA
(dB/MHz)
NDBUA
(dB/MHz)
Exercise frequency
(times/week)
Exercise time
(hours/week)
Exercise duration
(years)
Weight
(kg)
BMI
(kg/m2)
Estradiol
(pg/ml)
Ca intake
(mg/day)
Milk
(Ex/day)
HP/Crt
(µmole/mg)
Ca/Crt
(µmole/mg)
BM
(kg)
--- .282 .388 .199 .243 .263 .835*** .599*** -.056 .270 .098 .034 .026
DBUA
(dB/MHz)
--- --- .762*** .270 .307 .254 .278 .257 .020 .116 .225 .242 .280
NDBUA
(dB/MHz)
--- --- --- .086 .126 .089 .352* .285 .003 -.007 .182 .110 .092
1BM, bone mass; DBUA, dominant calcaneus broadband ultrasound attenuation; NDBUA, non-dominant calcaneus broadband ultrasound attenuation; dB/MHz, decibels/megahertz; BMI, body mass index; Ex, exchange; HP, hydroxyproline; Crt, creatinine (N = 41).
*p<.05, **p<.01, ***p<.001.
表 4.11.3 受試者骨量、骨質與運動習慣、飲食攝取、身體組成之相關分析1
Table 4.11.3 Correlations among bone mass, calcaneus broadband ultrasound attenuation, exercise status, dietary intake and body composition of the subjects1 BM
(kg)
DBUA
(dB/MHz)
NDBUA
(dB/MHz)
Exercise frequency
(times/week)
Exercise time
(hours/week)
Exercise duration
(years)
Weight
(kg)
BMI
(kg/m2)
Estradiol
(pg/ml)
Ca intake
(mg/day)
Milk
(Ex/day)
HP/Crt
(µmole/mg)
Ca/Crt
(µmole/mg)
BM
(kg)
--- .327** .362*** .254* .269* .383*** .834*** .528*** -.002 .184 .140 -.001 .036
DBUA
(dB/MHz)
--- --- .792*** .246* .252* .257* .229* .143 .046 .020 .078 .028 .173
NDBUA
(dB/MHz)
--- --- --- .216* .263* .299** .273* .203 -.073 .092 .191 -.008 .050
1BM, bone mass; DBUA, dominant calcaneus broadband ultrasound attenuation; NDBUA, non-dominant calcaneus broadband ultrasound attenuation; dB/MHz, decibels/megahertz; BMI, body mass index; Ex, exchange; HP, hydroxyproline; Crt, creatinine (N = 81).
*p<.05, **p<.01, ***p<.001.
表 4.12 各組受試者初經年齡與骨量、骨質、身體組成之相關分析1
Table 4.12 Correlations among age at menarche, bone mass, calcaneus broadband ultrasound attenuation and body composition of the subjects1
BMI (kg/m2)
Fat mass (kg)
Fat mass (%)
BM (kg)
DBUA (dB/MHz)
NDBUA (dB/MHz)
Regular menstruation exercise group (n = 20)
Age at menarche (years) -.235 -.245 -.208 -.148 .340 .249 Estradiol duration (years) .061 .086 .232 -.250 -.315 -.070
Irregular menstruation exercise group (n = 20)
Age at menarche (years) .080 .036 -.026 .299 -.146 -.349 Estradiol duration (years) -.090 -.095 -.263 .203 .387 .586**
Regular menstruation sedentary group (n = 21)
Age at menarche (years) -.634** -.607** -.521* -.512* .338 .110 Estradiol duration (years) .485* .437* .386 .409 -.339 -.010
Irregular menstruation sedentary group (n = 20)
Age at menarche (years) -.112 -.095 -.245 .377 .210 .301 Estradiol duration (years) .100 .192 .346 -.202 -.058 -.231
1BMI, body mass index; BM, bone mass; DBUA, dominant calcaneus broadband ultrasound attenuation;
NDBUA, non-dominant calcaneus broadband ultrasound attenuation; dB/MHz, decibels/megahertz.
*p<.05, **p<.01.
圖4.1 運動組之初經年齡分布
0
4.8 26.3
14.3 21.1
47.6
21.1 23.8
5.3
9.5 26.3
0
0 10 20 30 40 50 60
初經來潮前訓練組 初經來潮後訓練組
百分比
10歲 11歲 12歲 13歲 14歲 15歲
圖4.2 運動組之經期狀況
42
58 55
45
0 10 20 30 40 50 60 70
初經來潮前訓練組 初經來潮後訓練組
百分比
經期規 律者
經期不 規律者
(n = 19) (n = 21)
(n = 19) (n = 21)
圖4.3 受試者最常食用之烹調方式
30 30
19
30 27.2
25 35
40
52.4 55
45.7
10
0
21 15
28.6
15
0 15
6.2
0 10 20 30 40 50 60 70
經期規律 運動組
經期不規律 運動組
經期規律 靜態組
經期不規律 靜態組
全體 百分比
蒸、煮 滷、燉 炒、煎 油炸
圖4.4 受試者雞鴨魚皮之攝食調查
55
42.9
56.8
0
5 15
5 10 8.6
0 0
20
25
38.1
25 27.2
65 65
9.5
5 5
9.5
5
0 2.5
0 10 20 30 40 50 60 70
經期規律 運動組
經期不規律 運動組
經期規律 靜態組
經期不規律 靜態組
全體 百分比
完全 不吃 偶而 會吃 攝食 一半 通常 會吃 全吃
圖4.5 受試者食用乳品含脂量之比較
15
10
4.8
0
7.4 25
20
47.6
40
33.3
25 25
40
45
35 35.8
23.8 23.5
20
23.8
0 10 20 30 40 50 60
經期規律 運動組
經期不規律 運動組
經期規律 靜態組
經期不規律 靜態組
全體 百分比
脫脂
低脂
全脂
不攝取
圖4.6 受試者食用肉類含脂量之比較
30
20
52.4
30 75
65
60.5
4.8
5 5
0 0 2.5
33.3 42.9
60
5 3.7 0
5
0 20 40 60 80 100
經期規律 運動組
經期不規律 運動組
經期規律 靜態組
經期不規律 靜態組
全體 百分比
低脂 中脂 高脂 超高脂
圖4.7 受試者之自我認知食量
10
20
0
40 40
52.4
35
42 50
0 0
4.8
0 9.5 9.9
35
40 39.5
33.3
0
15
7.4 15
0 1.2
0 10 20 30 40 50 60 70
經期規律 運動組
經期不規律 運動組
經期規律 靜態組
經期不規律 靜態組
全體 百分比
多很多 多一些 差不多 少一些 少很多
圖4.8 受試者觀賞電視時之零食攝食狀況
65
60
85.7
75 71.6
0
4.9 15
0
4.8
0 9.5
18.5 25 25
15 15
5
0
4.9
0 20 40 60 80 100
經期規律 運動組
經期不規律 運動組
經期規律 靜態組
經期不規律 靜態組
全體 百分比
完全 不吃 偶而 會吃 攝食 一半 通常 會吃
圖4.9 受試者使用電腦時之零食攝食狀況
55
50
71.4
65
60.5
40
10 5
10 0
5
0
15
5 23.8
40
28.4
5 4.8 6.2
0 20 40 60 80 100
經期規律 運動組
經期不規律 運動組
經期規律 靜態組
經期不規律 靜態組
全體 百分比
完全 不吃 偶而 會吃 攝食 一半 通常 會吃
圖4.10 受試者營養補充劑之使用狀況
10
15
19 20
16
0
5 4.8
0 2.5
5
10
4.8
0 5
0 0
10 10
5
9.9 70
60
47.6
75
63
4.93.7 9.5
14.3
0 20 40 60 80
經期規律 運動組
經期不規律 運動組
經期規律 靜態組
經期不規律 靜態組
全體 百分比
複合維生素與礦物質 單一維生素
鈣片 中藥
其他 無
圖4.11 受試者特殊藥物之使用與自我催吐
5
10
5
0
4.9 5
10
5
0 5
0 0 2.5
10
0
5
0
75 75
85
100
84
4.9
5 3.7
0 10 20 30 40 50 60 70 80 90 100
經期規律 運動組
經期不規律 運動組
經期規律 靜 態組
經期不規律 靜態組
全體
百分比
代餐 減肥 藥 瀉藥 自我 催吐 未使 用
Fat m ass (kg)
0 5 10 15 20 25
30 Exercise group (n = 40) r = .824, p < .0001 Sedentary group (n = 41) r = .907, p < .0001
Body weight (kg)
30 40 50 60 70 80
Fat- free m ass (kg)
30 35 40 45 50
55 Exercise group (n = 40) r = .873, p < .0001 Sedentary group (n = 41) r = .838, p < .0001
圖 4.12 體重與體脂重、除脂體重之相關
Fig. 4.12 Correlation among body weight, fat mass and fat-free mass.
Regular Menstruation group (n = 41)
Broadband ultrasound attenuation (dB/MHz)
40 60 80 100 120
140 DBUA
r = .157, p = .328 NDBUA r = .115, p = .473
Irregular Menstruation group (n = 40)
Exercise duration (years)
0 2 4 6 8 10 12 14 16
Broad b and ultras oun d atten u ation (dB/MHz)
40 60 80 100 120
140 DBUA
r = .326, p = .040 NDBUA r = .431, p = .005