國立臺灣大學醫學院免疫學研究所 碩士論文
Graduate Institute of Immunology College of Medicine
National Taiwan University Master Thesis
探討腺苷酸激酶-4 在傳統活化巨噬細胞的角色 The Role of Adenylate Kinase 4 in Classically Activated
Macrophages
何季盈 Chi-Ying He
指導教授:繆希椿 博士 Advisor:Shi-Chuen Miaw, Ph.D.
中華民國 108 年 7 月
July, 2019
致謝
起初,因為一些因素而來到了免疫所這個地方,是期待也是害怕,期待著能學習 到更多免疫的實驗與相關知識,而害怕則是大家都很厲害怕跟不上進度,但隨著 老師們的教導及實驗技巧的提升,似乎也越來越享受這樣的學習氛圍。首先,很 謝謝繆希椿老師願意讓我到實驗室學習,跟老師分享及討論分析實驗結果是我收 穫最多的部分,也很謝謝老師總是關心我有沒有太晚吃飯、身體有沒有比較好(感 覺上我好像蠻麻煩的)。彰憲學長是實驗室的大忙人也是台柱,但總是被我們這群 小毛頭煩實驗上的事情,謝謝學長耐心的教我們實驗技巧及注意事項,也謝謝學 長在快要去美國的時候詳細的教我報帳的相關事項。謝謝陳名在我剛進實驗室什 麼都不太清楚時,給了我很大的幫忙。謝謝芷君學姊教我們如何產病毒,面對看 不是很懂的步驟也細心跟我們講解,甚至提供了好用的實驗技巧,真的很棒。謝 謝實驗室的好夥伴承哲及哲瑋,你們總在我心情不好時陪我聊天,也在我實驗上 需要尋求意見時給了我蠻多好的建議,讓我一一解決了實驗上的困難。謝謝我的 好學弟偉堯,雖然你常常會故意惹我生氣,但也在實驗上幫助了我很多,特別是 在接近口試的那幾天,你都會問我是否需要幫忙或是看我實驗很晚幫我收東西等 等,有這麼優秀的學弟真幸運。謝謝信翔、若寧、羽歡及榮謙,在我實驗上不清 楚或需要幫忙時你們都會跟我討論很久,提供自己的實驗經驗並建議我一些好的 實驗作法。除了實驗上的陪伴以外,私下有你們一起吃喝玩樂也算是補足我做出 糞 data 時的一個抒發。謝謝弘之提供同學讓我能練習到抽血及幫忙實驗室的運作。
謝謝奕中總是包容我的東西不時越界到你那邊,有認識一個會打網球的人真好,
歡迎你實驗之餘一起練練球呀。謝謝在研究所生涯幫助過我的每個人,因為你們 我的實驗才能順利進行。
中文摘要
巨噬細胞在先天性免疫扮演重要角色。巨噬細胞依據基因信號表達、表面受體及 分泌的細胞激素分為傳統活化巨噬細胞(M1)和替代性活化巨噬細胞(M2)兩個子集。
不同的刺激可以使骨髓源性巨噬細胞(M0)極化成為 M1 及 M2 細胞。此外,由脂多
糖及γ 型干擾素極化的 M1 巨噬細胞表達較高量的 CD80、Nos2 及 Tnfa,而由介白
素-4 和介白素-13 極化的 M2 巨噬細胞表達較高量的 CD206、Arg1 及 Egr2。代謝 對於巨噬細胞的功能及型態是重要的。相較於 M0 細胞和 M2 細胞,我們發現在粒 線體基質中負責 ATP/ADP/AMP 平衡的腺苷酸激酶-4 顯著地上調於 M1 細胞。為 了調查 Ak4 基因在 M1 細胞的角色,Ak4 基因在 M0 細胞中被小分子干擾核糖核酸
及小髮夾核醣核酸敲落並用脂多糖及γ 型干擾素刺激 M0 細胞。Ak4 基因敲落後並
不影響體外骨髓源性巨噬細胞的成熟,但 Nos2、Hif1a 及 Il1b 信使核糖核酸表達 減少。再者,iNOS 和 HIF1α 的蛋白表現量下降且 IL-1β 和 TNF-α 的細胞激素產量 變少。此外,Arg1、CD80、CD86、CD206 和 MHC II 在 Ak4 敲落的 M1 細胞及對 照組 M1 細胞並無差異。總結來說,我們假說 Ak4 基因對於 M1 巨噬細胞的功能是 重要的。
關鍵字: 核甘酸代謝、傳統活化巨噬細胞
Abstract
Macrophage has an important role in innate immunity. Macrophages are classified into two subsets, classically activated macrophages (M1) and alternatively activated macrophages (M2), based on their gene expression signatures, surface receptors, and cytokine productions. Different stimuli can skew bone marrow-derived macrophages (BMDM; M0) into M1 and M2. Furthermore, M1 macrophages skewed by LPS/IFN-γ exhibit higher expression of CD80, Nos2 and Tnfa, whereas M2 macrophages skewed by IL-4/IL-13 show higher expression of CD206, Arg1and Egr2. Metabolism is crucial for functions and phenotypes of macrophages. We found that Ak4 responsible for ATP/ADP/AMP homeostasis and located in mitochondria matrix, was significantly upregulated in M1 compared to M0 and M2. To investigate the role of Ak4 in M1, Ak4 was knockdowned by Ak4 siRNA or Ak4 shRNA treatment in M0 macrophages which were further stimulated with LPS/IFN-γ. After Ak4 knockdown (KD), BMDM maturation remained unchanged by Ak4 siRNA and Ak4 shRNA KD in vitro. The expressions of Nos2, Hif1a and Il1b mRNAs were decreased by Ak4 shRNA KD.
Moreover, protein expressions of iNOS and HIF1α were declined by Ak4 shRNA KD.
Furthermore, cytokine productions of IL-1β and TNF-α were decreased by Ak4 shRNA KD. However, the expressions of Arg1, CD80, CD86, CD206 and MHC class II were
we hypothesized that Ak4 is critical for the functions of M1 macrophages.
Key words: nucleotide metabolism, classically activated macrophage
Contents
致謝………I 中文摘要………II
Abstract………III
Contents………IV
Tables of content………... V
Figures of content………...……….. VI
Supplementary Figures of content………...…………..VII
I. Introduction………... 1
1. Macrophages………. 1
1.1 Macrophage subset, M1……….. 1
1.2 Macrophage subset, M2……….. 2
2. Metabolism in macrophages………..3
3. Adenylate kinase 4………..…..4
4. HIF-1α in macrophage metabolism and functions………... 4
5. Specific Aims………5
II. Materials and Methods……….6
1. Materials………..…6
2.1 Isolation and development of bone marrow-derived macrophage……9 2.2 Differentiation of M1 and M2 subsets in vitro………...10 2.3 Characterization of M1 and M2 macrophage by flow cytometry…... 10 2.4 Characterization of M1 and M2 macrophage by real-time PCR…….11 2.5 Small interfering RNA (siRNA) transfection………. 11 2.6 Enzyme-linked immunosorbent assay (ELISA) ……….. 12 2.7 BMDM transduction by Ak4 shRNA and scramble lentivirus………13 2.8 Statistical analysis………....13
III. Results………15
1. Bone marrow (BM) cells were able to polarize into M1 and M2 macrophages in vitro……….. 15
2. Nos2 and Tnfa were highly expressed in M1 macrophages while Arg1 and Egr2 were highly expressed in M2 macrophages…….………... 15
3. ATP level was increased by short hairpin RNA (shRNA) knockdown (KD) of Ak4 in M1 subset……….………... 16
4. Ak4 shRNA knockdown resulted in less cell numbers of BMDM but not BMDM maturation………..17 5. The expressions of Nos2, Hif1a and Il1b mRNAs were downregulated and
Cybb mRNA was upregulated in Ak4 KD M1……...……….... 17 6. Protein expressions of iNOS, HIF-1α, IL-1β and TNF-α were reduced in Ak4
shRNA KD M1 macrophages...………...18 7. Ak4 siRNA KD M1 exhibited increased ATP level and decreased ADP/ATP
ratio………..18 8. Expressions of Nos2, Cybb, Hif1a and Il1b mRNAs were reduced, but not
significant, in Ak4 siRNA KD M1 macrophage macrophages…………....18 9. The expressions of MHC class II, costimulatory molecules CD80 and CD86,
scramble siRNA M1 macrophages………...19
10. TNF-α was decreased while IL-1β was comparable in Ak4 siRNA KD M1 compared to scramble siRNA M1………...……..….19
VIII. Discussion………. 20
IX. Tables……….... 23
X. Figures……….. 25
XI. Supplementary Figures………... 45
XII. References……… 52
Tables of content
Table 1 List of primers used in quantitative real-time PCR
Figures of contents
Figure 1. The development and differentiation of BMDM Figure 2. Signature gene expressions in M1 and M2 subsets
Figure 3. ATP level was elevated by shRNA KD of Ak4 highly expressed in M1 Figure 4. Cell numbers, but not percentage of mature BMDM, were reduced by
Ak4 shRNA KD
Figure 5 Ak4 shRNA KD reduced expressions of Nos2, Hif1a and Il1b and enhanced Cybb expression in M1 macrophages
Figure 6 Protein expressions of iNOS, HIF-1α, IL-1β and TNF-α were reduced in Ak4 shRNA KD M1 macrophages
Figure 7 Elevated ATP level by Ak4 siRNA KD in M1 macrophages
Figure 8 The expressions of Nos2, Cybb, Hif1a and Il1b were reduced, but not significant, in Ak4 siRNA KD M1 macrophages compared with scramble siRNA M1 macrophages
Figure 9 The expressions of CD80, CD86, CD206 and MHC II were not influenced by Ak4 siRNA KD
Figure 10 TNF-α was declined by Ak4 siRNA KD in M1 macrophages
Supplementary Figures of contents
Supplemental Fig. S1. Gating strategy of Ak4 shRNA KD and scramble GFP+ M1 macrophages
Supplemental Fig. S2. The titration of lentiviral concentration
Supplemental Fig. S3. M1 and M2 marker expressions in Ak4 siRNA KD and scramble M1
Supplemental Fig. S4 The expressions of Nos2, Cybb, Ak4 and Il1b were decreased in Hif1a siRNA KD M1
Supplemental Fig. S5 IL-1β production was declined by Hif1a siRNA KD
I. Introduction
1. Macrophages
Macrophages were first discovered in 19th century by Ilya Metchnikoff (Cavaillon, 2011). Macrophages are myeloid cells, and perform phagocytosis of pathogens or microbes (Elhelu, 1983). Furthermore, they regulate lymphocyte activation and proliferation (Elhelu, 1983). CD11b (integrin αM), highly expressed on macrophage and monocytes, is important for their migration and function (Zheng et al., 2015). F4/80, member of the adhesion-GPCR family, is important in the development of Antigen (Ag)-specific regulatory T (Treg) cells which suppress Ag-specific immunity (van den Berg and Kraal, 2005). Both CD11b and F4/80 are the surface markers of mature bone marrow-derived macrophages (BMDM) (Ying et al., 2013). Moreover, macrophages are classified into M1 and M2 based on distinct phenotype and functions (Italiani and Boraschi, 2014).
1.1 Classically activated Macrophages (M1 macrophages)
M1 macrophages, called classically activated macrophages, are important for host defense and promote the classical T-helper 1 (Th1) polarization. M1 macrophages, induced by LPS and Th1-derived cytokine IFN-γ, produce TNF-α, IL-1, and nitric oxide synthase (NOS) in STAT1 dependent manner (Nahrendorf and Swirski, 2016).
Inducible NO synthase (iNOS) and NO, critical components of the inflammatory response, are highly generated by M1 macrophages (Gross et al., 2014). Moreover, Cd86, Cd80 and MHC2 are distinctly upregulated in M1 macrophages compared to
M2 macrophages (Gensel et al., 2017).
1.2 Alternatively activated Macrophages (M2 macrophages)
M2 macrophages, called alternatively activated macrophages, are vital for the regulation of the allergic immune responses, tissue maintenance and repair (Veremeyko et al., 2013). M2 are induced by the Th2-derived cytokines IL-4 or IL-13 and express factors such as Fizz1, Ym1, Arg1, and Mannose Receptor (MR or CD206), which are related to the anti-pathogens response and promote tissue repair (Tugal et al., 2013). Egr2 expression was the highest in M2 macrophages compared to unstimulated M0 macrophages and M1 macrophages (Jablonski et al., 2015). Arginase-1, encoded by Arg1 gene, hydrolyzes L-arginine into urea and ornithine which is precursor of L-proline and polyamines (Pourcet and Pineda-Torra, 2013). Arginase 1 competes with iNOS for the same substrate, L-arginine, to inhibit nitric oxide-mediated inflammatory pathways (Pourcet and Pineda-Torra, 2013). Early growth response protein 2 (Egr2), encoded by Egr2
gene, is a transcription regulatory factor and up-regulated in M2 macrophages rather than in M1 macrophages (Jablonski et al., 2015).
2. Metabolism in macrophages
Macrophages phagocytose and digest pathogens, and activate inflammation response, which play important role in innate immunity and adaptive immunity. Many studies show that metabolism is highly associated with macrophage function and polarization (Bosca et al., 2015; Zhu et al., 2015). For example, M1 macrophages retrieve energy from glycolysis. Therefore, their functions are affected by factors regulating glucose metabolism (Haschemi et al., 2012; Tan et al., 2015). Conversely, M2 macrophages retrieve energy from oxidative phosphorylation, and their functions are regulated by factors involved in oxidative metabolism and arginine metabolism (Geelhaar-Karsch et al., 2013). Therefore, altered metabolism may skew macrophage phenotype and responses to various stimuli. Due to great contribution of macrophages in innate immunity, macrophage metabolism becomes therapeutic target for cancer, atherosclerosis, and obesity (Geeraerts et al., 2017).
3. Adenylate kinase 4
Adenylate kinase 4, encoded by Ak4, was identified in 1992 (Xu, et al., 1992). AK4, located in mitochondria matrix, is expressed mainly in the brain, heart, kidney and liver (Noma et al., 2001). 2 ADP are generated through AMP phosphorylation from ATP by AK4 (Lanning et al., 2014). ADP/ATP translocase (ANT) is shown to shuttle ADP into mitochondria and to pump ATP out of mitochondria for adenine nucleotide homeostasis by interaction with enzymatically inactive adenylate kinase 4 (Panayiotou et al., 2010).
4. HIF-1α in macrophage metabolism and functions
HIF-1α protein is composed of four regions, transactivating region, stability determing region, HIF-1β binding region and DNA binding region (Hong et al., 2004). HIF-1α is a transcription factor, and also a metabolic regulator in macrophages. HIF-1α upregulates many proinflammtory genes to promote M1 polarization (Wang et al., 2017). HIF-1α is involved in angiogenesis, cell growth, glucose metabolism, and metastasis (Hong et al., 2004). Moreover, HIF-1α participates in bacterial killing involved in Nos2 function, migration, cytokine production such as IL-1β, and glycolysis in macrophages (Majmundar et al., 2010).
5. Specific aims
Macrophages are crucial for host defense against pathogen. Macrophage metabolism is essential for the functions and phenotypes. However, how metabolic genes affect macrophages are not well addressed. Adenylate kinase 4 (Ak4) serves as regulator for the homeostasis of cellular nucleotides, and is upregulated during LPS/IFN-γ stimulation. Therefore, the focus of this study is to investigate the Ak4 role in M1 macrophages.
II. Materials and Methods
1. Materials
Mice C57BL/6J mice (6-8 week) National Laboratory Animal Center (NLAC) Antibodies PE anti-mouse/human CD11b Antibody BioLegend, San Diego, USA
PE anti-rat IgG2b, κ Antibody BioLegend, San Diego, USA APC/Cy7 anti-mouse F4/80 Antibody BioLegend, San Diego, USA APC/Cy7 anti-rat IgG2a, κ Antibody BioLegend, San Diego, USA FITC anti-mouse CD80 Antibody BioLegend, San Diego, USA FITC anti-Armenian Hamster IgG Antibody BioLegend, San Diego, USA APC anti-mouse CD206 Antibody eBioscience, San Diego, USA APC anti-rat IgG2a, κ Antibody eBioscience, San Diego, USA Cytokines Recombinant Murine IL-4 Peprotech, Rocky Hill, USA
Recombinant Murine IL-13 Peprotech, Rocky Hill, USA Recombinant Murine IFN-γ Peprotech, Rocky Hill, USA
Lipopolysaccharide Sigma Aldrich, Saint Louis, USA Primers
(qPCR)
All primers are described in Table 1 Purgo, Taipei, Taiwan
siRNA 10 µM stock Santa Cruz Biotechnology, Texas, USA Buffers RBC lysis buffer, pH=7.2-7.4,
(ddH2O was added up to 500 mL, autoclave and store at 4℃)
0.61 g Tris-HCl (final 10 mM) 4.15 g NH4Cl (final 0.83%)
Complete DMEM medium, 1L
(Incomplete DMEM was added up to 1L)
10% FBS
10 mL L-Glutamine (200 mM, 100X) 10 mL Penicillin/ Streptomycin (100X) 10 mL Sodium pyruvate (100 mM, 100X)
10 mL NEAA (100X)
0.35 μL 2-Mercaptoethano (2-ME, 14.3 M)
Serum-free DMEM medium, 100 mL (Incomplete DMEM was added up to 100 mL)
1 mL L-Glutamine (200 mM, 100X) 1 mL Sodium pyruvate (100mM, 100X)
1 mL NEAA (100X)
100 μL 2-Mercaptoethano (2-ME, 5 mM)
FACS buffer, pH=7.2~7.4, 1L (EDTA is dissolved by NaOH, followed by adjusting pH value and 1X PBS was added up to 1L)
1 g Sodium azide 10 mL FBS
40 mL EDTA (0.05 M)
Chemicals
and
Reagents
Name Company
2-Mercaptoethano (2-ME) Sigma Aldrich, Saint Louis, USA
FBS Life Technologies,California, USA
DMEM Gibco,Waltham, USA
NA2 EDTA J.T, Baker,New Jersey, USA
NH4Cl Mallinckrodt, Dublin, Ireland
Sodium azide Sigma Aldrich, Saint Louis, USA
L-Glutamine HyClone, Texas, USA
Penicillin/Streptomycin HyClone, Texas, USA Non-essential amino acid (NEAA) HyClone, Texas, USA
Sodium pyruvate HyClone, Texas, USA
Polybrene Thermo, Massachusetts, USA
isol-RNA lysis reagent 5-PRIME, California, USA direct-zol RNA miniPrep Zymo Research, Irvine, USA Foxp3/Transcription Factor Staining Buffer Set Thermo, Massachusetts, USA TransIT-TKO® Transfection Reagent Mirus Bio, Madison, USA
2. Methods
2.1 Isolation and development of bone marrow-derived macrophage (BMDMs)
Female C57BL/6 mice at 6-8 week old were purchased from National Laboratory
Animal Center. Bone marrow cells were isolated from femur and tibia bones of mice with incomplete DMEM (Dulbecco’s modification of Eagle’s medium, Gibco) by using
23G needles, and centrifuged at 4°C with 800 xg for 5 mins. Red blood cells were lysed by 900 μL RBC lysis buffer (10 mM Tris-HCl and 0.83% NH4Cl in ddH2O, pH 7.2) for 3 mins on ice, and 100 μL 10X dPBS (Gibco) was added to cells. Cells were then centrifuged at 4°C with 800 xg for 5 mins, and re-suspended with complete DMEM containing 10% fetal bovine serum (FBS), 1X penicillin/streptomycin (HyClone), 1X
L-Glutamine (HyClone), 1X NEAA (non-essential amino acid, HyClone), 1X sodium pyruvate (HyClone) and 5 μM 2-ME (2-Mercaptoethanol, Thermo). Cells (5x10⁶) were
seeded in 10-cm2 petri dishes (α-Plus) at 37°C in 5% CO2 incubator for 7 days with 20% L929 cell supernatant in complete DMEM. The cells were stained with
PE-conjugated CD11b (Biolegend) and APC/Cy7-conjugated F4/80 (Biolegend) in 100 μL FACS buffer on ice for 30 mins in the dark, and analyzed with FACSCanto (BD)
after washed twice with FACS buffer (PBS, 1% sodium azide, 1% FBS, and 0.05 M EDTA). PE-conjugated rat IgG 2b, κ (Biolegend) and APC/Cy7-conjugated rat IgG 2a, κ (Biolegend) were used as isotype controls. Data were quantified by software FlowJo
7.6.1 (Tree Star, Oregon, USA). Concentration of all conjugated antibodies was 0.1 μg /100 μL FACS buffer.
2.2 M1 and M2 polarization in vitro
After cultured in 20% L929 cell supernatant for 7 days, bone marrow-derived macrophages (BMDMs) were collected and further seeded in 12-well and 6-well plates (Thermo) at a density of 1x10⁶/mL per well for flow cytometry and 2.5x10⁶/mL per well for real time PCR, respectively. For macrophage differentiation, BMDMs were treated with LPS (1000 ng/mL) and IFN-γ (20 ng/mL, Peprotech) for M1 polarization, IL-4 (20 ng/mL, Peprotech) and IL-13 (20 ng/mL, Peprotech) for M2 polarization, and complete medium only as M0 macrophages for 24 hours.
2.3 Characterization of M1 and M2 macrophages by flow cytometry
To characterize M1 and M2 subsets, the differentiated macrophages were stained with
PE-conjugated CD11b, FITC-conjugated CD80 and APC-conjugated CD206 (Biolegend) in 100 μL FACS buffer at 4°C for 30 mins, and washed twice with FACS buffer. Cells
were then resuspended in FACS buffer and analyzed with FACSCanto (BD).
PE-conjugated rat IgG 2b, κ (Biolegend), FITC-conjugated rat Armenian Hamster IgG
(Biolegend) and APC-conjugated rat IgG 2a, κ (eBioscience) were used as isotype controls.
2.4 Characterization of M1 and M2 macrophage by real-time PCR
In brief, total RNAs were extracted from M0, M1 and M2 macrophages by using isol-RNA lysis reagent (S-PRIME) and direct-zol RNA miniPrep (Zymo Research). The quality and quantity of extracted RNA were measured by DS-II+ spectrophotometer (DeNoyix). Moreover, complementary DNAs (cDNAs) were synthesized from 700 ng RNA with 0.5 nM Oligo dT primer (Purigo Biotech, Inc.) by MMLV high performance
reverse transcriptase (MMLV HP RT, Epicenter Biotechnologies). cDNAs were added in a total volume of 10 μL SYBR green mixture (Bioline) and measured by PikoReal 96
Real-Time PCR System (Thermo Scientific). Primers for genes are described in Table 1.
The Ct (cycle threshold) values were determined by PikoReal Software 2.0 (Thermo Scientific). Relative mRNA expression were normalized with β-actin, a housekeeping gene and an internal control.
2.5 Small interfering RNA (siRNA) transfection
BMDM cells were transfected using TransIT-TKO transfection reagent (Mirus Bio, Madison, WI). In brief, cells were plated into six-well plates 24 hrs to obtain 60-80%
confluence before transfection. siRNA complex including 10 μL TransIT-TKO transfection reagent and 100 nM siRNA per sample was incubated in serum-free DMEM (SFM) containing 1X L-Glutamine (HyClone), 1X NEAA (non-essential amino acid, HyClone), 1X sodium pyruvate (HyClone) and 5 μM 2-ME (2-Mercaptoethanol, Thermo) for 25 mins. TransIT-TKO Reagent/siRNA complex mixture was then added to the cells and the dish was gently rock back and forth to distribute the complexes evenly.
Cells were incubation at 37°C in 5% CO2 for 48 hrs for further experiments.
2.6 Enzyme-linked immunosorbent assay (ELISA) for IL-1β and TNF-α
IL-1β or TNF-α capture antibodies (1X, Biolegend) was coated with 50 μL coating buffer (0.05 M Carbonate-Bicarbonate, pH 9.6) each well on Nunc™ 442404 Nunc-Immuno 96-Well plate (Thermo Scientific) at 4°C overnight. After the plate was washed by 1X PBS-Tween-20 (0.05%) for three times, 50 μL 1X ELISA/ELISPOT Diluent (eBioscience) was added each well to bind non-specific molecules at RT for 1hr.
The plate was then washed as mentioned for three times followed by adding supernatant with 50 μL 1X ELISA/ELISPOT Diluent at 4°C overnight. After the plate was washed for three times, 1X IL-1β or TNF-α detection antibodies (Biolegend) was added with 50 μL 1X ELISA/ELISPOT Diluent at RT for 1hr. After washed for three times, the plate
in the dark at RT for 30 mins. And then, the plate was washed for seven times, and 100 μL 1X TMB substrate (Invitrogen) was added for detection and the reaction was
stopped by adding 50 μL stop solution (2N H2SO4). The fluorescence was detected at 450 nm in an ELISA reader (Biorad).
2.7 BMDM transduction by Ak4 shRNA and scramble lentivirus
Bone marrow cells were transduced at day 3 by Ak4 shRNA and scramble lentivirus at MOI of 30 with serum free medium containing 8 μg/mL polybrene (Sigma) and 20%
L929 supernatant at the speed of 1100g for 90 mins. After centrifuge, 2X complete culture medium containing 20 % L929 supernatant, 20% FBS, 1X penicillin/streptomycin, 1X L-Glutamine, 1X NEAA, 1X sodium pyruvate and 5 μM 2-ME was added with 1X volume of transduction medium overnight. Finally, the cells were washed with dPBS and cultured in fresh 20% L929 culture medium up to day 7.
2.8 Statistical analysis
Statistical analysis was performed by Graphpad Prism (GraphPad Soft ware, La Jolla, CA, USA). All mRNA data acquired from at least three independent experiments are mean ± SD and its significances were determined by nonparametric tests of Student’s t
tests. All protein data acquired from at least three independent experiments are mean ± SEM and its significances were determined by parametric tests of Student’s t tests.
III. Results
1. Bone marrow (BM) cells were able to polarize into M1 and M2 macrophages
in vitro
M1 and M2 macrophage have distinct roles in innate immunity. To perform macrophage polarization, bone marrow cells were cultured in 20% L929 cell supernatant to become bone marrow-derived macrophages (BMDM) for 7 days, and further stimulated in M1-induced or M2-induced conditions for 24 hrs. After 7 day culture, there were around 90% of CD11b+F4/80+ BMDM (Figure 1A). After cytokine stimulation for 24 hours, CD80 expression was enhanced in M1 macrophages (MFI=39.2) than M2 macrophages (MFI=24.7). Conversely, CD206 expression was elevated in M2 macrophages (MFI=129.3) than M1 macrophages (MFI=86.6) (Figure 1B). Our data demonstrated that bone marrow cells can differentiate into BMDM and be further stimulated into M1 and M2 macrophages.
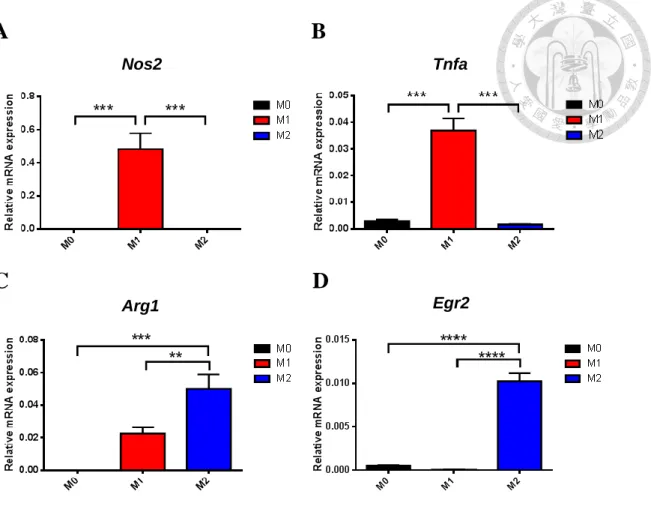
2. Nos2 and Tnfa were highly expressed in M1 macrophages while Arg1 and
Egr2 were highly expressed in M2 macrophages
For further confirmation of M1 and M2 subsets, Nos2, Tnfa, Arg1 and Egr2 were analyzed by real-time PCR. The expressions of Nos2 and Tnfa, M1 markers, were upregulated in M1 compared to M0 and M2 (Figures 2A-2B). On the other hand, the
expressions of Arg1 and Egr2, M2 markers, were upregulated in M2 compared to M0 and M1 (Figures 2C-2D). Our data demonstrated that BMDM can be skewed into M1 and M2 with distinct expression of signature genes.
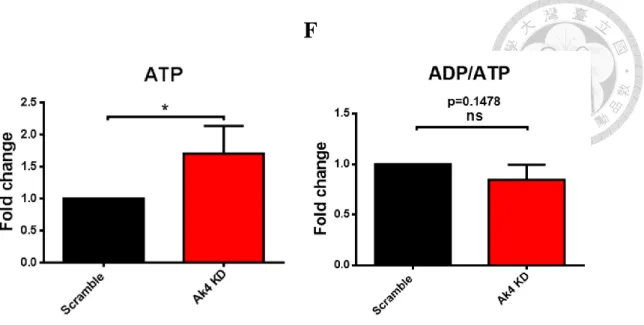
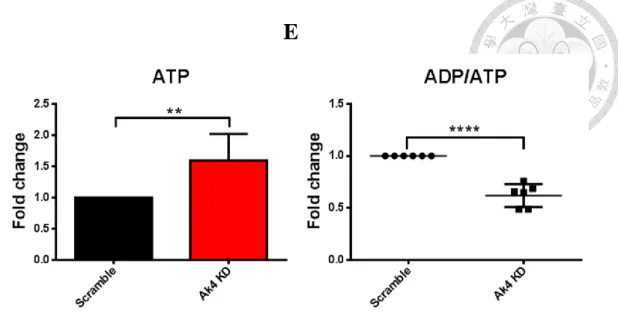
3. ATP level was increased by short hairpin RNA (shRNA) knockdown of Ak4 in
M1 subset
Adenylate kinase 4, located in mitochondria matrix, maintains homeostasis of cellular nucleotide (Panayiotou et al., 2014). However, the role of Ak4 in macrophages remains unclear. Here, the ratio of relative Ak4 mRNA expression in M1 to M0 was 100 and the ratio of relative Ak4 mRNA expression in M1 to M2 was 47 (Fig. 3A). Moreover, Ak4 protein expression was higher in M1 than M0 (5.9 folds) and M2 (2 folds) (Fig. 3B). To identify the role of Ak4 in M1, BMDMs were transduced with Ak4 or scramble shRNA lentivirus, further stimulated by LPS and IFN-γ, and GFP+ cells were sorted out for in vitro analysis (Fig. 3C and Supplemental Fig. S1). The titers of Ak4 and scramble
shRNA lentivirus were 6.2 x 10^6 TU/mL and 8.3 x 10^6 TU/mL, respectively (Supplemental Fig. S2). KD efficiency by Ak4 shRNA in M1 macrophages was 98.2%
(Fig. 3D). ATP level was elevated significantly (p=0.048) by Ak4 shRNA knockdown (Fig. 3E). Moreover, ADP/ATP ratio was reduced but not significant (p=0.148) in Ak4
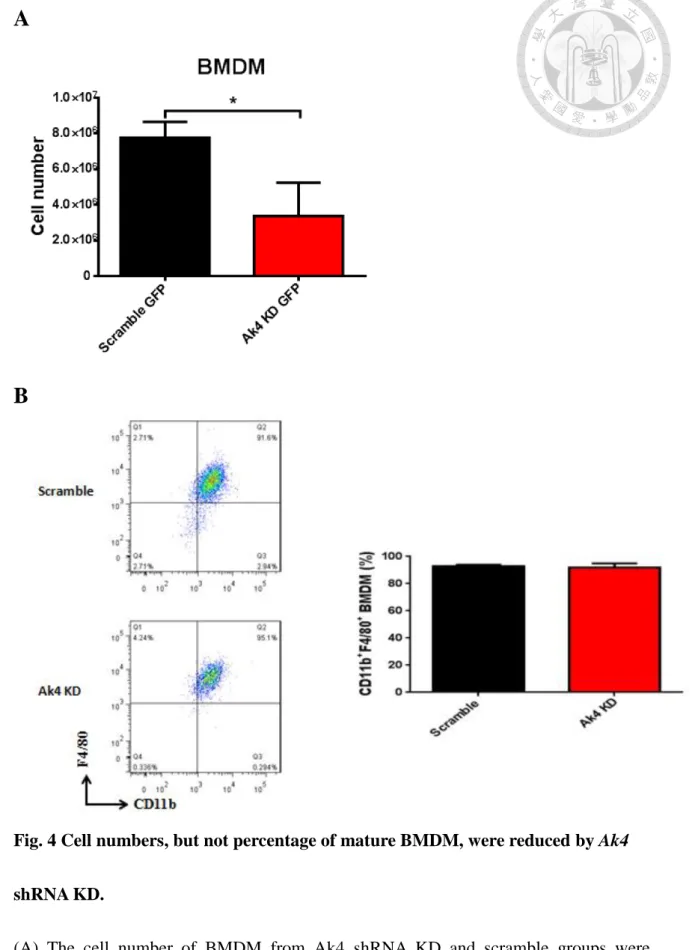
4. Ak4 shRNA knockdown resulted in less cell numbers but not BMDM
maturation
Bone marrow cells were transduced with Ak4 shRNA or scramble shRNA lentivirus in the early stage of development and further cultured in 20% L929 complete medium.
After 7 day culture in 20% L929 culture medium, Ak4 KD group had less cell numbers of BMDM than scramble groups (Fig. 4A). However, the percentages of scramble and Ak4 KD mature macrophages, represented as CD11b+F4/80+, were comparable (91.8%
and 95%, respectively) (Fig. 4B).
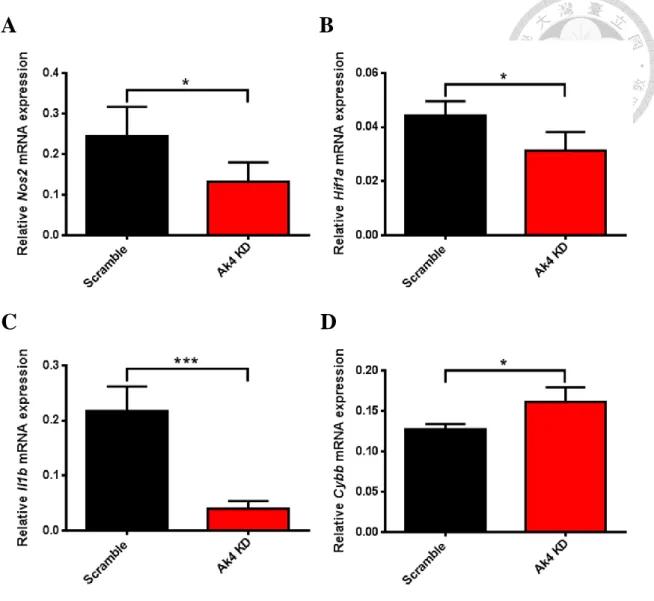
5. The expressions of Nos2, Hif1a and Il1b mRNAs were downregulated and
Cybb mRNA was upregulated in Ak4 KD M1
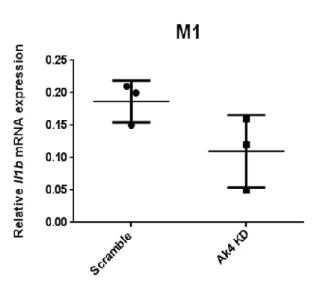
Proinflammatory genes such as Nos2, Hif1a, Il1b, Tnfα and Cybb are upregulated in M1 macrophages (Gensel et al., 2017). We showed that the expressions of Nos2, Hif1a and Il1b were declined in Ak4 shRNA KD M1 macrophages (Fig. 5A-5C). In addition, Tnfa
and Egr2 expressions were decreased in Ak4 siRNA KD M1 macrophages (Supplemental Fig. S3). However, Cybb expression was increased in Ak4 shRNA KD M1 (Fig. 5D).
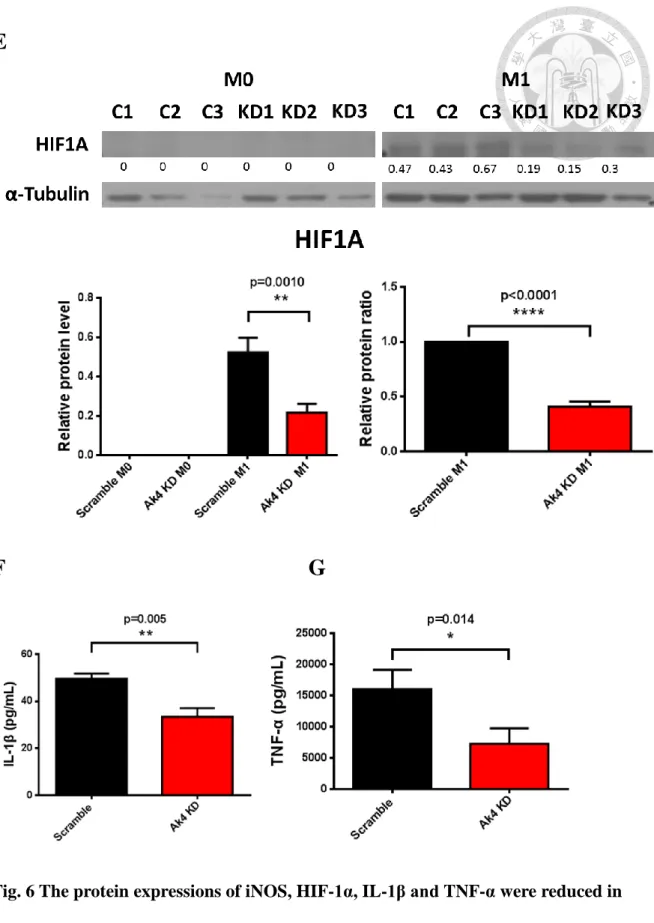
6. Protein expressions of iNOS, HIF-1α, IL-1β and TNF-α were reduced in Ak4
shRNA KD M1 macrophages.
iNOS and HIF-1α were expressed in M1 rather than M0. However, NOX2 highly expressed in M0 and M1 (Fig. 6A). Ak4 expression was decreased (24%) in Ak4 shRNA KD M1 (Fig. 6B) Furthermore, NOX2 showed no difference between scramble M1 and Ak4 shRNA KD M1(Fig 6C). Surprisely, the protein expressions of iNOS and HIF-1α were reduced (p=0.017 for iNOS; p=0.010 for HIF-1α) in Ak4 shRNA KD M1 compared to scramble M1 (Fig. 6D-6E). Moreover, IL-1β and TNF-α were also decreased significantly (p=0.005 for IL-1β; p=0.014 for TNF-α) in Ak4 shRNA KD M1 by ELISA analysis (Fig. 6F-6G).
7. Ak4 siRNA KD M1 exhibited increased ATP level and decreased ADP/ATP
ratio
To further confirm, mature BMDM were transfected with Ak4 siRNA for 3 hrs, and further stimulated by LPS and IFN-γ (Fig. 7A-7B). With around 68% of Ak4 siRNA KD efficiency, ATP level and ADP/ATP ratio were significantly increased and decreased in Ak4 shRNA KD M1, respectively (Fig. 7C-7E).
8. Expressions of Nos2, Cybb, Hif1a and Il1b mRNAs were reduced, but not
In Ak4 siRNA KD groups, the expressions of Nos2, Cybb, Hif1a and Il1b mRNAs were decreased slightly compared to scramble groups (Fig. 8A to 8D).
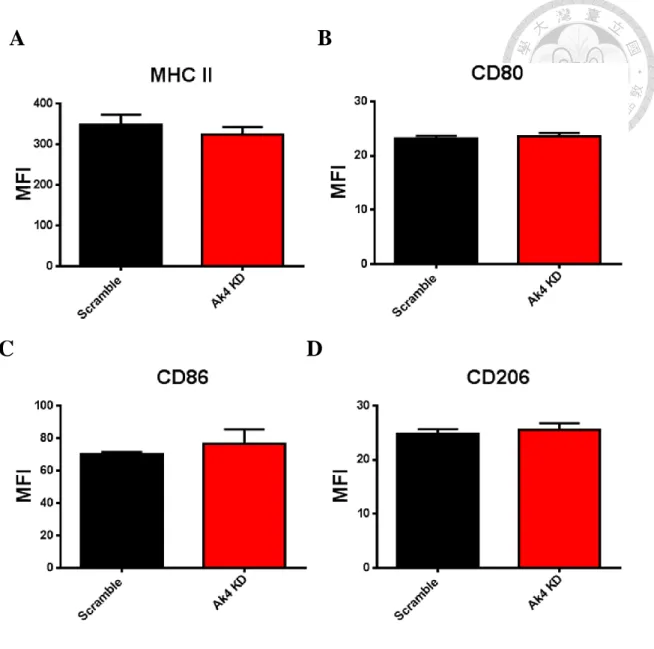
9. The expressions of MHC class II, costimulatory molecules CD80 and CD86,
and mannose receptor CD206 were similar between Ak4 siRNA KD and
scramble siRNA M1 macrophages
MHC II, CD80, CD86 and CD206 are upregulated in activated BMDM. In Ak4 siRNA KD M1 macrophages, expression of MHC II showed no difference between Ak4 KD M1 and scramble M1 (Fig. 9A). Moreover, CD80, CD86 were comparable between Ak4 and scramble siRNA KD M1 (Fig. 9B-9C). Furthermore, the expression of CD206 in Ak4 KD M1 was same as that in scramble M1 (Fig. 9D).
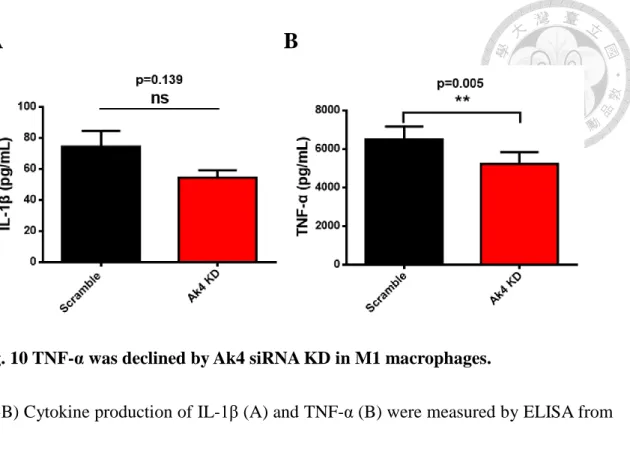
10. TNF-α was decreased while IL-1β was comparable in Ak4 siRNA KD M1
compared to scramble siRNA M1
In Fig. 10, the expression of TNF-α was reduced in Ak4 siRNA KD M1 (5238 pg/mL) compared to scramble M1 (6488 pg/mL) by ELISA. However, cytokine production of IL-1β showed decreased but not significant in Ak4 siRNA KD M1 compared to scramble M1.
VIII. Discussion
Macrophages are important in innate immunity. Metabolism plays a crucial role in immune cells (Michalek et al., 2011). Macrophages reprogram their functions and metabolic pathways upon facing environmental stimuli (Curi et al., 2017). However, how metabolic genes affect macrophage functions remains unknown. Different macrophage subsets utilize distinct pathway to acquire energy for specific functions.
Adenylate kinase 4 (Ak4), located in mitochondria matrix, is encoded by Ak4 gene and is responsible for intracellular nucleotide homeostasis. Here, we demonstrated that Ak4 is highly expressed in M1 subset compared to M0 and M2 subsets. To further investigate the role of Ak4 in M1, Ak4 was knockdowned with both siRNA system and shRNA system. When Ak4 was knockdowned in BMDM by either Ak4 siRNA system or Ak4 shRNA system, BMDM maturation markers CD11b and F4/80 were no changed.
Interestingly, after Ak4 KD by siRNA or shRNA in M1 macrophages, ATP level was increased. Moreover, Nos2, Tnfa, and Egr2 mRNA expressions were decreased by Ak4 siRNA KD in M1 macrophages. However, the expressions of CD80, CD86, CD206, and MHCII in Ak4 KD M1 were similar as those in scramble groups by flow cytometry analysis. It is suggested that Ak4 is involved in cytotoxic killing against pathogen.
To understand whether other distinct genes in M1 (Gensel et al., 2017) were affected by Ak4, the expression of Nos2, Cybb, Hif1a and Il1b were further examined by qPCR in
Ak4 siRNA system and Ak4 shRNA system. Hif1a and Il1b were consistently
downregulated in Ak4 siRNA system and Ak4 shRNA system. However, Nos2 was reduced in Ak4 shRNA system not in Ak4 siRNA system because of the higher knockdown efficiency in Ak4 shRNA system. Besides, the expression of Cybb was increased in shRNA KD M1 macrophages compared to scramble M1macrophages.
HIF-1α is a metabolic regulator and participates in the M1 polarization and response (Wang et al., 2017). Previous study has shown that HIF-1α was reduced by Ak4 KD through prolyl hydroxylase inhibition in non-small cell lung cancer cells (Jan et al., 2019). In addition, Ak4 is a target of HIF-1α, and Ak4 level was decreased in Hif1a-/- hematopoietic cells (Hayashi et al., 2018). Ak4 and HIF-1α positively regulate each other. Our study showed similar results in M1 macrophages (Fig.5 and Fig. S4).
Furthermore, since iNOS and IL-1β were targets of HIF-1α (Majmundar et al., 2010), we demonstrated the expressions of IL-1β and iNOS were declined in Ak4 KD M1 macrophages compared to scramble M1 macrophages. Although Cybb was reported as a target of HIF-1α, we observed the expression of Cybb protein was comparable between Ak4 shRNA KD M1 macrophages and scramble M1 macrophages, indicating Cybb
could be regulated in a HIF-1α independent manner in M1 macrophages. Interestingly, TNF-α expression was also reduced in Ak4 KD M1. However, G. M. Tannahill et al(Tannahill et al., 2013) showed that TNF-α expression was not affected in HIF-1α
deficient macrophages. Taken together, Ak4 plays an essential role in M1 by regulating HIF-1α and its downstream targets, and other pathway to regulate TNF-α. Functional assay will need to be performed to elucidate the Ak4 roles in M1 macrophages.
IX. Tables
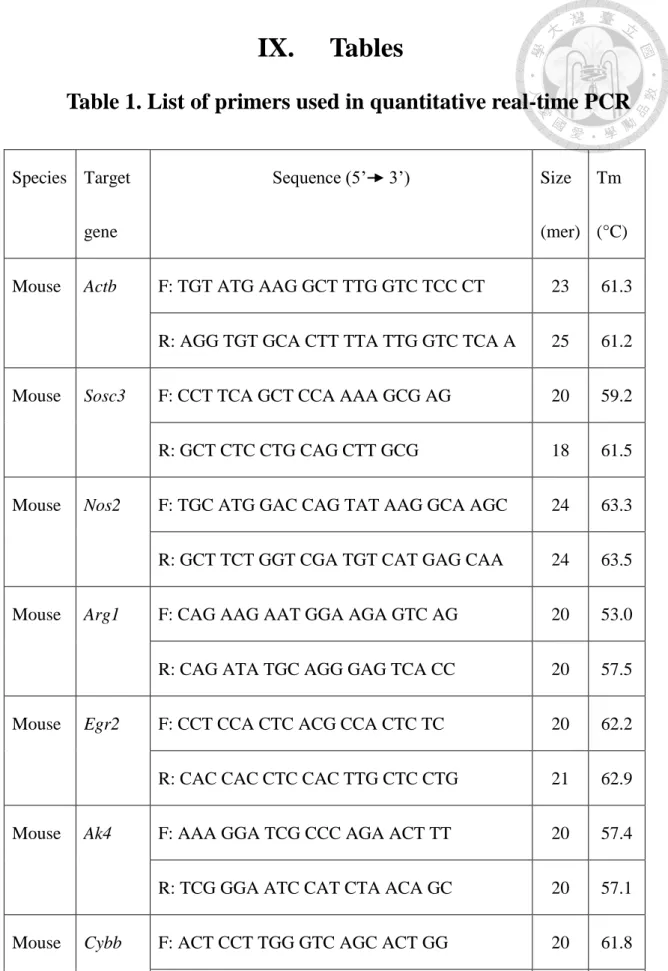
Table 1. List of primers used in quantitative real-time PCR
Species Target gene
Sequence (5’ 3’) Size
(mer) Tm (°C) Mouse Actb F: TGT ATG AAG GCT TTG GTC TCC CT 23 61.3
R: AGG TGT GCA CTT TTA TTG GTC TCA A 25 61.2 Mouse Sosc3 F: CCT TCA GCT CCA AAA GCG AG 20 59.2
R: GCT CTC CTG CAG CTT GCG 18 61.5
Mouse Nos2 F: TGC ATG GAC CAG TAT AAG GCA AGC 24 63.3 R: GCT TCT GGT CGA TGT CAT GAG CAA 24 63.5 Mouse Arg1 F: CAG AAG AAT GGA AGA GTC AG 20 53.0 R: CAG ATA TGC AGG GAG TCA CC 20 57.5 Mouse Egr2 F: CCT CCA CTC ACG CCA CTC TC 20 62.2 R: CAC CAC CTC CAC TTG CTC CTG 21 62.9 Mouse Ak4 F: AAA GGA TCG CCC AGA ACT TT 20 57.4 R: TCG GGA ATC CAT CTA ACA GC 20 57.1 Mouse Cybb F: ACT CCT TGG GTC AGC ACT GG 20 61.8 R: GTT CCT GTC CAG TTG TCT TCG 21 58.9
Mouse Il1b F: TAC GGA CCC CAA AAG ATG A 19 55.6 R: TGC TGC TGC GAG ATT TGA AG 20 59.2 Mouse Hif1a F: AGC CCT AGA TGG CTT TGT GA 20 58.7 R: TAT CGA GGC TGT GTC GAC TG 20 59.2 Mouse Ccr7 F: GGA CAC GCT GAG ATG CTC ACT 21 62.4 R: CCA TCT GGG CCA CTT GGA T 19 59.4
X. Figures
A
B
Fig. 1 The development and differentiation of BMDM.
(A) BMDMs were stained with PE-conjugated CD11b and APC/Cy7-conjugated F4/80 and analyzed by flow cytometry at day 7. (B) BMDM, treated in M1-induced or M2-induced conditions for 24 hrs, were stained with PE-conjugated CD11b, PE-conjugated CD80 and APC-conjugated CD206, and analyzed by flow cytometry for M1 and M2 markers. M0 subset, treated with complete medium only, was the control of M1 and M2 subsets. *, P < 0.05; **, P < 0.01 determined by paired T-test, two tailed (mean ± SEM, n=3).
A B
C D
Fig. 2 Signature gene expressions in bone marrow-derived M1 and M2 subsets.
(A,B) The expressions of Nos2 (A) and Tnfa (B), M1 markers, in M0, M1 and M2 subsets. (C,D) The expressions of Arg1 (C) and Egr2 (D), M2 markers, in M0, M1 and M2 subsets. Gene expressions were analyzed by real-time PCR. Relative gene expressions were normalized with Actb. **, P < 0.01; ***, P < 0.001; ****, P < 0.0001 determined by unpaired T-test, two tailed (n=3).
Tnfa Nos2
Arg1 Egr2
A
B
C
D
E F
Fig. 3 ATP level was elevated by shRNA KD of Ak4 highly expressed in M1.
(A) Ak4 expressions were analyzed by real time PCR in M0, M1 and M2. Relative gene expressions were normalized with Actb, n=3. (B) Ak4 expressions were analyzed by Western blotting in M0, M1 and M2. Relative protein expressions were normalized with α-Tubulin, n=3 (C) Experimental scheme: Bone marrow cells were transduced with Ak4 shRNA or scramble lentivirus at day 3, and further cultured in 20% L929 culture medium up to day 7 to become BMDM. Furthermore, BMDMs were stimulated at day 8 by LPS/IFN-γ for 24 hrs to become M1. GFP+ cells (60% of total cells) were sorted out for real time PCR, ATP and ADP/ATP analysis. Moreover, M1 macrophages (40% of total cells) and supernatant (6x10^5 cells/mL) were collected for Western blotting analysis and ELISA, respectively. (D) Ak4 expressions in Ak4 shRNA or scramble shRNA KD M1 macrophages were analyzed by real time PCR. Relative Ak4
cells) were measured for ATP level (E) and ADP/ATP ratio (F), n=3. The comparison of ATP and ADP/ATP expressions were in terms of fold change as measured by fluorescence. *, P < 0.05; ****, P < 0.0001 determined by unpaired T-test, two tailed.
A
B
Fig. 4 Cell numbers, but not percentage of mature BMDM, were reduced by Ak4
shRNA KD.
(A) The cell number of BMDM from Ak4 shRNA KD and scramble groups were
scramble groups were stained with PE-conjugated CD11b and APC/Cy7-conjugated F4/80 and analyzed by flow cytometry at day 7. *, P < 0.05 determined by unpaired T-test, two tailed (n=3).
A B
C D
Fig. 5 Ak4 shRNA KD reduced the expressions of Nos2, Hif1a and Il1b and
enhanced Cybb expression in M1 macrophages.
Proinflammatory genes in Ak4 shRNA KD and scramble M1 were analyzed by real-time PCR at Day 9 (M1 polarization for 24 hrs). Relative gene expressions of Nos2 (A), Hif1ai (B), Il1b (C) and Cybb (D), were normalized with Actb. The performance of fold
change in Ak4 shRNA KD M1 was normalized with scramble M1. *, P < 0.05; ***, P <
0.001 determined by unpaired T-test, two tailed (n=4).
A
B
C
D
E
F G
Fig. 6 The protein expressions of iNOS, HIF-1α, IL-1β and TNF-α were reduced in
Ak4 shRNA KD M1 macrophages.
(A) Protein expressions of Ak4, iNOS and NOX2 in M0 and M1. (B-D) Relative protein expressions and ratios of Ak4 (B), NOX2 (C) and iNOS (D) in M0 and M1 were normalized with α-Tubulin (n=3). (E) Relative protein expressions and ratios of HIF1A in M0 and M1 were normalized with α-Tubulin (n=3). (F-G) Cytokine production of IL-1β, n=7 (F) and TNF-α, n=3 (G), were measured by ELISA from Ak4 shRNA KD and scramble M1 macrophages (6x10⁵ cells/mL) at Day 9. *, P < 0.05; **, P < 0.01****;
P < 0.0001 determined by paired T-test, two tailed with mean ± SEM. C represents control group and KD represents knockdown groups.
A
B
C
D E
Fig. 7 Elevated ATP level by Ak4 siRNA KD in M1 macrophages.
(A) Experimental scheme: BMDMs were transfected with 100 nM Ak4 or scramble siRNA 3 hrs before LPS/IFN-γ stimulation. After cytokine stimulation for 24hrs, LPS/IFN-γ treated cells were harvested for real time PCR, ELISA, Western blotting and flow cytometry analysis. (B) BMDM were stained with PE-conjugated CD11b and APC/Cy7-conjugated F4/80 and analyzed by flow cytometry at day 7, n=3. (C) Ak4 expressions were analyzed by real time PCR in Ak4 or scramble siRNA M1 macrophages. Relative gene expressions were normalized with Actb. The performance of fold change in Ak4 siRNA KD M1 was normalized with scramble M1, n=3. (D,E) Ak4 siRNA KD and scramble M1 were measured for ATP level (D) and ADP/ATP ratio
(E), n=6. The comparison of ATP and ADP/ATP expressions were in terms of fold change as measured by fluorescence. *, P < 0.05; **, P < 0.01; ****, P < 0.0001
A
B
C
D
Fig. 8 The expressions of Nos2, Cybb, Hif1a and Il1b were decreased, but not
significant, in Ak4 siRNA KD M1 macrophages compared with scramble siRNA
M1 macrophages.
Proinflammatory genes in Ak4 siRNA KD and scramble M1 were analyzed by real-time PCR. Relative gene expressions of Nos2 (A), Cybb (B), Hif1a (C) and Il1b (D) were normalized with Actb. The performance of fold change in Ak4 siRNA KD M1 was normalized with scramble M1, n=3.
A B
C D
Fig. 9 The expressions of CD80, CD86, CD206 and MHC II were not influenced by
Ak4 siRNA KD.
Ak4 or scramble siRNA knockdown M1 macrophages were stained with
FITC-conjugated CD80, PE-conjugated CD86 and APC-conjugated MHC II. The expression of MHC II (A), CD80 (B), CD86 (C) and CD206 (D) were indicated as mean fluorescence intensity. All samples were analyzed by flow cytometry at day 9, (mean ± SEM, n=3).
A B
Fig. 10 TNF-α was declined by Ak4 siRNA KD in M1 macrophages.
(A-B) Cytokine production of IL-1β (A) and TNF-α (B) were measured by ELISA from Ak4 shRNA KD and scramble M1 macrophages (6x10⁵ cells/mL) at Day 9. **, P < 0.01 determined by paired T-test, two tailed ( mean ± SEM, n=3).
XI. Supplementary Figures
Supplemental Fig. S1 Gating strategy of Ak4 shRNA KD and scramble GFP+ M1
macrophages.
M1 by Ak4 or scramble shRNA knockdown were stained with PerCP-Cy5.5-conjugated Propidium Iodide (PI). The cells sorted were PI-GFP+ M1 at day 9 for qPCR, ATP and ADP/ATP analysis.
A
B
Supplemental Fig. S2 The titration of lentiviral concentration.
Ak4 shRNA or scramble lentivirus were collected from supernatant at day 2, day 3 and
day 4. Human Embryonic Kidney Cells 293 (HEK293T) were tranduced with Ak4 shRNA or scramble lentivirus with supernatant from 1 μL to 5 μL at RT for 90 mins.
Infection efficiency was assessed with GFP expression by flow cytometry.
A B
C D
E
Supplemental Fig. S3 M1 and M2 marker expressions in Ak4 siRNA KD and
scramble M1.
M1 and M2 markers in scramble and Ak4 siRNA KD M1s were analyzed by real-time PCR. (A) KD efficiency by Ak4 KD is indicated. (B-E) Relative gene expressions of Nos2 (B), Tnfa (C), Arg1(D) and Egr2 (E) were normalized with Actb. The fold change
in Ak4 siRNA KD M1 was normalized with scramble M1. *, P < 0.05; **, P < 0.01 determined by unpaired T-test, two tailed (n=4).
A B
C D
E
Supplemental Fig. S4 The expressions of Nos2, Cybb, Ak4 and Il1b were decreased
in Hif1a siRNA KD M1.
Proinflammatory genes in Hif1a siRNA KD and scramble M1 were analyzed by real-time PCR. Relative gene expressions of Hif1a (A), Nos2 (B), Cybb (C), Il1b (D) and Ak4 (E) were normalized with Actb. The performance of fold change in Hif1a siRNA KD M1 was normalized with scramble M1. *, P < 0.05; **, P < 0.01; ****, P <
0.0001 determined by unpaired T-test, two tailed (n=3).
Supplemental Fig. S5 IL-1β production was declined by Hif1a siRNA KD.
IL-1β from supernatant of Hif1a siRNA KD and scramble M1 (6x10⁵ cells/mL) was measured by ELISA at Day 9. Three independent experiments are mean ± SEM and its significances were determined by parametric tests of Student’s t tests.
XII. References
Bosca, L., Gonzalez-Ramos, S., Prieto, P., Fernandez-Velasco, M., Mojena, M., Martin-Sanz, P., and Alemany, S. (2015). Metabolic signatures linked to macrophage polarization: from glucose metabolism to oxidative phosphorylation. Biochem Soc Trans 43, 740-744.
Cavaillon, J.M. (2011). The historical milestones in the understanding of leukocyte biology initiated by Elie Metchnikoff. J Leukoc Biol 90, 413-424.
Curi, R., de Siqueira Mendes, R., de Campos Crispin, L.A., Norata, G.D., Sampaio, S.C., and Newsholme, P. (2017). A past and present overview of macrophage metabolism and functional outcomes. Clin Sci (Lond) 131, 1329-1342.
Elhelu, M.A. (1983). The role of macrophages in immunology. J Natl Med Assoc 75, 314-317.
Geelhaar-Karsch, A., Schinnerling, K., Conrad, K., Friebel, J., Allers, K., Schneider, T., and Moos, V. (2013). Evaluation of arginine metabolism for the analysis of M1/M2 macrophage activation in human clinical specimens. Inflamm Res 62, 865-869.
Geeraerts, X., Bolli, E., Fendt, S.M., and Van Ginderachter, J.A. (2017). Macrophage Metabolism As Therapeutic Target for Cancer, Atherosclerosis, and Obesity. Front Immunol 8, 289.
Gensel, J.C., Kopper, T.J., Zhang, B., Orr, M.B., and Bailey, W.M. (2017). Predictive screening of M1 and M2 macrophages reveals the immunomodulatory effectiveness of post spinal cord injury azithromycin treatment. Sci Rep 7, 40144.
Gross, T.J., Kremens, K., Powers, L.S., Brink, B., Knutson, T., Domann, F.E., Philibert, R.A., Milhem, M.M., and Monick, M.M. (2014). Epigenetic silencing of the human NOS2 gene: rethinking the role of nitric oxide in human macrophage inflammatory responses. J Immunol 192, 2326-2338.
Haschemi, A., Kosma, P., Gille, L., Evans, C.R., Burant, C.F., Starkl, P., Knapp, B., Haas, R., Schmid, J.A., Jandl, C., et al. (2012). The sedoheptulose kinase CARKL directs macrophage polarization through control of glucose metabolism. Cell Metab 15, 813-826.
Hayashi, Y., Zhang, Y., Yokota, A., Yan, X., Liu, J., Choi, K., Li, B., Sashida, G., Peng, Y., Xu, Z., et al. (2018). Pathobiological Pseudohypoxia as a Putative Mechanism Underlying Myelodysplastic Syndromes. Cancer Discov 8, 1438-1457.
Hong, S.S., Lee, H., and Kim, K.W. (2004). HIF-1alpha: a valid therapeutic target for tumor therapy. Cancer Res Treat 36, 343-353.
Italiani, P., and Boraschi, D. (2014). From Monocytes to M1/M2 Macrophages:
Partida-Sanchez, S., and Guerau-de-Arellano, M. (2015). Novel Markers to Delineate Murine M1 and M2 Macrophages. PLoS One 10, e0145342.
Jan, Y.H., Lai, T.C., Yang, C.J., Lin, Y.F., Huang, M.S., and Hsiao, M. (2019). Adenylate kinase 4 modulates oxidative stress and stabilizes HIF-1alpha to drive lung
adenocarcinoma metastasis. J Hematol Oncol 12, 12.
Lanning, N.J., Looyenga, B.D., Kauffman, A.L., Niemi, N.M., Sudderth, J.,
DeBerardinis, R.J., and MacKeigan, J.P. (2014). A mitochondrial RNAi screen defines cellular bioenergetic determinants and identifies an adenylate kinase as a key regulator of ATP levels. Cell Rep 7, 907-917.
Majmundar, A.J., Wong, W.J., and Simon, M.C. (2010). Hypoxia-inducible factors and the response to hypoxic stress. Mol Cell 40, 294-309.
Michalek, R.D., Gerriets, V.A., Jacobs, S.R., Macintyre, A.N., MacIver, N.J., Mason, E.F., Sullivan, S.A., Nichols, A.G., and Rathmell, J.C. (2011). Cutting edge: distinct glycolytic and lipid oxidative metabolic programs are essential for effector and regulatory CD4+ T cell subsets. J Immunol 186, 3299-3303.
Nahrendorf, M., and Swirski, F.K. (2016). Abandoning M1/M2 for a Network Model of Macrophage Function. Circ Res 119, 414-417.
Noma, T., Fujisawa, K., Yamashiro, Y., Shinohara, M., Nakazawa, A., Gondo, T., Ishihara, T., and Yoshinobu, K. (2001). Structure and expression of human
mitochondrial adenylate kinase targeted to the mitochondrial matrix. Biochem J 358, 225-232.
Panayiotou, C., Solaroli, N., Johansson, M., and Karlsson, A. (2010). Evidence of an intact N-terminal translocation sequence of human mitochondrial adenylate kinase 4. Int J Biochem Cell Biol 42, 62-69.
Panayiotou, C., Solaroli, N., and Karlsson, A. (2014). The many isoforms of human adenylate kinases. Int J Biochem Cell Biol 49, 75-83.
Pourcet, B., and Pineda-Torra, I. (2013). Transcriptional regulation of macrophage arginase 1 expression and its role in atherosclerosis. Trends Cardiovasc Med 23, 143-152.
Tan, Z., Xie, N., Cui, H., Moellering, D.R., Abraham, E., Thannickal, V.J., and Liu, G.
(2015). Pyruvate dehydrogenase kinase 1 participates in macrophage polarization via regulating glucose metabolism. J Immunol 194, 6082-6089.
Tannahill, G.M., Curtis, A.M., Adamik, J., Palsson-McDermott, E.M., McGettrick, A.F., Goel, G., Frezza, C., Bernard, N.J., Kelly, B., Foley, N.H., et al. (2013). Succinate is an inflammatory signal that induces IL-1beta through HIF-1alpha. Nature 496, 238-242.
Tugal, D., Liao, X., and Jain, M.K. (2013). Transcriptional control of macrophage polarization. Arterioscler Thromb Vasc Biol 33, 1135-1144.
molecule in tolerance induction. Trends Immunol 26, 506-509.
Veremeyko, T., Siddiqui, S., Sotnikov, I., Yung, A., and Ponomarev, E.D. (2013).
IL-4/IL-13-dependent and independent expression of miR-124 and its contribution to M2 phenotype of monocytic cells in normal conditions and during allergic inflammation.
PLoS One 8, e81774.
Wang, T., Liu, H., Lian, G., Zhang, S.Y., Wang, X., and Jiang, C. (2017).
HIF1alpha-Induced Glycolysis Metabolism Is Essential to the Activation of Inflammatory Macrophages. Mediators Inflamm 2017, 9029327.
Ying, W., Cheruku, P.S., Bazer, F.W., Safe, S.H., and Zhou, B. (2013). Investigation of macrophage polarization using bone marrow derived macrophages. J Vis Exp.
Zheng, C., Yang, Q., Xu, C., Shou, P., Cao, J., Jiang, M., Chen, Q., Cao, G., Han, Y., Li, F., et al. (2015). CD11b regulates obesity-induced insulin resistance via limiting
alternative activation and proliferation of adipose tissue macrophages. Proc Natl Acad Sci U S A 112, E7239-7248.
Zhu, L., Zhao, Q., Yang, T., Ding, W., and Zhao, Y. (2015). Cellular metabolism and macrophage functional polarization. Int Rev Immunol 34, 82-100.