Jenn-Ming Song and Kwang-Lung Lina)
Department of Materials Science and Engineering, National Cheng Kung University, Tainan 701, Taiwan, Republic of China
(Received 29 February 2004; accepted 10 June 2004)
In the Sn–9Zn–xAg (x ranges from 0.5 to 3.0%) solder system, the Ag–Zn
intermetallics start crystallizing as –AgZn at about 300 °C. Subsequently, the solder experiences two peritectic transformations upon solidification. This results in the multiphase structural feature. The complicated crystallization process can be briefly described as L(liquid)→ L + AgZn → L + AgZn + Ag5Zn8→ AgZn + Ag5Zn8+ AgZn3.
I. INTRODUCTION
The formation of intermetallic compounds in the bulk of solder and at the interface between solder and metal- lization strongly influences the reliability of solder joints and is of great concern. For instance, the excessive growth of the Cu–Sn intermetallic layer at the interface between Sn–Pb solder and Cu substrate degrades the thermal fatigue life, tensile strength, and fracture tough- ness of solder joints.1–3 Cracks form easily along the interface between the Sn matrix and the irregularly large Ag3Sn within the Sn–Ag–Cu joint under thermal- mechanical fatigue.4
The electronics industry will make substantial progress toward a full transition to Pb-free soldering technology in the near future. The current leading Pb-free solder alloys are the ternary near-eutectic Sn–Ag–Cu al- loys. Sn–Zn eutectic alloy has also been considered as an alternative for lead-free solder material because of its low melting point (198 °C), excellent mechanical properties, and low cost.5,6However, Sn–Zn alloys suffer from easy oxidation and relatively poor wettability. To improve the oxidation resistance and wetting behavior of Sn–Zn solder, the Sn–Zn–Ag alloys have been developed. Ag addition is also capable of increasing ductility and im- proving vibrational fatigue life of Sn–Zn based solders.7,8
Ohnuma et al.9,10have investigated the phase diagram of Sn–Ag–Zn system. The calculated diagram shows that the primary phase upon equilibrium solidification could be Ag, Zn, Ag–Zn, or Ag–Sn compounds depending on the composition. In a Sn–3.66Ag–9Zn alloy, the primary compound is predicted to be ␥–Ag5Zn8. However, the microstructure in practical cases is more complicated.
Instead of the formation of Ag–Sn compounds, recent experiments indicate that the addition of Ag into the eutectic Sn–Zn solder leads to the formation of multi- phase Ag–Zn intermetallics and subsequent off-eutectic structure.7,8,11 A recent study12 revealed that these Ag–Zn intermetallics settle at the bottom of the molten Sn–Zn solder when isothermally heated at 250 °C. This implies that the sedimentation of these Ag–Zn particles may occur during the reflow process when Sn–Zn–Ag alloys are applied for practical uses.
This present study investigated the microstructural evolution of the Ag–Zn intermetallics in Sn–Zn–Ag al- loys during solidification. The effect of Ag content on the microstructural evolution was also examined.
II. EXPERIMENTAL
A near-eutectic Sn–8.8 wt% Zn and several Sn–Zn–Ag alloys with the Zn content of 8.7–8.9 wt% and the Ag content ranging from 0.5 to 3.0 wt% were prepared by melting pure tin, zinc, and silver in a high frequency induction furnace. The chemical compositions of the ma- terials investigated are listed in Table I, where the speci- mens are designated according to their Ag content. These prepared alloy ingots were remelted and cast into 8-mm- diameter cylindrical specimens using gypsum mold with a pouring temperature of 400 °C. The cooling rate of the samples, which is measured as the average value from 300 to 200 °C, was 1.6 °C/s. In addition, the molten solders were also placed in a 5-mm-diameter quartz tube and then water quenched from 400 °C for comparison.
The cooling rate for quenched specimens was 20.2 °C/s.
The solidification characteristics of the alloys were investigated with a cooling curve. The cooling curve was obtained by inserting a thermocouple into 200 g of mol- ten solder placed in a MgO crucible. The molten solder was heated up to above 700 °C prior to cooling curve
a)Address all correspondence to this author.
e-mail: [email protected] DOI: 10.1557/JMR.2004.0356
copy (SEM), electron probe microanalysis (EPMA), and x-ray diffraction (XRD).
III. RESULTS AND DISCUSSION
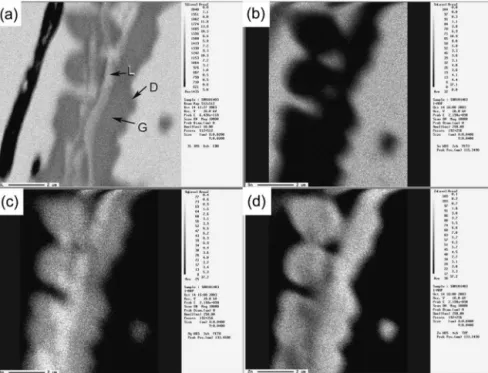
Figures 1(a)–1(c) show the backscattering electron im- ages of the dendritic Ag–Zn intermetallic particles formed in the 0.5Ag, 1.5Ag, and 3.0Ag specimens. All of these intermetallics display a multiphase feature. The mi- crostructure consists of a mixture of irregular light wavy strata (L) and gray regions (G), enveloped by a dark ring (D). EPMA elemental analysis of Sn, Zn and Ag of the 1.5Ag alloy (Fig. 2) reveals that the intermetallics formed between Ag and Zn. It is worth noting that the center of intermetallics, the light strata, consists of greater Ag content, as indicated by brighter signals [Fig. 2(c)]. In contrast, the peripheral region is enriched in Zn, as seen in Fig. 2(d).
The quantitative results of the EDS analysis (Fig. 3) show that there are Ag–Zn phases with three different Ag contents. It shows that the Ag contents of the aforemen- tioned three phases are 57.5 wt% in the light strata, 43.7 wt% in the gray region, and 32.8 wt% in the outer peripheral dark region. The Ag–Zn phase diagram13in- dicates that several kinds of non-stoichiometric interme- tallic phases could be found. All of these intermetallics exhibit a broad range of composition. These intermetallic phases are⑀–AgZn3(19.2–44.4 wt%),␥–Ag5Zn8(49.5–
53.9 wt%),⬘, and –AgZn (60.9–74.2 wt%). Both the hexagonal close-packed (hcp) upon and ordered body- centered cubic (bcc) ⬘ were transformed from a high- temperature phase upon cooling. Accordingly, the light strata are likely to be AgZn, and the gray and dark phases are Ag5Zn8 and AgZn3, respectively. The deviation be- tween the measured and ideal Ag contents of the inter- metallic phases probably results from errors in the energy dispersive spectroscopy (EDS) analysis.
XRD patterns shown in Figs. 4(a) and 4(b) also con- firm the existence of the intermetallics mentioned above.
Notably, AgZn could be detected only in high Ag speci- mens and identified as the ordered bcc ⬘ phase. The amount of⬘–AgZn was probably minimal in the 0.5Ag sample and thus could not be detected by XRD. The⬘
phase was obtained by quenching the disordered bcc phase, the stable phase at high temperatures. As indicated
in the literature,14,15competition between complex hcp and ordered bcc⬘ occurs during the cooling of  phase.
In this study, the quenched phase⬘ is dominant.
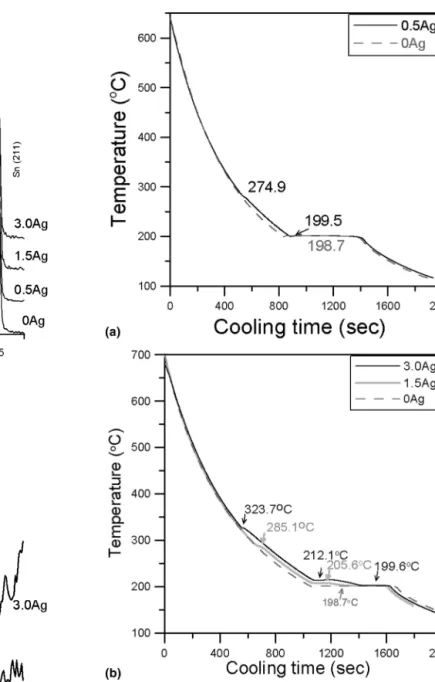
The results of the cooling curves are shown in Figs. 5(a) and 5(b), indicating that the specimens under- went different solidification behaviors. The cooling
FIG. 1. Backscattering electron images of the intermetallic dendrites in (a) 0.5Ag, (b) 1.5Ag, and (c) 3.0Ag samples (L, light stratum; G, gray region; D, dark ring).
curve of the Sn–Zn sample (0Ag) shows no inflection point above the eutectic temperature of 198.7 °C, while an inflection point can be observed at 274.9, 285.1, and 323.7 °C, respectively, for the 0.5Ag, 1.5Ag, and 3.0Ag specimens. It is believed that this exothermic behavior was caused by the crystallization of Ag–Zn intermetal- lics. The 0.5Ag specimen with a slightly higher eutec- tic temperature, 199.5 °C, remains a eutectic feature [Fig. 5(a)]. The off-eutectic features observed apparently with a plateau starting at about 205.6 and 212.1 °C for the 1.5Ag and 3.0Ag specimens respectively [Fig. 5(b)]
are believed to have resulted from the formation of pro- eutectic Sn phase. The off-eutectic feature can be as- cribed to the selective combination of Ag with Zn and thus a depletion in Zn. Within the composition range of
this study, Ag will be exhausted before the eutectic re- action due to the formation of intermetallics. The liquid solder will change from Sn–Zn–Ag ternary system to Sn–Zn binary system. According to the crystalline tem- perature of proeutectic Sn measured, the estimated com- positions of the residual melts at the complete formation of intermetallics before the Sn–Zn eutectic reaction are also shown in Fig. 6. The Zn content of the residual Sn–Zn liquid was 8.58, 7.14, and 5.26 wt%, respectively, for 0.5Ag, 1.5Ag, and 3.0Ag specimens.
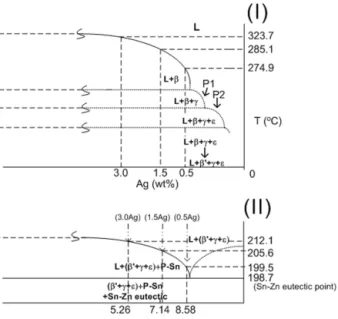
The solidification of Sn–Zn–Ag alloys experiences two stages of transformation as illustrated schematically in Fig. 7. The first stage is composed of crystallization and peritectic reactions of the Ag–Zn intermetallics at high temperatures, the upper portion of Fig. 7. The
FIG. 3. (a) Backscattering electron image of the Ag–Zn intermetallics in the 3.0Ag specimens and (b) the Ag content of each point marked in (a) analyzed by EDS.
FIG. 2. (a) Backscattering electron image and elemental maps of the Ag–Zn intermetallics in the 1.5Ag specimens, (b) Sn, (c) Ag, (d) Zn (L, light stratum; G, gray region; D, dark ring).
second stage is the Sn–Zn eutectic transformation around the eutectic temperature, the lower portion of Fig. 7.
It has been reported that the Gibb free energies for the formation of–AgZn and ␥–Ag5Zn8are similar at high
temperatures.16 Unlike what the calculated phase dia- gram predicted,9 our observation showed that –AgZn formed prior to ␥–Ag5Zn8during the real solidification process. In the beginning of solidification, the –AgZn nucleates and grows in the liquid solder at the expense of nearby Ag and Zn. A higher Ag concentrate leads to a higher crystallization temperature due to the upward curve for L→ L +  and results in a longer solidification time for the growth of AgZn. Thus a larger amount of AgZn can be obtained. That is why the AgZn can only be distinguished in the x-ray pattern of high Ag samples.
The formation of the Ag–Zn primary dendrites with multi-phase structure can be explained by the following double peritectic cascade. That is, L + –AgZn →
␥–Ag5Zn8 (labeled P1 in Fig. 7) and subsequent L +
FIG. 4. (a) XRD patterns of the solders, and (b) enlarged patterns in the range of 40–42° of Ag–contained samples.
FIG. 5. Cooling curves of (a) 0.5Ag and (b) 1.5Ag and 3.0Ag samples in comparison with the 0Ag specimen.
␥–Ag5Zn8→ ⑀–AgZn3and (labeled P2 in Fig. 7). There- fore, the ␥–Ag5Zn8, the gray region, was obtained through the first peritectic reaction. The outer peripheral dark ring, regarded as AgZn3, does not form directly from the melt. It is the product of the second peritectic reaction, which occurs at the edge of the Ag5Zn8.
Recent findings revealed that the outskirt peripheral region of the intermetallic dendrites (AgZn3) will be transformed into the stable high Ag compounds (AgZn and Ag5Zn8) when aging at 250 °C.12This implies that these complex intermetallics are unstable at high tem- peratures. This behavior is in correspondence with the behaviors given by the phase diagram sketch of Fig. 7.
Thermal aging of the intermetallics in Sn–Zn liquid may result in the reversed peritectic reaction.
Figure 8 shows the intermetallics formed in the rapidly cooled 3.5Ag and 0.5Ag specimens. The dendrites of the rapidly cooled 3.5Ag sample [Fig. 8(a)] show a fine, three-phase morphology. Nevertheless, it is obvious that the formation of AgZn3is suppressed in the 0.5Ag speci- men [Fig. 8(b) and 8(c)]. This provides further evidence
FIG. 6. Summary of the specific temperatures: (*) crystalline tem- perature for primary intermetallics, (+) crystalline temperature for Sn–Zn eutectic system. The compositional changes due to the con- sumption of Ag and Zn caused by intermetallics formation are also illustrated.
FIG. 7. Schematic sketch (not to the scale) of the phase diagram of (I) double peritectic and (II) eutectic reactions around the compositions of the three investigated solders (P–Sn: proeutectic Sn).
FIG. 8. Backscattering electron image of the Ag–Zn intermetallics in rapidly solidified specimens: (a) 3.0Ag, (b) 0.5Ag, and (c) magnified structure of the circled region in (b).
off-eutectic structure. The⬘–AgZn crystallized first in the molten solder upon cooling. The crystallizing tem- perature increases from 274.9 to 323.7 °C when the Ag content raised from 0.5 to 3.0 wt%. The Ag–Zn dendrites grew through a double peritectic reaction. The peritectic cascades are L + AgZn→ Ag5Zn8and L + Ag5Zn8→ AgZn3. A decrease in Ag content as well as an increase in cooling rate will suppress the formation of AgZn3.
ACKNOWLEDGMENT
The authors acknowledge the financial support from National Science Council of the Republic of China under NSC 92-2216-E-006-039.
REFERENCES
1. P.T. Tu, Y.C. Chan, and J.K.L. Lai: Effect of intermetallic com- pounds on the shear fatigue of Cu/63Sn–37Pb solder joints. IEEE Trans. CPMT 20, 87 (1997).
2. R.E. Pratt, E.I. Stromswold, and D.J. Quensnel: Effect of solid- state intermetallic growth on the fracture toughness of Cu/
63Sn–37Pb solder joints. IEEE Trans. CPMT 19, 134 (1996).
Mater. 48, 1047 (2003).
8. J.M. Song, G.F. Lan, T.S. Lui, and L.H. Chen: Microstructural features and vibration fracture behavior of Sn–Zn–Ag solder al- loys, in Proc. 4th International Symposium on Electronic Materials and Packaging, edited by S.L. Fu IEEE-CPMT, Dec.
4–6, 2002, Kaohsiung, Taiwan.
9. I. Ohnuma, M. Miyashita, X.J. Liu, H. Ohtani, and K. Ishida:
Phase equilibria and thermodynamic properties of Sn–Ag based Pb-free solder alloys. IEEE Trans. Electron. Packag. Manuf. 26, 84 (2003).
10. I. Ohnuma, X.J. Liu, H. Ohtani, and K. Ishida: Thermodynamic database for phase diagrams in micro-soldering alloys.
J. Electron. Mater. 28, 1164 (1999).
11. C.W. Huang and K.L. Lin: Microstructures and mechanical prop- erties of Sn–8.55Zn–0.45A1-XAg solders. J. Mater. Res. 18, 1528 (2003).
12. J.M. Song and K.L. Lin: Behavior of intermetallics in liquid Sn–Zn–Ag solder alloys. J. Mater. Res. 18, 2060 (2003).
13. T.B. Massalski: Binary Alloy Phase Diagrams (American Society for Metals, Metals Park, OH, 1986), Vol. 1.
14. W.J. Kitchingman and J.I. Buckley: Transformations in the and
phases of the silver-zinc alloys. Acta Metall. 8, 373 (1960).
15. R.L. Orr and J. Rovel: Thermodynamics of the structural modifi- cations of AgZn. Acta Metall. 10, 935 (1962).
16. R. Hultgren, P.D. Desai, D.T. Hawkins, M. Gleioser, and K.K. Kelley: Selected Values of Thermodynamic Properties of Binary Alloys (American Society for Metals, Metals Park, OH, 1973), p. 117.