Screening from TCM Database@Taiwan and QSAR model for identifying HER2 inhibitors
Mao-Feng Suna,b, Shun-Chieh Yanga, Kai-Wei Changa, Tsung-Ying Tsaia, Hsin-Yi Chenc, Fuu-Jen Tsaic,d, Jaung-Geng Linaand Calvin Yu-Chian Chena,c,e,f*
aLaboratory of Computational and Systems Biology, School of Chinese Medicine, China Medical University, Taichung 40402, Taiwan, ROC;bDepartment of Acupuncture, China Medical University Hospital, Taichung, Taiwan, ROC;cDepartment of Bioinformatics, Asia University, Taichung 41354, Taiwan, ROC;dDepartment of Medical Genetics, China Medical University, Taichung 40402, Taiwan, ROC;eDepartment of Systems Biology, Harvard Medical School, Boston, MA 02115, USA;fComputational and Systems Biology, Massachusetts Institute of Technology, Cambridge, MA 02139, USA
(Received 21 February 2011; final version received 27 February 2011)
Human epidermal growth factor receptor type 2 (HER2) overexpression, which has been reported to increase the malignancy of human ovarian cancer cells and the metastatic potential of human breast cancer cells, is an important factor in tumour formation and tumour growth. However, currently available HER2 inhibitors, such as Lapatinib, for cancer therapy cause adverse side effects including diarrhoea, rash and possible liver toxicity. We hoped to find novel agents that cause less adverse side effects by performing virtual screening process on the world’s largest traditional Chinese medicine compound database. The results thus obtained were then validated using 3D quantitative structure – activity relationship model. Top three candidates were selected from the docking results. The top three candidates and the control both formed a hydrogen bond with the key residue, Lys724. This showed that the candidates and the control have similar binding effects to HER2.
These candidates were investigated using comparative molecular field analysis and comparative molecular similarity indices analysis models. The results from these models showed high correlation coefficients (r2) of 0.9547 and 0.9226, respectively.
All top three candidates had high docking scores, favourable pharmacophores and functional groups forming stable hydrogen bonds with HER2. These properties suggested stable binding affinities and favourable interaction with HER2.
We concluded that these candidates may be further investigated as potential HER2 inhibitors.
Keywords: traditional Chinese medicine; 3D-quantitative structure – activity relationship; comparative molecular field analysis; comparative molecular similarity indices analysis
1. Introduction
Human epidermal growth factor receptor type 2 (HER2) is a member of the human epidermal growth factor receptor (EGFR) tyrosine kinases, which is a protein family consisting of HER1/EGFR, HER2/Erb2, HER3/ErbB3 and ErbB4 [1]. HER2 forms heterodimer with other EGFR members. HER2-containing heterodimer is stimulated by ligand binding, which then autophosphorylates and activates downstream signalling pathways associated with cellular proliferation, differentiation and regulation.
Excessive signalling caused by inappropriate gene amplification and/or HER2 overexpression triggers uncontrolled cell growth pathway. Many types of cancer exhibit inappropriate HER2/neu proto-oncogene amplifi- cation and overexpression, including breast cancer, ovarian cancer, gastric cancer and prostate cancer [2 – 6].
Hence, the abnormal increase of HER2 expression is an important factor in tumour formation and growth. As a result, inhibiting the expression or function of HER2 has become an important target for cancer treatment.
Lapatinib (Tykerbw) is a bioactive HER2 inhibitor that competitively inhibits HER2/EGFR protein at the
ATP-binding site of the kinase domain. This drug has been used in breast cancer chemotherapy. However, Lapatinib may cause adverse side effects such as diarrhoea, rash and possibly liver toxicity [7,8]. Also, another HER2 inhibitor, Trastuzumab, has been reported to cause drug resistance after prolonged treatment [9]. Hence, this research sought to develop novel therapeutic agents with reduced adverse side effects as well as decreased possibility of inducing drug resistance. This may contribute to increased compliance and clinical benefit for cancer patients.
We combined both structure-based and ligand-based approaches to screen for optimal HER2 inhibitors from the world’s largest traditional Chinese medicine (TCM) database that we have constructed [10]. For the structure- based approach, we utilised virtual screening methods to filter through more than 20,000 compounds in the TCM database. TCM has been practiced in East Asia for thousands of years. Recent scientific research projects had isolated a large number of TCM compounds for the development of novel therapeutic agents. Several novel anti-cancer or anti-inflammatory compounds have been reported from Refs [11 – 13]. Molecular simulation
ISSN 0892-7022 print/ISSN 1029-0435 online q2011 Taylor & Francis
DOI: 10.1080/08927022.2011.569550 http://www.informaworld.com
*Corresponding author. Email: [email protected]; [email protected] Vol. 37, No. 10, September 2011, 884–892
techniques have been successfully implemented in drug design [14 – 23], and we have already employed these techniques [24 – 44]. In this study, we sought to establish the statistical relationship between the bioactivity data, pIC50 and the various molecular fields defined in the comparative molecular field analysis (CoMFA) and comparative molecular similarity indices analysis (CoM- SIA) models.
2. Materials and methods 2.1 Docking
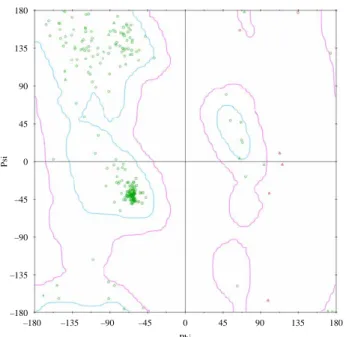
The structure of the HER2 protein was constructed from protein homology. The target sequence, which was downloaded from Swiss-Prot (ERBB_HUMAN, P04626) and Protein Data Bank (PDB: 2ITY and 2J5E), was subjected to sequence comparison. For homology model- ling templates, we used EGFR kinase domain structures, 2ITY and 2J5E, which have high sequence identity and high sequence similarity of 67.0 and 76.3%, respectively (Figure 1). The structure that was constructed validated with Ramachandran plot (Figure 2), which had best carbon torsion angles in 91.8% alpha carbons, and Profile-3D (Figure 3), which suggested reasonable binding site conformation at residues 726 – 734.
Figure 1. Sequence alignment of HER2 and two template structures, 2ITY and 2J5E. The sequence identity is 67.0% and the sequence similarity is 76.3%.
–45 Phi
Psi
0 45 90 135 180
–90 –135 –180 –180 –135 –90 –45 0 45 90 135 180
Figure 2. Ramachandran plot of HER2 modelling structure.
The results show that 91.8% of the residuals were located in favoured region (cyan area), 6% of the residuals were located in semi-favoured region (magenta area) and only 2.2% of the residuals were located in disfavoured region (colour online).
More than 20,000 compounds from the TCM database (http://tcm.cmu.edu.tw/) [10] and controls (Lapatinib and ATP) were analysed. In the Discovery Studio (DS) 2.5 0.9164 (Accelrys, Inc., San Diego, CA, USA) operation environment, Prepare Ligand module with Lipinski’s rule of five was first operated. The Chemistry at HARvard Macromolecular Mechanics (CHARMm) force field was applied to each ligand before docking (LigandFit program) [45] was executed. Monte-Carlo algorithm was employed to generate several energy-minimised conformations for the binding site using docking simulation. Eleven scoring functions, such as LigScore1, LigScore2 [46], PLP1, PLP2 [47,48], Jain [49], PMF, PMF04 [50,51], Ludi Energy Estimate 1, Ludi Energy Estimate 2, Ludi Energy Estimate 3 [52] and DockScore, were applied to evaluate the docking results.
2.2 3D-Quantitative structure – activity relationship model
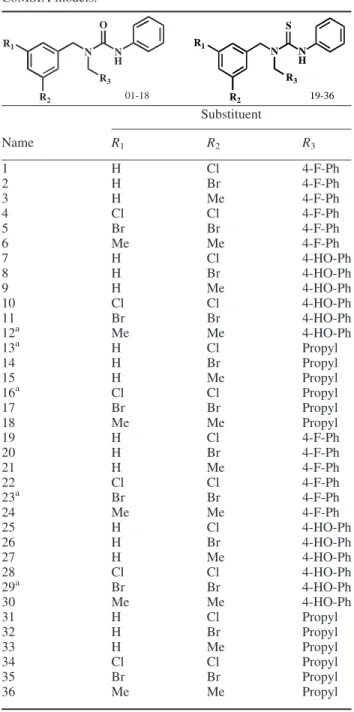
A collection of 36 protein kinase inhibitor ligands [53] was used to establish the 3D-quantitative structure– activity relationship (3D-QSAR) model. The software ChemBioOf- fice was used to draw 2D and 3D structure of the ligands.
Molecular mechanics 2 (MM2) force field was applied for structural optimisation. (Table 1). The software Sybyl 8.0 was then used to randomly select 31 ligands for structural alignment to create the training set (Figure 4). 3D-QSAR models were subsequently created using CoMFA and CoMSIA techniques. Using partial least squares (PLSs) statistical method, correlation coefficients, q2CVand r2were calculated for cross validation (CV) and no validation (NV), Table 1. Molecular structures for constructing CoMFA and
CoMSIA models.
N N H R3 O
R2 R1
01-18
N N H S
R3 R2
R1
19-36
Substituent
Name R1 R2 R3
1 H Cl 4-F-Ph
2 H Br 4-F-Ph
3 H Me 4-F-Ph
4 Cl Cl 4-F-Ph
5 Br Br 4-F-Ph
6 Me Me 4-F-Ph
7 H Cl 4-HO-Ph
8 H Br 4-HO-Ph
9 H Me 4-HO-Ph
10 Cl Cl 4-HO-Ph
11 Br Br 4-HO-Ph
12a Me Me 4-HO-Ph
13a H Cl Propyl
14 H Br Propyl
15 H Me Propyl
16a Cl Cl Propyl
17 Br Br Propyl
18 Me Me Propyl
19 H Cl 4-F-Ph
20 H Br 4-F-Ph
21 H Me 4-F-Ph
22 Cl Cl 4-F-Ph
23a Br Br 4-F-Ph
24 Me Me 4-F-Ph
25 H Cl 4-HO-Ph
26 H Br 4-HO-Ph
27 H Me 4-HO-Ph
28 Cl Cl 4-HO-Ph
29a Br Br 4-HO-Ph
30 Me Me 4-HO-Ph
31 H Cl Propyl
32 H Br Propyl
33 H Me Propyl
34 Cl Cl Propyl
35 Br Br Propyl
36 Me Me Propyl
aTest set.
700 750 800 850 900 950 1000
–0.2 0.0 0.2 0.4 0.6 0.8 1.0 1.2
Score
Amino acid
HER2 2ITY 2J5E
Figure 3. Profile-3D results of HER2 and two template structures (2ITY and 2J5E).
(a) R1
R3 R2
R4
N N
H
(b)
Figure 4. Structural alignment of all training models.
respectively. NV model was used to predict the bioactivity pIC50and to generate pharmacophore models based on the structures and molecular properties of the 31 training set ligands. Bioactivity pIC50of the five ligands from the test set was predicted based on the model.
3. Results and discussion 3.1 Docking
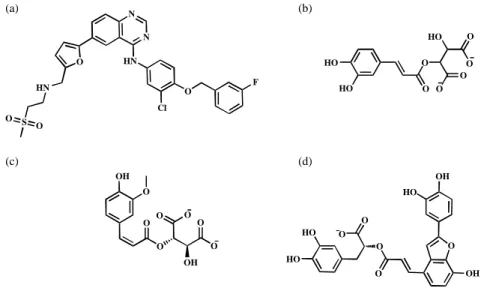
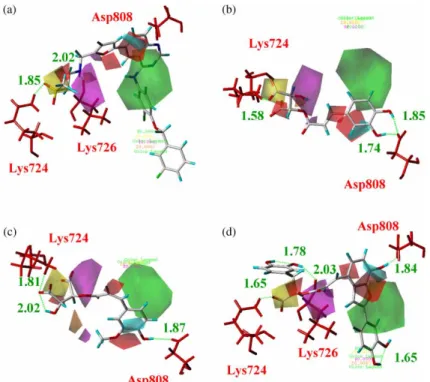
Molecular docking on TCM database identified three compounds, 2-O-caffeoyl tartaric acid, 2-O-feruloyl tartaric acid and salvianolic acid C, which all had significantly higher dock scores than the control, Lapatinib (Table 2). Structures shown in Figure 5 demonstrated that all top 3 ligands possess higher concentration of carboxyl and hydroxyl groups than control, suggesting potential sites for hydrogen bonds. For Lapatinib, the binding conformation showed that the SO2 subgroup forms hydrogen bonds with the key binding
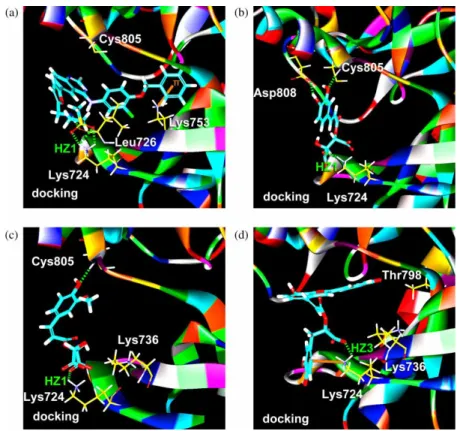
residue Lys724 and the NH subgroup forms hydrogen bonds with Leu726. Additionally, the phenyl ring and Lys 753 formed ap-cation interaction, which further increases the binding stability of Lapatinib (Figure 6(a)). The top 1 ligand, 2-O-caffeoyl tartaric acid, has a carboxyl subgroup that forms a hydrogen bond with Lys724. The candidate’s hydroxyl group on the phenyl ring formed hydrogen bonds with Cys805 and Asp808, which increase the binding stability (Figure 6(b)). Similarly, the top 2 and top 3 compounds, 2-O-feruloyl tartaric acid and salvianolic acid C, each also had a carboxyl subgroup that forms a hydrogen bond with the key residue Lys724. Additionally, the conformations of these two compounds were further stabilised with the formation of hydrogen bonds with Cys805 (Figure 6(c)) and p-cation interaction with Lys724 (Figure 6(d)), respectively. According to the dock score, 2-O-caffeoyl tartaric acid, 2-O-feruloyl tartaric acid and salvianolic acid C all have good binding poses at the HER2 ligand-binding site.
N N
O
HN
S
HN
O Cl
F
O
(a) (b)
(c) (d)
O
HO
HO O
O O O HO O
O
O OH
O
O
O O
O O
OH
HO
HO O
O
O
O OH
O OH HO
Figure 5. Molecular structure of (a) Lapatinib, (b) 2-O-caffeoyl tartaric acid, (c) 2-O-feruloyl tartaric acid and (d) salvianolic acid C.
Table 2. Results from docking.
Names Dock score PLP1 PLP2 PMF
2-O-Caffeoyl tartaric acid 121.870 52.06 59.59 35.32
2-O-Feruloyl tartaric acid 121.483 15.05 22.70 35.44
Salvianolic acid C 104.833 70.02 75.59 36.02
Linoleic acid 97.428 41.24 43.69 49.55
5-O-Caffeoylshikimic acid 95.520 31.44 31.24 41.20
Brucine 92.335 45.10 44.77 90.10
4-O-Caffeoylquinic acid 91.467 33.18 30.98 40.56
Isochlorogenic acid 89.884 52.53 50.87 38.85
Emetine 88.568 43.74 37.64 102.08
Capillartemisin B 85.496 40.94 41.80 25.92
ATPa 75.759 44.76 32.72 100.95
Lapatiniba 67.330 68.43 70.93 95.28
Notes: Ten compounds having highest dock scores were displayed. DockScore (forcefield) ¼ 2 (ligand/receptor interaction energy þ ligand internal energy).aControl.
3.2 3D-QSAR model
Table 3 represents the result of CoMFA and CoMSIA.
CoMFA is calculated by PLS. The steric field represents absolute superiority because the numeral of electrostatic
field is 0. Setting the component as 6, the cross-validated correlation coefficient (q2) and non-cross-validated correlation coefficient (r2) individually acquire 0.725 and 0.955, which suggested the most reliable model.
Figure 6. Docking conformations of (a) Lapatinib, (b) 2-O-caffeoyl tartaric acid, (c) 2-O-feruloyl tartaric acid and (d) salvianolic acid C. Bar and stick model of cyan represents the ligand. Hydrogen bonds and p-cation interaction are shown in green dashed and orange solid line.
Table 3. Evaluation of CoMFA and CoMSIA models.
Cross validation Non-cross validation
CoMFAa CoMSIA ONC q2CV r2 SEE F
ONC 6 S 5 0.721 0.876 0.253 35.428
q2CV 0.725 H 4 0.670 0.853 0.270 37.663
SEE 0.156 D 6 0.581 0.822 0.309 18.486
r2 0.955 A 6 0.361 0.714 0.392 9.999
F 84.112 S þ H 3 0.716 0.823 0.291 41.914
S þ D 6 0.728 0.901 0.231 36.382
S þ A 6 0.719 0.918 0.210 44.799
H þ D 5 0.666 0.876 0.253 35.383
H þ A 6 0.670 0.907 0.224 39.007
D þ A 5 0.594 0.807 0.316 20.890
S þ H þ D 5 0.706 0.893 0.235 41.929
S þ H þ A 5 0.655 0.879 0.250 36.266
S þ D þ Aa 6 0.744 0.891 0.242 32.837
H þ D þ A 6 0.694 0.892 0.241 32.991
S þ H þ D þ A 6 0.634 0.903 0.288 37.391
Note: ONC, optimal number of components; SEE, standard error of estimate; F, F-test value; PLS, partial least squares; S, steric; H, hydrophobic;
D, hydrogen bond donor; A, hydrogen bond acceptor.aPrediction model.
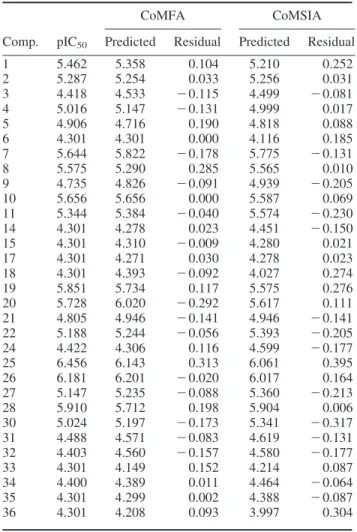
Furthermore, the standard error of estimate (SEE) is small, and the F-test value is big. CoMSIA is also calculated by PLS; the steric field, hydrophobic and hydrogen bond donor/acceptor were evaluated. By setting components as 6, CoMSIA gave the best prediction model with the highest cross-validated correlation coefficient (q2) 0.744 and non- cross-validated correlation coefficient (r2) 0.891 by evaluating steric field and hydrogen bond donor/acceptor traits. Both the above-mentioned models are according to high q2 numeral to get high reliance. The observed, predicted and residual pIC50are given in Table 4. In the CoMSIA model, the numeral of the residual ranges from 0 to 0.313, where 22 compounds have values less than 0.15.
In the CoMSIA model, the numeral of the residual is from 0.006 to 0.395. And there are 17 compounds in which the numeral is lower than 0.15 in CoMSIA. These numbers suggested that the models have low prediction errors in which most were ranged under 0.15 pIC50. Figure 7 shows 95% prediction bands meaning 95% confidence of reliable predictions at this black line. In the CoMFA
model, the relationship of experimental pIC50 and forecasted pIC50 acquired R2 of 0.9547 in the training set. It represented that this model has very high reliance.
Similarly, in CoMSIA_S þ D þ A model, the relationship of experimental pIC50and forecasted pIC50acquires R2of 0.9226 in the training set. It also represented that this model has very high reliance. In the CoMFA model, only the steric field was evaluated because the detection numeral of electrostatic field was 0. Figure 8 shows the CoMSIA_S þ D þ A model, where the favour and disfavour of steric field and hydrogen bond donor/acceptor are represented in colour scheme. In Figure 8(a), Lapatinib had steric bulk region, hydrogen bond between SO2 subgroup and Lys724, and hydrogen bond between NH subgroup and Leu726, which all mapped well with the prediction model. The above-mentioned traits support Lapatinib effectiveness in stable binding. In Figure 8(b), (c), 2-O-caffeoyl tartaric acid and 2-O-feruloyl tartaric acid showed the steric bulk region and hydrogen bond fields mapped well with the CoMSIA model. The hydrogen bonds formed between carboxyl group and Lys724 on the top 1 compound, and between hydroxyl
4.0 4.5 5.0 5.5 6.0 6.5
4.0 4.5 5.0 5.5 6.0 6.5 (a)
(b)
Predict activity
4.0 4.5 5.0 5.5 6.0 6.5
Predict activity
Observed activity
4.0 4.5 5.0 5.5 6.0 6.5
Observed activity Training
Test
R2 = 0.9547
Training Test
R2 = 0.9226
Figure 7. Comparative plot between observed activity (pIC50) and predicted activity (pIC50) of (a) CoMFA model and (b) CoMSIA models.
Table 4. Validation of CoMFA and CoMSIA models by predicting ligand activities of the training set.
CoMFA CoMSIA
Comp. pIC50 Predicted Residual Predicted Residual
1 5.462 5.358 0.104 5.210 0.252
2 5.287 5.254 0.033 5.256 0.031
3 4.418 4.533 2 0.115 4.499 2 0.081
4 5.016 5.147 2 0.131 4.999 0.017
5 4.906 4.716 0.190 4.818 0.088
6 4.301 4.301 0.000 4.116 0.185
7 5.644 5.822 2 0.178 5.775 2 0.131
8 5.575 5.290 0.285 5.565 0.010
9 4.735 4.826 2 0.091 4.939 2 0.205
10 5.656 5.656 0.000 5.587 0.069
11 5.344 5.384 2 0.040 5.574 2 0.230
14 4.301 4.278 0.023 4.451 2 0.150
15 4.301 4.310 2 0.009 4.280 0.021
17 4.301 4.271 0.030 4.278 0.023
18 4.301 4.393 2 0.092 4.027 0.274
19 5.851 5.734 0.117 5.575 0.276
20 5.728 6.020 2 0.292 5.617 0.111
21 4.805 4.946 2 0.141 4.946 2 0.141
22 5.188 5.244 2 0.056 5.393 2 0.205
24 4.422 4.306 0.116 4.599 2 0.177
25 6.456 6.143 0.313 6.061 0.395
26 6.181 6.201 2 0.020 6.017 0.164
27 5.147 5.235 2 0.088 5.360 2 0.213
28 5.910 5.712 0.198 5.904 0.006
30 5.024 5.197 2 0.173 5.341 2 0.317
31 4.488 4.571 2 0.083 4.619 2 0.131
32 4.403 4.560 2 0.157 4.580 2 0.177
33 4.301 4.149 0.152 4.214 0.087
34 4.400 4.389 0.011 4.464 2 0.064
35 4.301 4.299 0.002 4.388 2 0.087
36 4.301 4.208 0.093 3.997 0.304
group and Asp808 on the top 2 compound suggested enhanced binding stability. In Figure 8(d), the mapping of steric bulk and hydrogen bond between carboxyl group and each Lys724 and Lys726, as well as between hydroxyl group and Asp808 also suggested binding stability.
4. Conclusion
From the binding properties suggested by 3D-QSAR, the candidates favoured steric bulk and hydrogen bond donor/acceptor fields as indicated in the prediction models.
All 2-O-caffeoyl tartaric acid, 2-O-feruloyl tartaric acid Figure 8. CoMSIA S þ D þ A model of (a) Lapatinib, (b) 2-O-caffeoyl tartaric acid, (c) 2-O-feruloyl tartaric acid and (d) salvianolic acid C. The favour/disfavour fields of steric (green/yellow), hydrogen bond donor (cyan/red) and hydrogen bond acceptor (magenta/orange) are shown (colour online).
Figure 9. Structure – activity relationship demonstration of (a) Lapatinib, (b) 2-O-caffeoyl tartaric acid, (c) 2-O-feruloyl tartaric acid and (d) salvianolic acid C, where similar subgroup (blue) and the same subgroup (green) are shown (colour online).
and salvianolic acid C formed stable hydrogen bond with Lys724 as the control Lapatinib. Furthermore, all candidate compounds formed additional stable hydrogen bonds with Asp808. These properties summarised in Figure 9 suggested that the candidates bind stably with HER2. Hence, based on the molecular properties and 3D-QSAR modelling, we suggest that all three TCM candidates may be used as potential treatment options for HER2 inhibition.
Acknowledgements
This research was supported by grants from the National Science Council of Taiwan (NSC 99-2221-E-039-013), China Medical University (CMU98-TCM, CMU99-TCM and CMU99-S-02) and Asia University (CMU98-ASIA-09). This study is also supported in part by Taiwan Department of Health Clinical Trial and Research Center of Excellence (DOH100-TD-B-111-004) and Taiwan Department of Health Cancer Research Center of Excellence (DOH100-TD-C-111-005). We are grateful to the National Center of High-performance Computing for providing computer time and facilities.
References
[1] I. Rubin and Y. Yarden, The basic biology of HER2, Ann. Oncol.
12(Suppl. 1) (2001), pp. S3 – S8.
[2] R.H. Engel and V.G. Kaklamani, HER2-positive breast cancer:
Current and future treatment strategies, Drugs 67 (2007), pp. 1329 – 1341.
[3] D. Pils, A. Pinter, J. Reibenwein, A. Alfanz, P. Horak, B.C. Schmid, L. Hefler, R. Horvat, A. Reinthaller, R. Zeillinger, and M. Krainer, In ovarian cancer the prognostic influence of HER2/neu is not dependent on the CXCR4/SDF-1 signalling pathway, Br. J. Cancer 96 (2007), pp. 485 – 491.
[4] M.A. Bookman, K.M. Darcy, D. Clarke-Pearson, R.A. Boothby, and I.R. Horowitz, Evaluation of monoclonal humanized anti-HER2 antibody, trastuzumab, in patients with recurrent or refractory ovarian or primary peritoneal carcinoma with overexpression of HER2: A phase II trial of the Gynecologic Oncology Group, J. Clin.
Oncol. 21 (2003), pp. 283 – 290.
[5] K. Sakai, S. Mori, T. Kawamoto, S. Taniguchi, O. Kobori, Y. Morioka, T. Kuroki, and K. Kano, Expression of epidermal growth factor receptors on normal human gastric epithelia and gastric carcinomas, J. Natl Cancer Inst. 77 (1986), pp. 1047 – 1052.
[6] S. Signoretti, R. Montironi, J. Manola, A. Altimari, C. Tam, G. Bubley, S. Balk, G. Thomas, I. Kaplan, L. Hlatky, P. Hahnfeldt, P. Kantoff, and M. Loda, Her-2-neu expression and progression toward androgen independence in human prostate cancer, J. Natl Cancer Inst. 92 (2000), pp. 1918 – 1925.
[7] C.E. Geyer, J. Forster, D. Lindquist, S. Chan, C.G. Romieu, T. Pienkowski, A. Jagiello-Gruszfeld, J. Crown, A. Chan, B. Kaufman, D. Skarlos, M. Campone, N. Davidson, M. Berger, C. Oliva, S.D. Rubin, S. Stein, and D. Cameron, Lapatinib plus capecitabine for HER2-positive advanced breast cancer, N. Engl. J.
Med. 355 (2006), pp. 2733 – 2743.
[8] E. Amir, A. Ocana, B. Seruga, O. Freedman, and M. Clemons, Lapatinib and HER2 status: Results of a meta-analysis of randomized phase III trials in metastatic breast cancer, Cancer Treat. Rev. 36 (2010), pp. 410 – 415.
[9] R. Nahta and F.J. Esteva, HER2 therapy: Molecular mechanisms of trastuzumab resistance, Breast Cancer Res. 8 (2006), p. 215.
[10] C.Y.-C. Chen, TCM Database@Taiwan: The world’s largest traditional Chinese medicine database for drug screening, PLoS ONE 6 (2011), p. e15939.
[11] Y.J. Tang, J.S. Yang, C.F. Lin, W.C. Shyu, M. Tsuzuki, C.C. Lu, Y.F. Chen, and K.C. Lai, Houttuynia cordata Thunb extract induces
apoptosis through mitochondrial-dependent pathway in HT-29 human colon adenocarcinoma cells, Oncol. Rep. 22 (2009), pp. 1051 – 1056.
[12] C.R. Su, Y.F. Chen, M.J. Liou, H.Y. Tsai, W.S. Chang, and T.S. Wu, Anti-inflammatory activities of furanoditerpenoids and other constituents from Fibraurea tinctoria, Bioorgan. Med. Chem. 16 (2008), pp. 9603 – 9609.
[13] Y.H. Hsieh, F.H. Chu, Y.S. Wang, S.C. Chien, S.T. Chang, J.F. Shaw, C.Y. Chen, W.W. Hsiao, Y.H. Kuo, and S.Y. Wang, Antrocamphin A, an anti-inflammatory principal from the fruiting body of Taiwanofungus camphoratus, and its mechanisms, J. Agric.
Food Chem. 58 (2010), pp. 3153 – 3158.
[14] C.D. Yoo, S.C. Kim, and S.H. Lee, Molecular dynamics simulation study of probe diffusion in liquid n-alkanes, Mol. Simul. 35 (2009), pp. 241 – 247.
[15] D.X. Li, G.L. Chen, B.L. Liu, and Y.S. Liu, Molecular simulation of -cyclodextrin inclusion complex with 2-phenylethyl alcohol, Mol.
Simul. 35 (2009), pp. 199 – 204.
[16] F. Luan, H.T. Liu, Y. Gao, and X.Y. Zhang, QSPR model to predict the thermal stabilities of second-order nonlinear optical (NLO) chromophore molecules, Mol. Simul. 35 (2009), pp. 248 – 257.
[17] J.H. Jing, G.Z. Liang, H. Mei, S.Y. Xiao, Z.N. Xia, and Z.L. Li, Quantitative structure – mobility relationship studies of dipeptides in capillary zone electrophoresis using three-dimensional holographic vector of atomic interaction field, Mol. Simul. 35 (2009), pp. 263 – 269.
[18] A.M. Al-Mekhnaqi, M.S. Mayeed, and G.M. Newaz, Prediction of protein conformation in water and on surfaces by Monte Carlo simulations using united-atom method, Mol. Simul. 35 (2009), pp. 292 – 300.
[19] M.L. Mihajlovic and P.M. Mitrasinovic, Applications of the ArgusLab4/AScore protocol in the structure-based binding affinity prediction of various inhibitors of group-1 and group-2 influenza virus neuraminidases (NAs), Mol. Simul. 35 (2009), pp. 311 – 324.
[20] K. Roy and G. Ghosh, QSTR with extended topochemical atom (ETA) indices. 11. Comparative QSAR of acute NSAID cytotoxicity in rat hepatocytes using chemometric tools, Mol. Simul. 35 (2009), pp. 648 – 659.
[21] P. Nimmanpipug, V.S. Lee, P. Wolschann, and S. Hannongbua, Litchi chinensis-derived terpenoid as anti-HIV-1 protease agent:
Structural design from molecular dynamics simulations, Mol. Simul.
35 (2009), pp. 673 – 680.
[22] P. Ghosh and M.C. Bagchi, Comparative QSAR studies of nitrofuranyl amide derivatives using theoretical structural proper- ties, Mol. Simul. 35 (2009), pp. 1185 – 1200.
[23] Y.S. Zhao, Q.C. Zheng, H.X. Zhang, H.Y. Chu, and C.C. Sun, Homology modelling and molecular dynamics study of human fatty acid amide hydrolase, Mol. Simul. 35 (2009), pp. 1201 – 1208.
[24] C.Y. Chen, Insights into designing the dual-targeted HER2/HSP90 inhibitors, J. Mol. Graph. Model. 29 (2010), pp. 21 – 31.
[25] H.J. Huang, K.J. Lee, H.W. Yu, H.Y. Chen, F.J. Tsai, and C.Y.C. Chen, A novel strategy for designing the selective PPAR agonist by the “Sum of Activity” model, J. Biomol. Struct. Dyn. 28 (2010), pp. 187 – 200.
[26] H.J. Huang, K.J. Lee, H.W. Yu, C.Y. Chen, C.H. Hsu, H.Y. Chen, F.J. Tsai, and C.Y.C. Chen, Structure-based and ligand-based drug design for HER 2 receptor, J. Biomol. Struct. Dyn. 28 (2010), pp. 23 – 37.
[27] H.J. Huang, C.Y. Chen, H.Y. Chen, F.J. Tsai, and C.Y.C. Chen, Computational screening and QSAR analysis for design of AMP- activated protein kinase agonist, J. Taiwan Inst. Chem. Eng. 41 (2010), pp. 352 – 359.
[28] C.Y.C. Chen, Virtual screening and drug design for PDE-5 receptor from traditional Chinese medicine database, J. Biomol. Struct. Dyn.
27 (2010), pp. 627 – 640.
[29] C.Y.C. Chen, Bioinformatics, chemoinformatics, and pharmainfor- matics analysis of HER2/HSP90 dual-targeted inhibitors, J. Taiwan Inst. Chem. Eng. 41 (2010), pp. 143 – 149.
[30] C.Y. Chen, H.J. Huang, F.J. Tsai, and C.Y.C. Chen, Drug design for Influenza A virus subtype H1N1, J. Taiwan Inst. Chem. Eng. 41 (2010), pp. 8 – 15.
[31] C.Y.C. Chen, Weighted equation and rules – A novel concept for evaluating protein – ligand interaction, J. Biomol. Struct. Dyn. 27 (2009), pp. 271 – 282.
[32] C.Y.C. Chen, Computational screening and design of traditional Chinese medicine (TCM) to block phosphodiesterase-5, J. Mol.
Graph. Model. 28 (2009), pp. 261 – 269.
[33] C.Y. Chen, Y.H. Chang, D.T. Bau, H.J. Huang, F.J. Tsai, C.H. Tsai, and C.Y.C. Chen, Ligand-based dual target drug design for H1N1:
Swine Flu – A preliminary first study, J. Biomol. Struct. Dyn. 27 (2009), pp. 171 – 178.
[34] C.Y. Chen, Y.H. Chang, D.T. Bau, H.J. Huang, F.J. Tsai, C.H. Tsai, and C.Y.C. Chen, Discovery of potent inhibitors for phosphodi- esterase 5 by virtual screening and pharmacophore analysis, Acta Pharmacol. Sin. 30 (2009), pp. 1186 – 1194.
[35] C.Y.C. Chen, Pharmacoinformatics approach for mPGES-1 in anti- inflammation by 3D-QSAR pharmacophore mapping, J. Taiwan Inst.
Chem. Eng. 40 (2009), pp. 155 – 161.
[36] C.Y.C. Chen, De novo design of novel selective COX-2 inhibitors:
From virtual screening to pharmacophore analysis, J. Taiwan Inst.
Chem. Eng. 40 (2009), pp. 55 – 69.
[37] C.Y.C. Chen, Chemoinformatics and pharmacoinformatics approach for exploring the GABA-A agonist from Chinese herb suanzaoren, J. Taiwan Inst. Chem. Eng. 40 (2009), pp. 36 – 47.
[38] C.Y.C. Chen, Insights into the suanzaoren mechanism – From constructing the 3D structure of GABA-A receptor to its binding interaction analysis, J. Chin. Inst. Chem. Eng. 39 (2008), pp. 663– 671.
[39] C.Y.C. Chen, Discovery of novel inhibitors for c-Met by virtual screening and pharmacophore analysis, J. Chin. Inst. Chem. Eng. 39 (2008), pp. 617 – 624.
[40] C.Y.C. Chen, Y.F. Chen, C.H. Wu, and H.Y. Tsai, What is the effective component in suanzaoren decoction for curing insomnia?
Discovery by virtual screening and molecular dynamic simulation, J. Biomol. Struct. Dyn. 26 (2008), pp. 57 – 64.
[41] C.Y.C. Chen, A novel perspective on designing the inhibitor of HER2 receptor, J. Chin. Inst. Chem. Eng. 39 (2008), pp. 291 – 299.
[42] C.Y.C. Chen, G.W. Chen, and W.Y.C. Chen, Molecular simulation of HER2/neu degradation by inhibiting HSP90, J. Chin. Chem. Soc.- Taip. 55 (2008), pp. 297 – 302.
[43] Y.C. Chen and K.T. Chen, Novel selective inhibitors of hydroxyxanthone derivatives for human cyclooxygenase-2, Acta Pharmacol. Sin. 28 (2007), pp. 2027 – 2032.
[44] Y.C. Chen, The molecular dynamic simulation of zolpidem interaction with gamma aminobutyric acid type A receptor, J. Chin. Chem. Soc.-Taip. 54 (2007), pp. 653 – 658.
[45] C.M. Venkatachalam, X. Jiang, T. Oldfield, and M. Waldman, LigandFit: A novel method for the shape-directed rapid docking of ligands to protein active sites, J. Mol. Graph. Model. 21 (2003), pp. 289 – 307.
[46] A. Krammer, P.D. Kirchhoff, X. Jiang, C.M. Venkatachalam, and M. Waldman, LigScore: A novel scoring function for predicting binding affinities, J. Mol. Graph. Model. 23 (2005), pp. 395 – 407.
[47] D.K. Gehlhaar, G.M. Verkhivker, P.A. Rejto, C.J. Sherman, D.B. Fogel, L.J. Fogel, and S.T. Freer, Molecular recognition of the inhibitor AG-1343 by HIV-1 protease: Conformationally flexible docking by evolutionary programming, Chem. Biol. 2 (1995), pp. 317 – 324.
[48] G.M. Verkhivker, D. Bouzida, D.K. Gehlhaar, P.A. Rejto, S. Arthurs, A.B. Colson, S.T. Freer, V. Larson, B.A. Luty, T. Marrone, and P.W. Rose, Deciphering common failures in molecular docking of ligand-protein complexes, J. Comput. Aided Mol. Des. 14 (2000), pp. 731 – 751.
[49] A.N. Jain, Scoring noncovalent protein-ligand interactions: A continuous differentiable function tuned to compute binding affinities, J. Comput. Aided Mol. Des. 10 (1996), pp. 427 – 440.
[50] I. Muegge and Y.C. Martin, A general and fast scoring function for protein – ligand interactions: A simplified potential approach, J. Med. Chem. 42 (1999), pp. 791 – 804.
[51] I. Muegge, PMF scoring revisited, J. Med. Chem. 49 (2006), pp. 5895 – 5902.
[52] H.J. Bohm, Prediction of binding constants of protein ligands: A fast method for the prioritization of hits obtained from de novo design or 3D database search programs, J. Comput. Aided Mol. Des. 12 (1998), pp. 309 – 323.
[53] H.Q. Li, T. Yan, Y. Yang, L. Shi, C.F. Zhou, and H.L. Zhu, Synthesis and structure – activity relationships of N-benzyl-N-(X-2- hydroxybenzyl)-N0-phenylureas and thioureas as antitumor agents, Bioorgan. Med. Chem. 18 (2010), pp. 305 – 313.