Serum Total p-Cresol and Indoxyl Sulfate Correlated With Stage of Chronic Kidney Disease in Renal Transplant Recipients
S.-T. Huang, K.-H. Shu, C.-H. Cheng, M.-J. Wu, T.-M. Yu, Y.-W. Chuang, and C.-H. Chen
ABSTRACT
Background. Uremic toxins are considered cardiovascular and mortality risk factors in chronic kidney disease (CKD) patients. Both p-cresol and indoxyl sulfate have been shown to induce oxidative stress in vitro and subsequent endothelial dysfunction in uremic patients. Our study evaluated the levels of p-cresol and indoxyl sulfate, and whether they contribute to the progression of CKD in transplant recipients.
Methods. We retrospectively evaluated 95 patients who had received a transplant from February 1987 to June 2010 in our center; the recipients had a mean transplant duration of 5.3 ⫾ 4.9 years and a mean age of 47.8 ⫾ 14.1 years. Among them, 56.8% (54/95) were male. Patients with glomerular filtration rate (GFR) ⱖ 60 mL/min/1.73 m
2were selected for group 1 (n ⫽ 35), and those with GFR ⬍ 60 mL/min/1.73 m
2were selected for group 2 (n ⫽ 60). Demographic and clinical data were compared between groups. Serum and urine levels of p-cresol and indoxyl sulfate were also obtained.
Results. Baseline serum p-cresol and indoxyl sulfate levels were significantly higher in advanced CKD stages (P ⫽ .001 and ⬍.0001, respectively). Patients at advanced CKD stages (group 2) had lower serum levels of hemoglobin and albumin (P ⬍ .0001), but higher levels of total cholesterol, triglyceride, and uric acid levels (P ⫽ .04, .04 and .001, respectively). Body mass index, C-reactive protein, and serum calcium and phosphate levels showed no significant differences between groups. The cut-off value for serum p-cresol between groups was 1.28 umol/L (P ⫽ .01), and that for the indoxyl sulfate level was 0.98 umol/L (P ⫽ .0001).
Conclusion. The serum p-cresol and indoxyl sulfate levels were significantly higher in advanced CKD stages in transplant recipients. To evaluate the use of serum p-cresol and indoxyl sulfate levels as a predictive tool for survival, larger clinical studies are needed.
E VEN with improved immunosuppressive agents and early graft survival, graft function still deteriorates due to time-dependent immunologic and nonimmunologic causes in kidney transplant patients.1–3The protein-bound uremic toxins (p-cresol and indoxyl sulfate) markedly accu- mulated in serum
4are associated with progression of renal failure in chronic kidney disease (CKD) patients.
5,6 The ability of p-cresol and indoxyl sulfate to increase endothelial microparticle (EMP) release,
7which is associated with the increase of endothelial activation marker levels and impaired vascular function in uremic patients,
8suggested that specific uremic toxins may be involved in EMP increase and sub- sequent cardiovascular outcomes.
9 –11 However, whether p- cresol and indoxyl sulfate have a clinical impact such as this in transplant recipients is unknown. We conducted a cross-
sectional study to analyze the correlation between uremic toxins and renal function deterioration in kidney transplanta- tion patients.
From the Division of Nephrology (S.-T.H., K.-H.S., C.-H.C., M.-J.W., T.-M.Y., Y.-W.C., C.-H.C.), Department of Internal Medicine, Taichung Veterans General Hospital; School of Med- icine College of Medicine (T.-M.Y., C.-H.C.), China Medical University; School of Medicine, College of Medicine (K.-H.S., C.-H.C., M.-J.W., C.-H.C.), Chung Shan Medical University, Taichung, Taiwan.
Address reprint requests to Cheng-Hsu Chen, MD, PhD, Division of Nephrology, Department of Internal Medicine, Taic- hung Veterans General Hospital, 160, Section 3, Taichung-Kang Rd, Taichung, 407, Taiwan. E-mail:[email protected]
© 2012 Published by Elsevier Inc. 0041-1345/–see front matter
360 Park Avenue South, New York, NY 10010-1710 doi:10.1016/j.transproceed.2011.11.023
Transplantation Proceedings, 44, 621– 624 (2012) 621
MATERIALS AND METHODS Patients
The study population consisted of 95 kidney transplant recipients treated for at least 3 months between February 1987 and June 2011 in our center. The study was approved by the institutional review board and ethics committee (No.CE11155). Most patients were treated with triple-therapy immunosuppression in a maintenance dose that consisted of prednisolone in the case of 85 patients, either cyclosporine in the case of 19 patients or tacrolimus in the case of 75 patients, and either mycophenolate mofetil in the case of 37 patients or mycophenolate sodium in the case of 29 patients.
Another 10 patients were also treated with sirolimus. Patients with a glomerular filtration rate (GFR)ⱖ 60 mL/min/1.73 m2were
selected as group 1 (n⫽ 35), and those with GFR ⬍ 60 mL/min/
1.73 m2were selected as group 2 (n⫽ 60). Allograft function was differentiated according to the proposed National Kidney Founda- tion Kidney Disease Outcome Quality Initiative (KDOQI) clinical practice guidelines for CKD because all patients with a kidney transplant would be considered either to have CKD or to be at increased risk for CKD. Demographic, clinical, and biochemical data were compared between groups. Serum and urine levels of total p-cresol and indoxyl sulfate were also obtained.
STATISTICAL ANALYSIS
Statistical analysis was performed with SPSS for Windows, version 16.0. Data are expressed as percent and mean⫾ standard devia- Table 1. Demographic Characteristics of the Study Population
Variable
Group 1 (eGFR ⱖ 60 mL/min/1.73 m2)
(N⫽ 35)
Group 2 (eGFR
⬍ 60 mL/min/1.73 m2) (N⫽ 60)
Total Patients
(N⫽ 95) P Value
Transplant Duration, y 4.13⫾ 3.20 6.06⫾ 5.50 5.35⫾ 4.86 NS
Age, y 48.06⫾ 15.38 47.60⫾ 13.45 47.77⫾ 14.12 NS
Male gender, n (%) 27 (77.1%) 27 (45.0%) 54 (56.8%) .002
Body mass index (kg/m2) 24.30⫾ 4.12 23.01⫾ 3.97 23.43⫾ 4.04 NS
Presence of CVD, n (%)
CAD 2 (5.7%) 8 (12.9%) 10 (10.3%) NS
VHD 1 (2.9%) 4 (6.5%) 5 (5.2%)
CVA 0 (0.0%) 1 (1.6%) 1 (1.0%)
Diabetes mellitus, n (%) 9 (25.7%) 15 (25.0%) 24 (25.3%) NS
Hepatitis B, n (%) 6 (17.1%) 4 (6.7%) 10 (10.5%) NS
Hepatitis C, n (%) 3 (8.6%) 11 (18.3%) 14 (14.7%) NS
Smoking, n (%) 5 (14.3%) 8 (13.3%) 13 (13.7%) NS
CKD stage, n (%)
1 2 (5.7%) 0 (0.0%) 2 (2.1%) ⬍.0001
2 33 (94.3%) 2 (3.3%) 35 (36.8%)
3 0 (0.0%) 46 (76.%) 46 (48.4%)
4 0 (0.0%) 12 (20.0%) 12 (12.6%)
5 0 (0.0%) 1 (1.6%) 1 (1.0%)
Data are expressed as means⫾ SD.
Abbreviations: eGFR, estimated glomerular filtration rate; CVD, cardiovascular disease; CAD, coronary artery disease; VHD, valvular heart disease; CVA, cerebral vascular disease; CKD, chronic kidney disease; NS, not significant.
Table 2. Biochemical Characteristics of the Study Population
Variable
Group 1 (eGFR ⱖ 60 mL/min/1.73 m2)
(N⫽ 35)
Group 2 (eGFR
⬍ 60 mL/min/1.73 m2)
(N⫽ 60) Total Patients
(N⫽ 95) P Value
Urea, mg/dL 15.9⫾ 4.96 27.9⫾ 14.84 23.5⫾ 13.46 ⬍.0001
Creatinine, mg/dL 1.1⫾ 0.16 1.9⫾ 1.33 1.6⫾ 1.13 ⬍.0001
Hemoglobin, g/dL 13.6⫾ 1.46 11.8⫾ 2.24 12.4⫾ 2.17 ⬍.0001
Albumin, g/dL 4.5⫾ 0.27 4.1⫾ 0.40 4.2⫾ 0.40 ⬍.0001
CRP, mg/dL 0.6⫾ 0.91 0.8⫾ 0.88 0.7⫾ 0.88 NS
Calcium, mmol/dL 9.3⫾ 0.67 9.2⫾ 1.18 9.2⫾ 1.02 NS
Phosphate, mmol/dL 3.3⫾ 0.78 3.2⫾ 0.75 3.2⫾ 0.75 NS
Total cholesterol, mmol/dL 169.4⫾ 32.15 184.0⫾ 38.19 178.6⫾ 36.60 .04
Triglycerides, mmol/dL 120.2⫾ 52.27 148.7⫾ 62.95 138.2⫾ 60.55 .04
Uric acid, mg/dL 6.5⫾ 1.53 7.7⫾ 1.69 7.3⫾ 1.73 .001
Serum p-cresylsulfate, umol/L 2.3⫾ 3.07 5.2⫾ 6.66 4.1⫾ 5.76 .02
Serum indoxyl-sulfate, umol/L 0.6⫾ 0.98 2.6⫾ 3.38 1.9⫾ 2.90 ⬍.0001
Urine p-cresylsulfate, umol/L 38.6⫾ 81.32 36.3⫾ 55.56 37.2⫾ 65.91 NS
Urine indoxyl-sulfate, umol/L 48.0⫾ 58.67 48.7⫾ 48.81 48.4⫾ 52.39 NS
Data are expressed as means⫾ SD.
Abbreviations: eGFR, estimated glomerular filtration rate; CRP, C-reactive protein; NS, not significant.
622 HUANG, SHU, CHENG ET AL
tion. Demographic and outcome differences were compared by Pearson’s chi-square test, Fisher exact test, Yate’s correction for continuity, the Mann-Whitney U test, and independent sample t test as appropriate. Linear regression analysis was used to assess the relationship between serum p-cresylsulphate levels and renal function. Serial biochemical changes were analyzed with the gen- eralized estimating equation (GEE) model. A P value⬍.05 was considered statistically significant.
RESULTS
The mean follow-up duration in group 1 was comparable to that in group 2 (4.1 ⫾ 3.2 years versus 6.0 ⫾ 5.5 years, P ⫽ .22). Age, sex, body mass index, prevalence of cardiovascu- lar comorbidity, diabetes mellitus, hepatitis B or C infec- tion, and smoking history were also comparable between groups. Most patients in group 1 were in CKD stage 2 (33;
94.3%), and most patients in group 2 were in CKD stage 3 (46; 76.7%; in
Table 1). With regard to immunosuppressiveregimens, the average prednisolone dose used in group 1
was lower than that used in group 2 (4.8 ⫾ 1.8 mg/d versus 6.1 ⫾ 4.1 mg/d, P ⫽ .01). The average dose and trough concentration of tacrolimus, cyclosporine, and sirolimus were not significantly different between groups. The serum
p-cresol and indoxyl sulfate concentrations were lower ingroup 1 than in group 2 (2.3 ⫾ 3.1 umol/L versus 5.2 ⫾ 6.7 umol/L, P ⫽ .02; 0.6 ⫾ 1.0 umol/L versus 5.2 ⫾ 6.7 umol/L,
P⫽ .02, respectively;
Table 2).Serum hemoglobin and albumin levels were significantly higher in group 1 than in group 2 (13.6 ⫾ 1.5 versus 11.8 ⫾ 2.2 g/dL, P ⬍ .0001; 4.5 ⫾ 0.3 versus 4.1 ⫾ 0.4 g/dL, P ⬍ .0001, respectively). The serum cholesterol, triglyceride, and uric acid levels were significantly lower in group 1 than in group 2 (P ⫽ .04, P ⫽ .04 and P ⬍ .0006, respectively).
We also found that the serum level of p-cresol and indoxyl sulfate was higher at advanced CKD stages (Fig 1). There was no difference associated with eGFR (data not shown).
Fig 1. The correlation of serum p-cresol sulfate and indoxyl sulfate (umol/L) and stage of chronic kidney disease (CKD) in renal transplant recipients. P⫽ .001 and P ⬍ .0001, respectively.
Fig 2. Comparision of eGFR levels at different serum p-cresol sulfate levels. * P⬍ .05 between two groups. ** P ⬍ .05 for trend analysis by GEE (generalized estimating equation) model.
P CRESOL AND INDOXYL LEVELS WITH CKD 623
The cut-off values of the serum p-cresol and indoxyl sulfate levels between groups were 1.28 umol/L and 0.98 umol/L, respectively (Fig 2, P ⫽ .001 and .0001 by ROC curve).
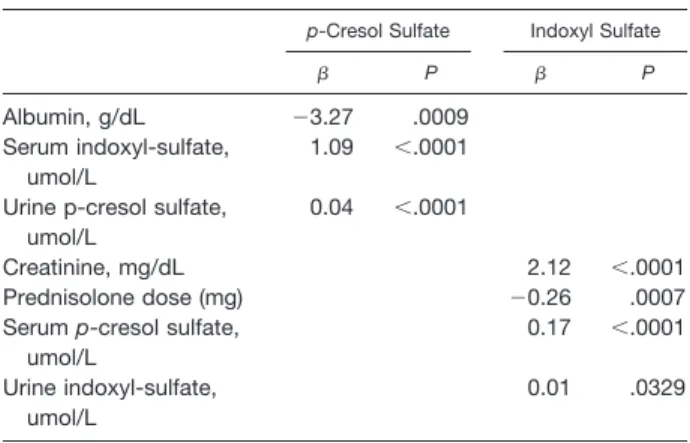
Linear regression analysis revealed that there was an inverse correlation between the serum p-cresol level and serum albu- min level, and a positive correlation between the serum
p-cresol level and serum indoxyl sulfate and urine p-cresollevels. The serum indoxyl sulfate level was positively corre- lated with the serum creatinine level and inversely correlated with the daily prednisolone dose (Table 3).
DISCUSSION
Our study presented the distribution of serum p-cresol and indoxyl sulfate levels at different stages of CKD in trans- plant recipients. Renal function appeared to be an impor- tant determining factor of the indoxyl sulfate level in these patients, which shows the ability of p-cresol and indoxyl sulfate to induce oxidation damage in endothelial cells
12and worsen renal function. We also found that the serum albumin level, a nutrition marker, was inversely associated with the serum p-cresol level. Further studies are needed to confirm whether p-cresol is associated with cachexia, as we would see in the elevation of cytokines such as leptin in uremic patients,
13or was an innocent bystander only.
On the other hand, cardiovascular disease (CVD) ac- counts for graft failure and for up to 25% of patient death after kidney transplantation. In a subanalysis of the Folic Acid for Vascular Outcome Reduction in Transplantation (FAVORIT) study,
14the researchers found that cardiovas- cular risk factors, especially uncontrolled hypertension, were undertreated in kidney transplantation patients. Apart from strategies to reduce cardiovascular risk, such as early corticosteroid withdrawal
15,16and improving compliance, we focused on the role of uremic toxins as a novel CVD risk factor
17–22and its contribution to the progression of CKD.
5,6Although we did not evaluate the relationship between the accumulation of uremic toxins and subsequent cardiovascular outcome because of the small study popula- tion and short follow-up duration, we showed the deterio-
ration of renal function at different levels of serum p-cresol and indoxyl sulfate with time. In conclusion, the function progression and malnutrition in kidney transplant patients.
REFERENCES
1. Nankivell BJ, Borrows RJ, Fung CL, et al: The natural history of chronic allograft nephropathy. N Engl J Med 349:2326, 2003
2. Cornell LD, Colvin RB: Chronic allograft nephropathy. Curr Opin Nephrol Hypertens 14:229, 2005
3. Paul LC: Chronic allograft nephropathy: an update. Kidney Int 56:783, 1999
4. Vanholder R, De Smet R, Glorieux G, et al: Review on uremic toxins: classification, concentration, and interindividual variability. Kidney Int 63:1934, 2003
5. Shimoishi K, Anraku M, Kitamura K, et al: An oral adsor- bent, AST-120 protects against the progression of oxidative stress by reducing the accumulation of indoxyl sulfate in the system circulation in renal failure. Pharm Res 24:1283, 2007
6. Owada S, Goto S, Bannai K, et al: Indoxyl sulfate reduces superoxide scavenging activity in the kidneys of normal and uremic rats. Am J Nephrol 28:446, 2008
7. Meijers BK, Bammens B, De Moor B, et al: Free p-cresol is associated with cardiovascular disease in hemodialysis patients.
Kidney Int 73:1174, 2008
8. Faure V, Dou L, Sabatier F, et al: Elevation of circulating endothelial microparticles in patients with chronic renal failure. J Thromb Haemost 4:566, 2006
9. Meijers BK, Van kerckhoven S, Verbeke K, et al: The uremic retention solute p-cresyl sulfate and markers of endothelial dam- age. Am J Kidney Dis 54:891, 2009
10. Chironi GN, Boulanger CM, Simon A, et al: Endothelial microparticles in diseases. Cell Tissue Res 335:143, 2009
11. Winchester JF, Hostetter TH, Meyer TW: p-Cresol sulfate:
further understanding of its cardiovascular disease. Am J Kidney Dis 54:792, 2009
12. Dou L, Jourde-Chiche N, Faure V, et al: The uremic solute indoxyl sulfate induces oxidative stress in endothelial cells. J Thromb Haemost 5:302, 2007
13. Cheung W, Yu P, Little B, et al: Role of leptin and melanocortin signaling in uremia-associated cachexia. J Clin Invest 115:1659, 2005
14. Bostom AG, Carpenter MA, Hunsicker L, et al: Baseline characteristics of participants in the Folic Acid for Vascular Outcome Reduction in Transplantation (FAVORIT) Trial. Am J Kidney Dis 53:121, 2009
15. Rike AH, Mogilishetty G, Alloway RR, et al: Cardiovascular risk, cardiovascular events, and metabolic syndrome in renal trans- plantation: comparison of early steroid withdrawal and chronic steroids. Clin Transplant 22:229, 2008
16. Woodle ES, Peddi VR, Tomlanovich S, et al: A prospective, randomized, multicenter study evaluating early corticosteroid with- drawal with thymoglobulin in living-donor kidney transplantation.
Clin Transplant 24:73, 2010
17. Meijers B, Bammens B, DeMoor B, et al: Free p-cresol is associated with cardiovascular disease in hemodialysis patients.
Kidney Int 73:1174, 2008
18. Meijers BK, Claes K, Bammens B, et al: p-Cresol and cardiovascular risk in mild-to-moderate kidney disease. Clin J Am Soc Nephrol 5:1182, 2010
19. Liabeuf S, Barreto DV, Barreto FC, et al: Free p-cresylsulphate is a predictor of mortality in patients at different stages of chronic kidney disease. Nephrol Dial Transplant 25:1183, 2010
20. Vanholder R, Glorieux G, Lameire N, et al: Uraemic toxins and cardiovascular disease. Nephrol Dial Transplant 18:463, 2003 21. Vanholder R, Baurmeister U, Brunet P, et al: A bench to bedside view of uremic toxins. J Am Soc Nephrol 19:863, 2008
22. Taki K, Tsuruta Y, Niwa T: Indoxyl sulfate and atheroscle- rotic risk factors in hemodialysis patients. Am J Nephrol 27:30, 2007
Table 3. Correlations Between Serum p-Cresol and Indoxyl Sulphate and Selected Clinical and Biochemical
Characteristics
p-Cresol Sulfate Indoxyl Sulfate
 P  P
Albumin, g/dL ⫺3.27 .0009
Serum indoxyl-sulfate, umol/L
1.09 ⬍.0001
Urine p-cresol sulfate, umol/L
0.04 ⬍.0001
Creatinine, mg/dL 2.12 ⬍.0001
Prednisolone dose (mg) ⫺0.26 .0007
Serum p-cresol sulfate, umol/L
0.17 ⬍.0001
Urine indoxyl-sulfate, umol/L
0.01 .0329
624 HUANG, SHU, CHENG ET AL