A Step-by-Step Optimization Guide for Applying Tissue Specific
RNA in-situ Hybridization to Non-Model Plant Species
Chun-Neng Wang
(1,2), Yan-Jun Chen
(1), Yung-Chan Chang
(1)and Chun-Hsien Wu
(1)(Manuscript received 8 July 2008; accepted 11 October 2008)
ABSTRACT: Tissue specific RNA in-situ hybridization is a critical technique required for botanists to
examine exact gene expression domain within plant tissues. This powerful technique provides a way to examine the spatial and temporal patterns of gene expression of plants and animals in developmental stages content and at tissue cellular level. However, this technique has been largely hampered by difficulties of obtaining reliable protocols for non-model organism. Here we offer our lab experiences on how to optimize in-situ hybridization process among various plant species. This step-by-step guide however should not be regarded as the only solution to resolve the difficulties of RNA tissue specific RNA in-situ hybridization. Instead, the key optimization steps including tissue fixation time, proteinase/pronase treatment, probe length/content and hybridization time are priority issues to be tested first. We further summarized some recent advance of literature on alternative ways to conduct in-situ hybridization process.
KEY WORDS: digoxigenin (DIG) – labeled RNA probes, histone gene, in-situ hybridization, African violet, Titanotrichum oldhamii.
INTRODUCTION
Tissue specific RNA in-situ hybridization is a technique to detect spatial expression of target gene transcript within plant tissue. Its procedure relies on applying labeled gene complementary RNA probes, either radioactively or by chemically attached enzyme that can immunologically immobilize hybridized substrate into visible color in exact tissue position. By this way, color signal examined under microscope indicates the target gene transcripts expression domain allowing researchers to interpret gene’s possible function on plant development. This technique is therefore by no means the most direct evidence to visualize target gene’s expression domain in specific plant cellular tissue (Jackson, 1991). Thus, there is an increasingly huge demand for botanists to acquire this technique to aid their researches. However, this technique has been largely hindered because the difficulty to optimize the protocol. Thus an updated survey of RNA in-situ hybridization protocols (ISH) available from all publications and personal communications from expertise are needed.
Due to the hazard of radioisotope, modern in-situ hybridization protocols have mainly been adopted to use digoxigenin (DIG) – labeled RNA probes __________________________________________ 1. Institute of Ecology and Evolutionary Biology, Department of
Life Science, National Taiwan University, 1, Sec. 4, Roosevelt Road, Taipei 106, Taiwan.
2.Corresponding author. Tel: 886-2-33664537; Fax: 886-2- 23673374; Email: [email protected]
(Almeida Engler et al., 2002). In this paper, we aim for summarizing our lab experience on detailed procedures of DIG labeled RNA in-situ hybridization together with providing optimization suggestions among major critical steps. By following consideration of these procedures carefully, we have successfully optimized this protocol for RNA in-situ hybridization experiments among several non-model species.
Although there are several whole mount in-situ protocols available, the only successful case is restrict to the model species Arabidopsis thaliana (Zachgo et al., 2000; Ferrandiz and Sessions, 2008; Traas, 2008). Due to the difficulty of the probe penetration into plant tissue in whole mount, most ISH protocols optimized for non-model species are in fact the traditional wax-embedding sectioning (Jackson, 1991; Hileman et al., 2003; Malcomber and Kellogg, 2004; Harrison et al., 2005; Kramer, 2005; Kidner and Timmermans, 2006; Preston and Kellogg, 2007).
The criteria of a successful ISH should include a strong signal, high quality resolution and excellent selectivity detection assay plus tissue sections are well preserved. To achieve that, tissue fixation conditions, tissue digestion with optimum amount of enzymes, probe concentration, probe length and specificity, hybridization time, hybridization and washing temperature are all needed to be optimized. A reliable ISH optimization process should also be justified with good positive control and sense probe incorporation. The general consideration of each aspect is now introduced here.
Tissue fixation
Fixation is the process to kill cells by terminating any ongoing biochemical reactions and preserve their contents such as mRNA transcripts. No fixative is perfect, however, a lot is known about the various fixatives that can be used for ISH. Crosslinking fixatives are often used for ISH. It acts by creating covalent chemical bonds between proteins in tissue therefore anchors soluble proteins to the cytoskeleton, and lends additional rigidity to the tissue. Glutaldehyde is widely used by light and electron microscopy sample preparation for its extremely crosslinking efficiency in preserving cellular structure. However as glutaraldehyde is somewhat larger molecule, it may not penetrate thicker tissue specimens as effectively as formaldehyde. It is found glutaraldehyde that may overfix the material causing weak signal perhaps due to its strong crosslinking ability. Traditional fixative such as Formalin–Acetic acid–Alcohol (FAA) is another popular alternative. Its advantage is that it can penetrate the tissue well particularly for wax and hairy tissue because formaldehyde is a smaller molecule. Some fixation protocols call for a combination of formaldehyde and glutaraldehyde (Kiernan, 2000). This is because glutaraldehyde may offer a more rigid or tightly linked fixed product so that their respective strengths complement one another. Paraformaldehyde is nontheless the most gentle fixative for plant tissues we found. We thus use a combination of paraformaldehyde with glutaldehyde for all ISH treatments. The fixative we used contains 4% formaldehyde (from paraformaldehyde) dissolved in heated PBS buffer (Kramer, 2005). After adding final amount of 1% glutaraldehyde and adjusting pH to 7.0 by NaOH or H2SO4, we usually add up a final amount of 4%
DMSO (Dimethylsulfoxide) and 0.1% Tween (20 or 80). Remember not to use HCl to adjust the pH as it will release toxic fumes. The fixative then keeps fresh on ice until use. DMSO acts as an antifreeze which prevents large ice crystal formation in tissues during freezing. It also penetrates the intercellular spaces and along with Tween (detergent) helps trapped air to escape. All solution should be made by DEPC water to avoid RNase contamination.
Overfixing of plant tissue can be a serious problem for ISH. Plant tissue staying in the fixative for more than 24 hrs can cause no signal and that is often obscured by lab researchers (Kramer, 2005). It is strongly recommend that tissue should never stay in fixative for more than 18 hours (Elena Kramer,
pers comm.).
Embedding
Paraplast (wax) embedding is the typically choice for plant tissues. However the complicated ethanol exchanging process and the wax heating procedure may degrade the RNA transcripts in tissues. Particularly it is difficult to make high resolution sections of a soft tissue because the sections are exposed to high temperature (50-60°C) for paraffin infiltration. Recently technovit resin has been used as an alternative embedding reagent in several publications (Saito et al., 1999; Takechi et al., 1999; Chen and Baldwin, 2007). With this resin it is possible to perform ISH without high temperature treatments, make thin sections with high resolution, less autofluorescence, far less time consuming and good water permeability. The reason that technovit resin is not widely applied in ISH studies is because it was believed RNA probes might not penetrate tissues embedded by Technovit well (Takechi et al., 1999). But recently successful ISH publications suggest this may not be the case (Chen and Baldwin, 2007).
Our suggestion is that Technovit resin (9100) embedding could be an alternative way to wax embedding. It can be applied to tissue that is hairy or waxy. The water soluble feature of this resin provides a better infiltration for successful embedding. The detailed procedure is not discussed here but literature listed above can be good references.
Probe concentration, length and specificity Gene specific RNA probe making is the most important part required for successful ISH. Most probes are used at a final concentration of 0.5
ng/kb/μL (Coen et al., 1990; Jackson et al., 1994).
Our hybridizations are performed with 125 μL per
slide. Thus, if a probe is 0.3-kb long, the probe should require 0.3 x 125 x 0.5 = 18.75 ng. We tend to
reuspend our probe in 100X stock as 187.5 ng/μL
allowing easy calculation for working probe. The
probe amount optimization can start from running probe test with 1X and 10X (or 1X, 5X, 20X) combined with different length of probe from 150bp (carbonate hydrolysis) and 300 bp plus a slide with 10X 150 bp sense probe. This meets up 5 slides total for the initial test. Probe can be in-vitro transcribed using gene’s DNA template from linearized plasmid or direct PCR product. In our experience, we use direct PCR with T7 or SP6 primer ends for amplifying the probe DNA and this gives a better template for subsequent RNA transcription. People learning ISH usually do not aware that DIG-UTP amount can be adjusted to increase probe labeling intensity during in-vitro transcription (the Roche kit use a default 35% DIG-UTP). Several labs have been
because this gives an efficient RNA probe labeled for
difficult RNA probes (Kramer, 2005; Kidner and
Timmermans, 2006). Longer incubations times for
in-vitro transcription (up to 2 hrs) can additionally
improve the probe yield. However, the alteration of
increasing DIG-UTP:regular UTP ratio should not go too far as too much DIG (big molecules) incorporated in the probe will on the other hand decrease the probe yield.
The specificity of the probe is however a trial and error task for successful ISH. To get gene specific probe, try avoiding the probe designed from regions containing gene family domains and better locating the probe in the gene 3’ UTR region. Several leading groups around the world found that designing ISH probes from 3’UTR and avoiding conservative domains successfully give better ISH results (Preston and Kellogg, 2007; Kidner and Timmermans, 2006). The probe length should be long (>600 bp) but subsequently chopped up (carbonate hydrolysis) into about 150 bp chunks (Jill Preston, pers comm.). If a probe failed to produce any signal after a couple of the initial test mentioned above, try designing a new probe that will usually help.
Tissue pretreatment with optimum amount of enzymes digestion
Enzyme digestion is a critical step for successful ISH. Digestion enzymes act to remove nucleoproteins and make holes on cell walls allowing probe to enter cells. To judge the optimum amount and time of enzyme digestion (proteinase or pronase) could be a difficult task for ISH beginners. Insufficient digestion will prohibit probe entering cell thus result in a poor hybridization signal. On the other hand, if the sample is over digested, cell content and tissue structure will be destroyed, failing the ISH because of losing tissue mRNA. The best way to determine the digestion timing is to run a test digestion with different incubation lengths (we tend to set enzyme concentration in 1 ug/mL to reduce testing variable). Tissue sections with different test digestion times ranges from 5 mins, 10 mins, 20 mins and 30 mins are compared to justify optimum digestion. The enzyme digestion time needed will vary depending upon the tissue type, length of fixation, and size of tissue. It is necessary to compare cell content and cell wall structure of different test digestions under microscope to check the tissue integrity that is still retained upon the maximum digestion time. The use of tissue stains such as eosin Y will help to determine tissue and cell integrity by observing whether the cell content color is affected by digestion or not (Kramer, 2005). Using a positive control RNA probe which is known to hybridize with
mRNA in the tissue to determine optimum digestion time will also help (e.g. Histone 4; see below the “good positive control” section). Ideally we should choose the enzyme digestion conditions that produce the highest hybridization signal with the least disruption of tissue or cellular content morphology. The choice of enzyme is not usually the factor that may affect ISH result. However, several groups have come out a similar conclusion that pronase (mixture of protinase) may be a comprehensive enzyme suitable for ISH treatment without damaging too much plant tissue (Kidner and Timmermans 2006; Jill Preston, Univ. of Kansas, per. comm.).
Hybridization time, hybridization and washing temperature
The ISH hybridization time usually set to 14-16 hours overnight. Hybridization temperature usually ranges from 37-50°C. Initial hybridization temperature can start from 55°C for signal optimization. This makes the binding a lot more specific. If signals are weak, adjust temperature to 50°C or below. The washing temperature can be tested at a temperature 5-10°C above the hybridization temperature (55-60°C for initial trial). Good positive control and sense probe incorporation
To achieve a successful ISH, a good positive control will aid the optimization a lot. The most common choice for positive control RNA probe is histone H4A or cyclin A. Histone H4A and cyclin A RNA transcripts mark major cell division area in the plant tissue. Therefore if a histone H4A probe successfully binds to plant tissue such as meristem or rapid cell division area, it thus justify the workable condition for ISH (Matsunaga et al., 2004). On the other hand, sense probe incorporation in ISH provides the only way to critically justify whether the antisense probe signal is real or not. A clear cut successfully true ISH result shall have evident antisense signal compared to completely no signal clean background when sense probe is hybridized to the same tissue. An pair of Histone 4 degenerate primers designed from our lab seems to amplify histone H4A gene very well across a wide range of angiosperm species: SiH4-MSG-F (5’-ATGTCVG GDCGVGGAAAG-3’) and SiH4-AVT-R (5’-CCAT VGCVGTCACVGTCT-3’).
The ISH protocol we optimized has been used for expression analysis of floral symmetry gene such as
CYCLOIDEA, meristem identity genes such as STM
and vegetative organ identity gene such as
PHANTASTICA. Here below we outline our detail
procedure on African violet CYCLOIDEA floral bud ISH results as an example.
MATERIALS AND METHODS Plant material collection
Floral symmetry is a very important evolutionary trend in angiosperm flower development. Flower symmetry cultivars of African violet provide an interesting material to study floral symmetry genes’ effect on flower development. African violet is a common ornamental plant but has been reported a great difficulty in ISH optimization.
The wild type African violet is slightly zygomorphic in that the two dorsal petals of the flower are somewhat smaller than three ventral petals (Fig. 1A). However, the peloric mutant of African violet is actinomorphic because its all five petals develop into ventral parts like (Fig. 1B). Malfunction of floral symmetry genes such as CYCLOIDEA (CYC) is the probably the key developmental trigger. In Antirrhinum, the CYC transcripts presumably express only restricted to dorsal part of the flower regulating cell division thus creating a zygomorpic flower (Luo et al., 1996). We thus use this flower material to initiate insitu hybridization optimization protocol in this paper.
Fixation
1. All the solution used in ISH must be made by DEPC treated RNase free water (water with 0.05% DEPC shaking and stirring over night at room temperature under chemical hood). And all the glassware and plasticware used shall be baked or NaOH treated to be RNase free. Dissect or collect tissue and immediately submerge in ice cold, freshly prepared 4% PFA (see note 1 below). This contains 4% Paraformaldehyde (EMS, USA), 1% glutar- aldehyde (Fluka, USA), and 1XPBS (pH 7.2, 0.8% NaCl 10 mM phosphate buffer) with 4% DMSO and 0.1% Tween 20 or 0.1% Triton X-100. It is critical to use freshly prepared PFA. If collecting the sample in the field, carry an icebag/icecontainer and always place your PFA on ice.
Note 1: To dissolve paraformaldehyde power into 1X PBS could be hazardous. It is suggested to adjust 1X PBS to 11.0 with NaOH first checking with pH paper by pipetting a small drop of the solution onto it. Then heat up the 1X PBS (150 mL) to 60-70°C then mix up 6 g paraformaldehyde. Avoid breathing the fume. After cooling down the solution on ice, add the DMSO and Tween 20 plus adjusting the pH to 7.0 with 2-3 drops of H2SO4 (150 mL solution).
2. Place the tube containing the PFA and tissue into a beaker filled with ice, and place this into a desiccator. Apply vacuum slowly to samples until paraformaldehyde starts to bubble but never let it
boiling (about 400-500 bar). Vacuum infiltrate the tissue for 15 minutes. Then hold the vacuum for 15 minutes then release slowly. Repeat three times with fresh PFA each time and the tissue may sink. Vacuum infiltrate the tissue totally should not exceed 1.5 hours. Many protocols suggest that this is a necessity. However, it is common for plant materials that are very pubescent (hairy) to remain buoyant in PFA. It is more important not to over-fix your tissue than to wait for it to sink.
3. Following vacuum infiltration, the tube was refilled with fresh PFA and placed on an oscillating shaker at 4°C overnight. Protocols vary as to how long tissue should be incubated in fixative following vacuum infiltration. Never fix tissue for more than 16 hours total as overfixation may influence the results of the ISH! In the next day, the sample is dehydrated through the following ethanol series at 4°C with agitation for 45 minutes each: 1X PBS, 30% ethanol, 50% ethanol, 70% ethanol, 85% ethanol, 90% ethanol. Then go through 95% ethanol with 0.1 % eosin (50 mL water + 0.05 g Eosin Y) staining for two hours followed by another 45 minutes in 100% ethanol. After the 100% ethanol step, the solution is exchanged for fresh 100% ethanol and left overnight at 4°C. Tissue can be stored overnight or for longer periods at 4°C during the 70% ethanol stage.
Clearing
Next day the solution is exchanged for fresh 100% ethanol and incubated at room temperature for one hour. After that the tissue is subsequently incubated at room temperature in 75% ethanol/25% Histoclear (EMS, USA) for 30 mins, 50% ethanol/50% Histoclear for 30 mins, 25% ethanol/75% Histoclear (EMS, USA) for 30 mins, then 100% Histoclear for 30 mins. Repeat with 100% Histoclear.
Embedding
Tissue is transferred to a small glass bottle and added just enough fresh Histoclear to cover the tissue. Add 4 to 5 chips of Paraplast Plus chips (Sigma, USA) into the glass bottle (ca. 1/4 to 1/2 volume) and leave overnight at RT. On next day place the bottle at 42°C until the chips go into the solution. Add more chips (4 to 5) and wait until it melts completely. Change wax/histoclear with new molten paraplast. The bottle filled with paraplast was incubated overnight at 60°C. The RT and 42°C incubations are important allowing wax to slowly infiltrate the samples and thus better preserve the morphology of samples. For the next three days, exchange the paraplast with fresh molten paraplast two times each day. Wax changes shall be at least six changes spaced at least 6 hours. The sample with molten Paraplast is finally vacuumed for 30 minutes
at 60°C. The tissue is then embedded by filling molds with molten paraplast and individual samples were placed in each mold block. The molds are kept undisturbed for a while and transfer to a 4°C water bath/fridge allowing cooling overnight. The wax block can be kept in -20°C until sectioning.
Making Probe template-Probe primer design A PCR-generated probe template is produced with the sense forward primer contains SP6 polymerase promoter binding site (AGCTATTTA GGTGACACTATAGAATA-5’ probe template) and the antisense reverse primer contains sequences for a T7 polymerase promoter binding site (TTGTAAT ACGACTCACTATAGGGCGA-3’ reversed probe template) amplifying preferred from gene’s cDNA clone plasmid (Baklanov et al., 1996). Therefore subsequently in vitro transcription using T7 RNA polymerase shall give an antisense probe. Incorporation of SP6 promoter sense forward primer allows the production of a PCR-template to prepare a sense probe that can be used as a negative control. The probe PCR product is extracted with an equal volume of phenol/chloroform, then chloroform. The DNA was precipitated by adding 2 volumes 100% ethanol and 1 volume of 3 M NaOAc, incubated at -20°C for 2 hours, and centrifuged at high speed for 10 minutes. The pellet was washes with ice cold 70% ethanol at high speed for 5 minutes and allowed to air dry at room temperature. The DNA was resuspended in DEPC H2O at a concentration of 1 μg/μL.
In vitro transcription
To perform in-vitro transcription, we first make up our own 50% DIG NTP mix. This includes 1 μL of each 100 mM ATP, CTP and GTP plus 0.5 μL 100 mM UTP and 5 μL 10 mM DIG-UTP (Roche, Germany). Add 1.5 μL DEPC H2O to achieve a total
10 μL volume. Multiply the mix amount when necessary.
Each in vitro transcription is performed by adding 1 μL DNA template (1 μg), 2 μL T7 or SP6 polymerase plus 2 μL 10X transcription buffer (Roche, Germany), 2 μL 50% DIG NTP labeling mix (from above) and 1 μL RNase inhibitor. Then add up 12 μL DEPC H2O to meet up a total 20 μL reaction.
Reaction is incubated at 37°C for 2 hours and then treated with 2 μL RQ1 DNase (Promega, Madison, WI, USA) to digest the DNA template at 37°C for 15 minutes. 0.5 μL digested sample is taken and run this side by side with 0.5 μL the pre-DNase sample (set aside before DNase treatment) on an agarose gel to check the completeness of digestion. If the DNA is not eliminated, add an additional 1 μL
DNase for another 30 minutes incubation at 37°C. Once DNase completion has been confirmed, the DNase treatment is stopped by adding 2 μL 0.2 M EDTA (pH 8.0). The RNA is again precipitated by adding 2.5 μL 8 M LiCl and 150 μL 100% ethanol and incubated at -20°C for 2 hours before precipitation by centrifugation for 10 minutes at 13000 rpm 4°C. RNA pellet is washed with ice cold 70% ethanol and allow to air dry. Resuspend the pellet in 20 μL 50% deionized formamide or do further probe hydrolysis into smaller length probe as Note 2 below (resuspend in 50 μL 0.1 M NaHCO3, pH 10.2). After probe hydrolysis (Note 2), do probe quantification.
Note 2. Probe hydrolysis: If shorter probe is needed for ISH, the original long probe can undergo probe hydrolysis into shorter one. The calculation for hydrolysis time can using the formula: Time = (Li – Lf)/K(Li)(Lf) where Li is the initial length of the probe in Kb, Lf denotes the final desired length in Kb and K equals to 0.11 (Kb/min). As in our lab experience, for initial trial of a new probe for ISH, we often compare the ISH result from initial probe (>0.6 Kb) to shorter probe fragment (0.15 Kb or 0.3 Kb) to evaluate the best probe signal for subsequent analysis. Compare and justify which hydrolyzed probe fragment (0.3 or 0.15 KB in length) gives the best sensitivity and specificity with low background signal.
To hydrolyze the probe in desired length, set the following mix with correct reaction time to precipitate the probe. Incubate the RNA probe in 50 μL 0.1 M NaHCO3, pH 10.2 at 60 °C for time
calculated above. Stop the hydrolysis with 5 μL RNase-free acetic acid. Then precipitate the hydrolyzed probe by adding 5 μL 3M NaOAc and 125 μL 100% ETOH following by incubate the solution at -20°C for at least two hours. Spin at 13,000 rpm for 10 minutes at 4°C. collect the pellet and wash with 70% ETOH. Dry the pellet and resuspend it in 20 μL 50% deionized formamide. Do probe quantification as the section described above. Probe quantification
RNA probe (in 50% deionized formamide) is quantified according to manufacturer’s instructions, available at Roche website under the title “Estimating the yield of DIG-labeled Nucleic Acids” – ISH protocol page 65-70. We however replace maleic acid buffer with Tris-NaCl buffer (100 mM Tris pH 7.5; 150 mM NaCl) for a cheap alternative. Detailed modified procedure in our lab can be upon requested from the corresponding author. Probe can be stored in 50% deionized formamide at -20°C for several months or -80°C for long term.
Sectioning
From this step on, each solution and containers are required strictly RNase free. All glassware (additional bottles, graduated cylinders, conical flasks, staining dishes), slide racks, spatulas, and stir bars were baked at 200°C for 6 hours. At least 8 liters of ddH2O (milli Q) by autoclaving for 30 minutes was prepared and used for preparation of the hydration series and all diluted working solutions. Paraplast Plus embedded tissue is sectioned at 8 μm thickness on a rotary microtome (Microm, Genmany). Clean the microtome and slide warmer by
wiping with 0.2 M NaOH. Spread ribbon of sections
containing strips of 2-3 sections using wet tooth stick onto the Polysine slides (Menzel Gläser, Braunschweig, Germany) covered with DEPC H2O.
Slides with sections are placed onto a slide warmer set at 42°C allowing sections to be flattened on the surface of the water. Remaining water is drained or removed by tipping the edge of slide using Kimwipes tissues. In order for the sections to adhere properly, it is incubated at 42°C at least for 4 hours.
Dewaxing and rehydration
The following pre-hybridization steps are performed in a staining glass container in volumes of 150 mL. The slides are then placed into a metal slide rack and incubated 10 minutes in Histoclear. Repeat once with fresh Histoclear. The slides are rehydrated by procession through an ethanol series as follows: 2 minutes in 100% ethanol, 2 minutes in another fresh 100% ethanol, 2 minute in 95% ethanol, 2 minutes each in 85%, 70%, 50%, and 30% ethanol all containing 150 mM NaCl. Follow by 2 minutes in 150 mM NaCl, finally 2 minutes in 1x PBS.
Tissue pretreatment with enzymes digestion In order to allow a better penetration of the probe into the tissues, we have to pretreat the tissue by enzyme digestion. The new batch of pronase requires predigestion step when making. This is usually be done by dissolving the whole lot of enzyme into water (as 10 mg/mL stock) and incubating at 37°C for 4 hours to remove nuclease. Make aliquot of these and stored at -20°C to keep the same quality for all future ISH usage. The pronase (or proteinase K) digestion require considerable optimizations. Test digestion must be performed to decide tissue optimum digestion time (see introduction). In our experience, we found 20 minutes digestion is usually good. The slides to be treated (after PBS step above) were incubated at 37°C for 30 minutes in prewarmed pronase buffer (50 M Tris, 5 mM EDTA, pH 7.5) with 1 μg/mL Pronase (Sigma type XIV, # P-6911,USA). This can usually be done by adding 20 μL of 10 mg/mL pronase stock
into 200 mL 1X pronase buffer for tissue pretreatment. The Pronase digestion was stopped by keeping the slides in freshly prepared 1x PBS with 0.2% Glycine (Bioshop, Canada) for 2 minutes and then rinsed in 1x PBS for 2 minutes.
Post-fixation and Acetylation
The post-fixation step is to refix the tissue after pronase digestion. The slides are incubated in freshly prepared 4% paraformaldehyde for 20 minutes under a chemical hood and then rinsed in 1x PBS for 2 minutes. In order to acetylate any remaining positive charges in the slides and reduce background, the sides are incubated in freshly prepared 0.1 M triethanolamine (RDH, USA), pH 8.0 with 0.5 % acetic anhydride (J. T. Baker, USA). As acetic anhydride is unstable in water, the solution (200 mL) must be made fresh. Triethanolamine is a very sticky solution. The sample metal slide rack is slightly elevated in the container allowing stir bar vigorously stirring at the bottom. Then the sides are rinsed in 1x PBS for 2 minutes and in 150 mM NaCl for 2 minutes to proceed to dehydration series below.
Dehydration
The slides are dehydrated allowing subsequent hybridization by procession through an ethanol series as follows: 2 mins. each 30%, 50%, 70%, and 85% ethanol with 150 mM NaCl, 2 mins. in 95% ethanol, 2 mins. in 100% ethanol, and 2 mins. in another fresh 100% ethanol. The slides are allowed to air dry completely in paper towels before hybridization step. Hybridization
For each slide we use desired amount of probe (see probe concentration section in introduction) added to 50% deionized formamide to make the final volume up to 25 μL. Heat to 80°C for 2 minutes, ice, spin down and keep on ice. Add 100 µL of hybridization solution for each slide such that the volume is now 125 µL (hybe+probe) for each slide (ratio of hybe to probe is 4:1). The hybridization solution contains 1X in-situ Salt (300 mM NaCl, 10 mM Tris pH 8, 10 mM NaH2PO4 pH 6.8, 5 mM EDTA pH 8), 1X Denhardt's
solution (0.2 mg/mL Ficoll, polyvinylpyrrolidone and bovine serum albumin, Sigma D2532), 50% deionized formamide (Sigma F9037, store at 4°C), 10% (w/v) dextran sulfate (require heating to dissolve, Sigma D8906-5G) and 1 mg tRNA (Roche 109541). We usually make a large batch such as 10 mL and store the aliquot at -20°C. Mix probe and the hybridization solution with pipetting without generating bubbles. The hybridization solution is very viscous and thus difficult to pipet accurately. The slide with probe and hybridization buffer is
covered by parafilm cuttings. The slides are elevated above damp paper towels in a flat plastic box by plastic pipets to make the racks for slides. The box is placed into preheated hybridization oven at 55°C for 12-14 hours.
Post-hybridization wash and RNase treatment The following steps are now performed in a square plastic box in volume of 200 mL. After hybridization, slides were sequentially washed with fresh preheated 0.2x SSC buffer at 55°C for 1 hour with gentle agitation in an incubator. Replace the 0.2x SSC and wash again at 55°C for 60 minutes. To prepare RNase treatment, the slides are washed twice in preheated 1x NTE buffer (0.5 M NaCl, 10 mM Tris-HCl, 1 mM EDTA, pH 8.0) at 37°C for 5 minutes with gentle agitation. Then the slides are treated with 20 μg/mL RNase A (Bioshop, Canada) in preheated 1x NTE for 20 minutes to reduce unspecific background binding of probes. RNase A is able to remove single strand RNA thus increase the sensitivity of the ISH. After RNase treatment, the sides are again incubated in preheated 1x NTE at 37°C for 5 minutes. Five minutes 1x NTE wash is repeated. The slides are finally washed in preheated 0.2x SSC at 55°C for 1 hour with gentle agitation and subsequently incubated in 1x PBS at room temperature for 5 minutes.
Blocking
The following steps are changed to perform in a plastic lunch box container (allowing 12 slides to be placed side by side). To avoid anti-DIG antibody cross-reacts unspecific bindings to tissue sections, this step is required to fill the empty gap of the tissue surface with blocking reagent. Slide is placed facing up on the bottom of a plastic lunch box. Box is filled with 150 mL of 1.0% Blocking Reagent (Roche, 096176001) in 1 M Tris 7.5, 150 mL 5 M NaCl (just enough to cover the slides). The slides are incubated at room temperature for 45 minutes on an orbital shaker with gentle agitation. Blocking solution is replaced with 150 mL BSA buffer and incubated at room temperature for 20 minutes. The box is eventually incubated with new 150 mL BTNT buffer (1% BSA, 100 mM Tris pH 7.5, 150 mM NaCl, 0.3% Triton X100) at room temperature for 20 minutes.
Immunolocalization and detection
Each slide is incubated in 100 μL BTNT buffer with 0.08 μL anti-digoxigenin antibody (1:1250 dilution, Roche, Germany) for 2 hours covered by clean parafilm. To remove excess antibody, slides are washed four times for 15 minutes in BTNT buffer. Later, the slides are transferred to the G3 detection
buffer (100 mM Tris pH 9.5, 100 mM NaCl, 50 mM MgCl2) allowing slides to equilibrate to pH 9.5 for 10
minutes at room temperature. Detection is performed using anti-digoxigenin antibodies conjugated with alkaline phosphatase and NBT/BCIP (Roche 1681451) as color substrates. Each slide is incubated for 24-96 hours with 2 μL NBT/BCIP in 100 μL G3 detection buffer and coved with a cover glass in a humid box. The slides are examined using a microscope (Nikon, Laboshot-2, Düsseldorf, Germany), and photographs were taken using Canon Powershot S80.
RESULTS AND DISCUSSION Fixative effect for ISH
Different fixative can have dramatic consequence on ISH. For our African violet, Titanotrichum
oldhamii and other plants’ floral tissue, the 4%
paraformaldehyde plus 1% glutaldehyde usually give us the best result for ISH. This fixative thus appears to optimize tissue fixing among a wide range of species. During our optimization process, other fixative such as 4% paraformaldehyde makes the tissue difficult to be sectioned (Fig. 2). The inappropriate fixative can be distinguished by easily fall of sections on the slides during ethanol series. This is perhaps due to the inner part of the tissue having not been infiltrated enough by fixative. In addition, the plant tissue tends to become damaged after sectioning when observing under microscope. The edge of the tissue section become fragile is an immediate indication (Fig. 2B). On the other hand, tissue overfixing (staying over 24 hours) although can strengthen the tissue structure, the strong crosslinking effect of cellular protein may however inhibit the probe hybridization reaction.
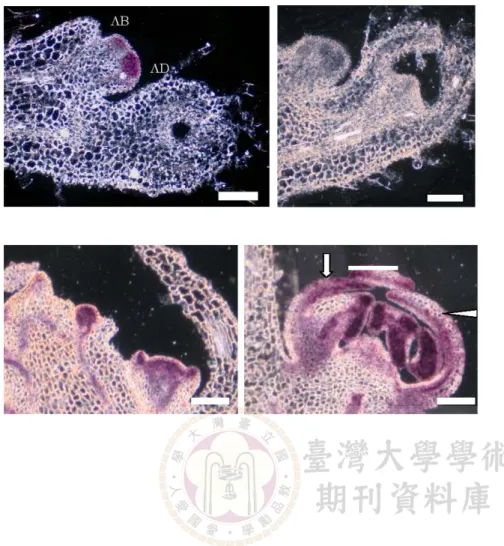
Reliable positive control for successful ISH The histone H4A gene probe in our experience provides a reliable positive control for optimizating ISH for many plant species. Histone H4A probe template is easily to be amplified with primers designed from conserved domain across many angiosperm species. As mentioned in introduction, histone H4A signals mark the active cell division region. From figure 3 the flower bud of African violet is longitudinally sectioned. Because African violet flower is zygomorphic, the dorsal part of the flower appears to gain less cell division activity than ventral parts. Thus the histone H4A ISH results here satisfy our expectation on flower developmental program. From this reliable positive control, histone H4A RNA ISH signal, we then are confident that our ISH procedure is optimized.
Fig. 1. Flower symmetry cultivars of African violet provide an interesting material to determine floral symmetry genes’ effect on flower development. A: The wild type African violet is slightly zygo- morphic in that the two adaxial (dorsal part, D) petals of the flower are somewhat smaller than three abaxial (ventral part, V) petals. B: The peloric mutant of African violet however is actinomorphic because its all five petals develop into ventral parts like (V). It is hypothesized that the malfunction of floral symmetry genes such as CYCLOIDEA (CYC) is the key developmental trigger. The
CYC transcripts presumably express
only restricted to dorsal part of the flower regulating cell division thus creating a zygomorpic flower. We therefore use this material to initiate
in situ hybridization optimization
protocol in this paper. Scale bar = 5 mm.
Fig. 2. Different fixative can have different levels of tissue structure preservation. A: Flower bud of African violet fix in 4% para- folmaldehyde with 1% GA gives a very good tissue section structure. B: When the same floral bud fixed in parafolmaldehyde only, the tissues can be easily ripping off in sections (check the cellular structure) indicating a tissue destruction due to improper fixation. Scale bar = 80 μm. Fig. 3. The Histone H4A positive control antisense probe (15X concentration) generates sharp signals on floral buds of African violet A: AD indicates the adaxial side of the flower while AB denotes abaxial side. The Histone probe indicates that during flower initiation in African violet, the adaxial side has more cell division than abaxial sides. B: The sense control in same probe concentration gives a clear signal background. Scale bar = 100 μm. Fig. 4. Floral symmetry genes
CYCLOIDEA (CYC) RNA in-situ
expression patterns in flower buds of
Titanotrichum oldhamii. A: At early
stage flower buds, CYC expression is in all parts of floral meristem except for the L1 layear. B: Later, the CYC expression has largely confined to petals tips on adaxial (dorsal) side of the flower (arrow head) but more evenly distributed in abaxial (ventral) side (triangle). This seems to correspond to the morphology that a slightly zygomorphic flower of
Titanotrichum oldhamii is developed.
Scale bar = 100 μm.
A successful ISH require strict comparison of antisense and sense probe
To justify the ISH antisense probe signal, an equal concentration of sense probe hybridized to same tissue’s section must be performed. There is no compromising concession to eliminate the sense probe ISH control. If we observed an antisense probe signal in specific region of the tissue, the sense probe must not generate hybridization signal in same position. Preferentially the sense control section should have clear signal to be detected. For example, when we study the CYCLOIDEA gene’s developmental effect on floral symmetry in
Titanotrichum, the antisense probe signal marks the
adaxial petal region at the tip (Fig. 4B). But this conclusion must be justified by comparing the sense probe signal on the same tissue. In the case of histone H4A signal of early floral bud, the sense control of
STM signal gives a promising confirmation as no
sense probe signal can be detected at all (Fig. 3B). Optimization guide and troubleshooting for successful ISH on non model species
Upon our efforts on trying different conditions of ISH, together with the survey of ISH literature, it is evident that the ISH could also be quickly optimized for non-model species given carefully following our suggested guideline here. Basically our step-by-step detailed protocol shall be followed first. If troubles are still there, try these major optimization steps here: Check your tissue fixation process. Has 4% PFA been made fresh and been kept cold? Has vacuum infiltration been applied but gentle and slowly without being a lot of bubble boiling (400-500 bar)? Do not wait tissue to be sunk as many hairy tissue will remain buoyant in PFA! When transferring clearing agent such as histoclear to paraplast wax, remember to incubate several wax chips overnight first at room temperature allowing gently exchanging histoclear with wax. And finally, before pouring your tissue wax into the mold, vacuum tissue in wax inside a heating oven will help to remove air bubbles trap inside the tissue.
Tissue pretreatment condition with pronase or proteinase must be tested (see introduction). People tend not to carefully examine the effect of different digestion time/concentration on tissue. Usually this may cause over digestion with tissue damage. Probe concentration and specificity are another major step to optimize to gain a successful ISH. As mentioned in introduction, try running probe test first with 1X and 10X (or 1X, 5X, 20X) concentration combined with different length of probe from 150 bp or 300 bp. If no signal at all follows our suggestion on probe amount optimization, consider redesign
another probe position such as gene 3’UTR end region.
We suggested the initial trial of hybridization temperature on 55°C. The ISH hybridization time with 14-16 hours is enough. If no signal with 55°C, try lower temperature to 45-50°C. The washing temperature should keep to 5-10°C higher than the hybridization temperature.
It is always a good idea to optimize positive control probe ISH first. Postive control gene probe such as histone H4A is ubiquitously expressed in all tissues at medium to high level. If positive control probe works well for your focal species ISH, the subsequent optimization to your specific gene probe will be more straightforward as most of the ISH conditions have been optimized.
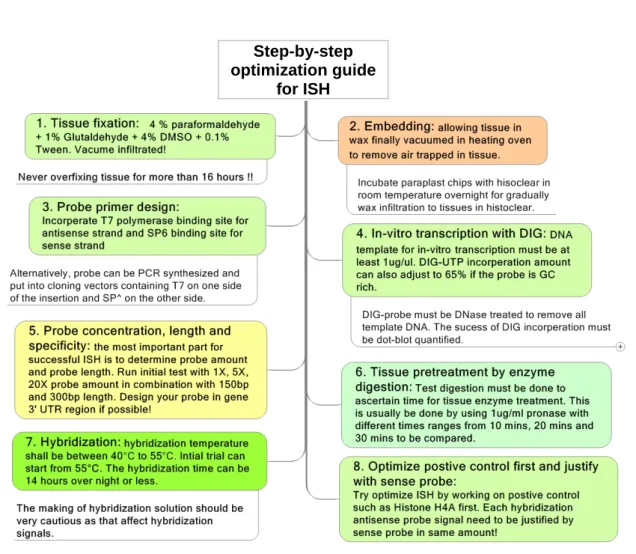
From points we discussed above, we summarize the most important optimization steps in Figure 5 as a handy guideline for ISH researchers. The most critical steps remain to be optimised for ISH thus are (1) probe length - hydrolized final product in 150 bp or 300 bp; (2) probe concentration 1X, 5X, 20X or more to be tested; (3) pronase pretreatment time to be determined; (4) hybridization temperature optimised from strigently high as 55°C (5) probe specificity – gene 3’UTR region. We sincerely hope the ISH technique can be of no such chaotic after following this optimized protocol.
ACKNOWLEDGEMENTS
The authors would like thank Elena Kramer from Harvard University and Jill Preston from Texas University for their valuable comments on how to perform ISH experiments on non-model plant species. This work was supported by a grant from National Science Council of Taiwan to C.-N. Wang (95-2311-B-002-014).
LITERATURE CITED
Baklanov,M.M., L.N.Golikova and E.G.Malygin. 1996. Effect on DNA transcription of nucleotide sequences upstream to T7 promoter. Nucleic Acids Res. 24: 3659-3660.
Chen, W. and T. C. Baldwin. 2007. An Improved Method for the Fixation, Embedding and Immunofluorescence Labeling of Resin- Embedded Plant Tissue. Plant Mol. Bio. Rep. 25: 27-35.
Coen, E. S., J. M. Romero, S. Doyle, R. Elliot, G. Murphy and R. Carpenter. 1990. floricaula: a homeotic gene required for flower development in Antirrhinum majus. Cell 63: 1311-1322.
Step-by-step optimization guide
for ISH
Fig. 5. Summarized guidelines for step-by-step optimization of tissue specific RNA in-situ hybridization techniques. The nine points listed up here emphasize key optimization steps we suggested for applying ISH to non-model plant species.
Ferrandiz, C. and A. Sessions. 2008. Preparation and Hydrolysis of Digoxygenin-Labeled Probes for In Situ Hybridization of Plant Tissues. CSH Protocols Online: doi:10.1101/pdb.prot4942. Harrison,J., M.Moller, J.Langdale, Q.Cronk and A.
Hudson. 2005. The role of KNOX genes in the evolution of morphological novelty in
Streptocarpus. Plant Cell 17: 430-443.
Hileman, L. C., E. M. Kramer and D. A. Baum. 2003. Differential regulation of symmetry genes and the evolution of floral morphologies. Proc. Natl. Acad. Sci. USA 100: 12814-12819.
Jackson, D. 1991. In-situ hybridization in plants. In: Bowles, D. J., S. J. Gurr and M. McPherson (eds.), Molecular Plant Pathology: A Practical Approach. Oxford University Press, London, UK. pp. 163-174.
Jackson, D., B. Veit and S. Hake. 1994. Expression of maize KNOTTED1 related homeobox genes in
the shoot apical meristem predicts patterns of morphogenesis in the vegetative shoot. Development 120: 405-413.
Kiernan, J. A. 2000. Formaldehyde, formalin, paraformaldehyde and glutaraldehyde: What they are and what they do. Microscopy Today 1: 8-12. Kidner, C. and M. Timmermans. 2006. In Situ
Hybridization as a Tool to Study the Role of MicroRNAs in Plant Development. In: Ying, S. C (ed.), Methods in Molecular Biology 342:
159-179, MicroRNA Protocols. Humana Press
Inc., Totowa, NJ, USA.
Kramer, E. M. 2005. Methods for studying the evolution of plant reproductive structures: comparative gene expression techniques. Method. Enzymo. 395: 617-636.
Luo, D., R. Carpenter, C. Vincent, L. Copsey and E. Coen. 1996. Origin of floral asymmetry in
Malcomber, S. T. and E. A. Kellogg. 2004. Heterogeneous expression patterns and separate roles of the SEPALLATA gene LEAFY HULL
STERILE1 in grasses. Plant Cell 16: 1692-1706.
Matsunaga, S., W. Uchida and S. Kawano. 2004. Sex-specific cell division during development of unisexual flowers in the dioecious plant Silene
latifolia. Plant Cell Physio. 45: 795-802.
Preston, J. C. and E. A. Kellogg. 2007. Conservation and divergence of APETALA1/FRUITFULL-like gene function in grasses: evidence from gene expression analysis. Plant J. 52: 69-81.
Saito, C., M. Hay Ashi, A. Sakai, M. Fujie, H. Kuroiwa and T. Kuroiwa. 1999. Improved Sensitivity for High Resolution in Situ
Hybridization Using Resin Extraction of Methyl Methacrylate Embedded Material. Biotech. Histochem. 74: 40-48.
Takechi, K., W. Sakamoto, M. Katsuhara, M. Murata, F. Motoyoshi. 1999. In situ RNA hybridization using Technovit resin in Arabidopsis thaliana. Plant Mol. Bio. Rep. 17: 43-51.
Traas, J. 2008. Whole-Mount In Situ Hybridization of RNA Probes to Plant Tissues. CSH Protocols Online; 2008; doi:10.1101/pdb.prot4944.
Zachgo, S., M. C. Perbal, H. Saedler and Z. Schwarz-Sommer. 2000. In situ analysis of RNA and protein expression in whole mounts facilitates detection of floral gene expression dynamics. Plant J. 23: 697-702.