Iron Deficiency Induces Epas1 and Iron Transport Gene Expression in
the Duodenal Cells Located at the Crypt-Villus Bottom
Kwo-Yih Yeh*, Mary Yeh
Departments of Medicine and Molecular and Cellular Physiology, LSU Health Sciences Center Louisiana, USA
(Received: 10 January 2011, accepted: 24 February 2011)
ABSTRACT
The duodenal epithelium adapting to changes in dietary iron is well appreciated, but the genes and the location of adaptation remain unclear. To examine these issues, RNAs from the crypt-villus bottom (C-pole) and the villus top (V-pole) are isolated form normal, iron deficient and iron-refed rats by gene microarrays. The expression of hypoxia inducible and iron absorptive transcripts and proteins were confirmed by RT-PCR and by Western blot respectively. In iron deficient rats, the duodenum expressed significantly higher transcription factor Arnt and Epas1 (HIf2α), and iron transport related genes such as divalent metal transporter 1 (DMT1), cytochrome b reductase (Cybrd1), ferroportin 1 (FPN1), hephaestin (Heph), heme oxygenase 1 (Hmox1), Slc39a14 (ZIP14) and Slc31a1 (Ctr1) than normal rats. Importantly, all of these genes were precociously expressed in the C-pole. In contrast, the expression of intracellular transporter Slc31a7 (Znt7) was unchanged and Slc25a37 (mitoferrin) was decreased. In iron-refed rats, when hematological criteria were recovering, the Arnt and HIf2α and most iron transport genes retained higher than normal levels, except that Heph, ZIP14 and Ctr1 returned to normal levels. The data demonstrate that dietary iron stimulates the cells at the C-pole to increase nuclear transcription factor and iron transport protein expression that is progresses to cells at the V-poles. The present data support the hypothesis that C-pole cells are responsible for dietary iron adaptation.
Key words: duodenal epithelium, microarray, hypoxia inducible factors, iron transporter, dietary iron adaptation.
Introduction
Iron is an essential nutrient required for the function of numerous proteins involving electron transfer in the mitochondrial respiratory chain, DNA synthesis, and signal transduction. Iron deficiency, a poor health condition affecting about one third of world population, results in anemia, lost physical activity and productivity, and decreased immunity. Iron in excess, however, leads to the formation of hydroxyl radicals that can cause lipid peroxidation, DNA damage, and even cell death. Iron homeostasis depends on the regulation of intestinal absorption, which is thought through hepatic hepcidin-intestinal absorptive pathway (Hentze et al., 2004; Zhang and Enns, 2009). How the hepatic hepcidin and intestinal iron transporter
interact remains incomplete known ( Hentze et al., 2004; Hentze et al., 2010; Zhang and Enns, 2009).
The intestinal epithelium is a self-renewing tissue that consists of proliferating and differentiated populations locating in the crypt and villus respectively. With perpetual renewal in the crypt-villus (CV) unit, the proliferated and young undifferentiated cells in the crypt-villus bottom are rapidly developing to differentiate functional villus cells and then died at the top of villus within 2-3 days (Hall et al., 1994; Yeh, 1977). The intestinal iron uptake from the lumen occurs in upper villus cells with high divalent metal transporter (DMT1) and ferroportin 1 (FPN1) expression (Abboud and Haile, 2000; Gunshin et.al., 1997; McKie et al., 2000), but the cells below villus tops also express the same genes, albeit at lower levers, for iron
uptake. This fact raises the question, then, as to where the regulation of iron uptake takes place (Frazer et al., 2003; Roy and Enns, 2000). The question is complicated by the ability of epithelium to receive iron from the systemic route via ferri-transferrin interacting with Trf receptor (Tfrc) on the basolateral membrane (Anderson et al., 1994; Anderson et al., 1990). Study of gene expression with iron deficiency and subsequent iron repletion could reveal which genes are adaptive to altered iron levels and whether these adaptive changes occur in the crypt or at the villus cells.
Studies to examine global gene expression in epithelial cells separated from the CV axis of the small intestine and in laser captured cells from crypts have been reported (Anderle et. al., 2005; Erwin et.al., 2006; Mariadason et al., 2005; Naishiro et al., 2005; Stappenbeck et al., 2003). Altered gene expression with differentiation, especially as related to iron metabolism has also been examined using colon cell lines that serve as a model for iron transport (Bedrine-Ferran et al., 2004; Mariadason et al., 2002; Mariadason et al., 2005). More specifically, the effects of iron deficiency on global gene expression have been reported in the duodenal mucosa identifying genes important in iron metabolism (Collins et al., 2005; Collins et al., 2008). However, remaining unknown are whether the responses to iron feeding is limited to crypt-villus cells (C-pole) or to crypt-villus top cells (V-pole) of the CV unit, and whether the responses are uniform amongst iron related genes. These unknown aspects apply to greater or lesser extents to such iron related genes as Trf and Tfrc ( O'Donnell et al., 2006), six transmembrane epithelial antigen of the prostate (Steap) (Lambe et al., 2009; Ohgami et al., 2006), Slc25a37 (mitoferrin) (Shaw et al., 2006), iron response proteins (IRPs), ferritins (Fth1 and Ftl1), Slc46a1 (HCP1 or PCFT) (Laftah et al., 2008; Qiu et al., 2006), Slc11a2 (DMT1) (Gunshin et al., 2001), cytochrome b reductase (Cybrd1)(Latunde-Dada et al., 2008), hephaestin (Heph)(Vulpe et al., 1999), Slc40a1 (FPN1) (Donovan et al., 2005) and Slc39a14 (Zip14, or Zinc transporter 14) (Gao et al., 2008; Liuzzi et al., 2006). In this vein, the iron stores regulatory protein hepcidin has been well documented to be reduced during iron deficiency
resulting in increased iron absorption ( Nicolas et al., 2001) and with iron sufficiency to suppress iron uptake by stimulating FPN1 internalization and degradation (De Domenico et al., 2007; Nemeth et al., 2004). However, hepcidin also suppresses FPN1 transcription (Nicolas et al., 2001; Pigeon et al., 2001; Yeh et al., 2004), and the molecular mechanisms behind the suppression of FPN1 transcription remains unknown. Moreover, hypoxia inducible factor 2α (Hif2α) has been reported recently to regulate DMT1 and Cybrd1, the detail molecular mechanism remain unsolved (Mastrogiannaki et al., 2009; Peyssonnaux et al., 2007; Shah et al., 2009). Whether the hepcidin suppressing and Hifs activating iron transporter gene occurs in the crypt to reprogram differentiated cells or in mature villus cells where iron uptake occurs remains unknown.
In the present study, we have taken advantage of the vertical distribution of cell compartments along the CV unit and collected from rat duodenum the bottom and top thirds of the duodenal CV unit by cryostat sectioning of duodenal mucosa (Moog and Yeh, 1973; Yeh et al., 1991)(Yeh et al.,Am. J. Physiol., in press). RNA isolated from these sections was used to study transcription factor Hifs and iron binding and transport genes by microarray analysis (Accession number GSE7970) and to confirm changes in mRNA concentrations by RT-PCR. In parallel Western analyses of cryostat sectioned samples allowed for relating protein level changes to transcript changes. The genes that exhibited a response to iron deficiency were examined following iron repletion to define patterns of iron response. These studies demonstrate that iron deficiency stimulates Arnt (arly hydrocarbon receptor nuclear translocator) and Epas1 (HIf2α), but not HIf1α, expression that play a cardinal role in the activation of iron related gene expression starting from the cells in the C-pole and propagating to cells in the V-pole. Following iron feeding, the activated genes retained at high levels at the C-pole, except Zip-14 and Heph that are subsiding to normal levels.
Animals and tissue preparation
A colony of Wister strain rats maintained in our animal quarters with Harlan Teklad 22/5 rodent chow and waster. At 32-day old, 12 rats were separated into 3 groups: One group consisting of 4 rats was fed purified rodent diet (AIN-76A, Dyet#100000), and the second group of 8 rats was fed an iron deficient diet (AIN-76A, Dyet# 115001) (Dyets, Bethlehem, PA) with distilled water ad libitum. To ensure iron deficiency, rats in the latter group were bled 1.5-2.0 ml of blood every 3 days for 2 months to ensure anemic status (one rat died in the process). Three days before sacrifice, 3 of the 7 iron deficient rats were fed water containing ferrous ammonium citrate (100 µM) for 3 days; a time allows crypt epithelial cells which have accessed newly absorbed iron to migrate to the villus tops. All animals were fasted overnight, killed by injection of pentobarbital sodium and the blood was collected through heart puncture for hemoglobin (Hgb), hematocrit (Hct) and mean corpuscular volume (MCV) determinations. A 1-cm long duodenal segment 1 cm from the pylorus was removed, rinsed with ice-cold normal saline, cut open on a 3 mm filter paper and mounted on a pre-sectioned block to allow cryostat sectioning at right angles to the crypt-villus axis (Moog and Yeh, 1973; Yeh et al., 1991). The adjacent segment was imbedded in OCT compound and longitudinally sectioned to provide the crypt depth and villus length information for the sections taken at right angles to the CV axis for the sections described above.
The mucosal sections (14 μm / section) from the villus top to the crypt bottom were sequentially collected and separated into 5 villus levels and 1 crypt level. Total RNA from different levels was isolated with Tri Reagent (Molecular Research Center, Inc), quantified spectrophotometrically, and checked for degradation with an Agilent 2100 Bioanalzyer (Agilent Technologies, Palo Alto, CA). For microarray analyses, the top two villus levels from 100 to 60 % (C-pole) and the bottom 20-0% and the crypt levels were pooled for microchip analysis as described previously (Yeh et al., Am. J. Physiol., in press). To identify differential gene expression within the crypts, 10-11 sections from
the upper and the lower crypts from 2 normal rats each were pooled and subjected to microchip analysis.
cRNA microarray analysis
Aliquots of 10 µg total RNA from the top and bottom pooled samples were used to synthesize double-stranded cDNA using a T7-(dT)24 primer
and the SuperscriptcDNA Synthesis Kit (Invitrogen, Carlsbad, CA). Biotinylated cRNA was transcribed in vitro using the GeneChip IVT Labeling Kit (Affymetrix, Santa Clara, CA) andpurified using the GeneChip Sample Cleanup Module (Affymetrix). Purified cRNA about 20 μg was fragmented hybridized to the Rat Genome 230 2.0 Array (Affymetrix). The arrays were washed, stained with streptavidin-R phycoerythrin (Vector Laboratories, Burlingame, CA) followed by 3 µg/ml biotinylated goat anti-streptavidin antibody (Vector Laboratories), stained once again with streptavidin-R phycoerythrin and were scanned using a GeneChip Scanner 3000. Pixel intensities were measured and analyzed using a commercial software package (GeneChip Operating Software 1.2,). Data mining analyses were performed with Data Mining Tool ver 3.0 (Affymetrix) algorithms and statistical analyses were performed with GeneShifter (Geospiza).
Quantitative RT-PCR
The RNA samples from each set of experiments used for microarrays were pooled and first-strand cDNA synthesized from 5 µg total RNA with random primers and the Superscript II RT kit (Invitrogen). For real time PCR, 1 µl of first strand cDNA was used as a template and mixed with a SYBR green Master mix and primer pairs (Table 1). PCR amplification was performed with the Bio-Rad iCycler with following cycling parameters: 95ºC for 5 min, 45 cycles of 95ºC for 30 s, 57ºC for 30s, and then 72ºC for 30s. In parallel, a standard curve was generated with actin using 0.0001, 0.0125, 0.05, 0.20, 0.80 and 1.60 µl of first strand cDNA.
Northern and Western analyses
Northern blots were performed for further verification of expression of some genes involved in
iron metabolism as described (Yeh et al., 2004). Random primer labeling of Si (Sucrase-isomaltase) (a gift of Dr. PG Traber), Descr4 (rat defensin 5, cloned in the laboratory) and
glyceraldehyde-3-phosphate dehydrogenase (GAPDH)(purchased
from Ambion) from cDANs were used to produce
32
P-labeled probes. The hybridization signals were detected by a PhosphoImager and quantitated with the ImageQuant software. The protein levels of selected genes were determined by western blot analysis according to established methods ( Yeh et al., 2004). The antibodies for Si, Ft, DMT1, FPN1 and Heph were generated in our laboratory (Yeh et al., 1996; Yeh et al., 2004; Yeh et al., 1989; Yeh et al., 2009; Yeh et al., 2000). Antibodies against Arnt, Hif1α, Epas1, Egln3 and Hmox1 were purchased from Santa Cruz Biotechnology (Santa Cruz, CA) and ZIP14 from Sigma Life Science (Sigma, St. Louis MO). These antibodies were against the human proteins, but in preliminary data they reacted with the rat counterparts. Antisera against HCP1 and Cybrd1 were produced in rabbits injected with KLH conjugated C-terminal animo acid sequences
of CILIGVLEKVNPHPEFQQFPQNS and
CSSEGAARKRTLGLVDTGQRSTM respectively and each antiserum produced was monospecific against HCP1 and Cybrd1 respectively (Yeh et al., 2008).
Statistical analysis
For comparison of gene expression in the crypt-villus bottom versus villus top, the student’s two tailed t-test with a P value < 0.05 and difference ≥ 1.5 were used as criterion for statistical significance. For comparisons between bottom and top gene expression in normal and iron deficient or iron-refed rats, the one-way AVOVA with Benjamin and Hochberg correction was applied using GeneShifer (Geospiza).
Results
Verification of the iron status and RNA isolation from the CV axis
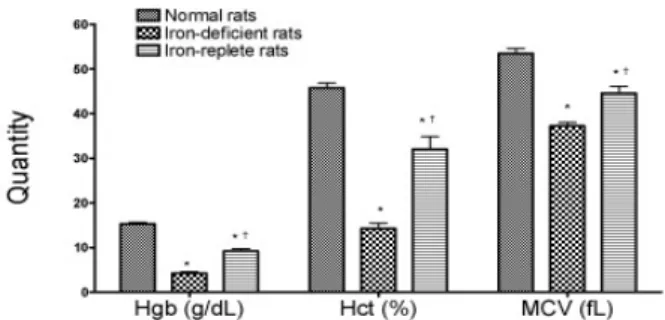
The iron status of each rat in each of the three groups was assessed by serial measurements of hemoglobin (Hgb), hematocrit (Hct) and RBC mean
Figure 1. Hemoglobin (Hgb), hematocrit (Hct) and mean corpuscular volume (MCV) of the normal, iron deficient and iron-refed rats. Data are means ± SEM from 4 normal and iron-deficient and 3 iron refed rats. P values: *P < 0.05 vs. control and † P < 0.05 vs. iron deficient rats. corpuscular volume (MCV) as shown in Figure 1. The Hgb, Hct and MCV were significantly lower in the iron deficient rats. The iron deficient rats fed iron for 3 days; the Hgb, Hct, and MCV were significantly increased approaching normal levels.
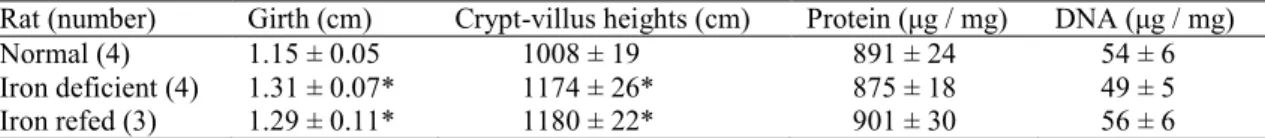
The iron deficient rats had duodenum with increased girth and thickness, and these increases did not change in iron-repletion rate (Table 1). As the DNA content per mg of tissue did not change, the increase of duodenal size was the result of increased cell numbers (Table 1). Since the mucosal layer was sectioned at a14 μm thickness, an increase from about 72 sections in the normal rats to 84 sections in the iron deficient and iron repletion rats was obtained. The sections from the top to the bottom were separated into a to f equal fractions consisting of five villi (100-80%, 80-60 %, 60-40 %, 40-20 %, and 20-0 %) and one crypt (Figure 2). The Si and Descr4 mRNAs in different fractions were determined by Northern blot analysis. Si is a brush border membrane protein known to expressed most highly in the villus tops (Doell et al., 1965) (Figure 3), whereas Descr4, a marker of Paneth cells was detected exclusively in the bottom crypt sections (Figure 3). All animal groups showed similar crypt-villus gradients (Data not shown). Based on the locations of Si and Descr4, the top two fractions (100-80% and 80-60%, or a + b) were pooled and designated as the V-pole and the bottom two fractions (20%-0% and the crypts, or e and f) were pooled and designated the C-pole. RNAs from the V-pole and C-pole were used for microarray analysis.
Table 1. The effect of dietary iron on duodenal girth, crypt-villus height and DNA and protein contents in rats. Rat (number) Girth (cm) Crypt-villus heights (cm) Protein (μg / mg) DNA (μg / mg)
Normal (4) 1.15 ± 0.05 1008 ± 19 891 ± 24 54 ± 6
Iron deficient (4) 1.31 ± 0.07* 1174 ± 26* 875 ± 18 49 ± 5
Iron refed (3) 1.29 ± 0.11* 1180 ± 22* 901 ± 30 56 ± 6
The duodenum from about 1 cm below pylorus was slit open and the girth was measured with a ruler under 10 X magnifications. The crypt-villus height was measured from 10 well-orientated crypt-villus sections for rat with an ocular meter with 100 X magnifications. Duodenal scrapes were used for protein and DNA determination as described in Materials and Methods. *P < 0.05 compared to normal.
Figure 2. Morphology of the cryostat section at the bottom of each level. The duodenal mucosa was sectioned at a right angle to the C-V axis from the tops and the crypt bottoms (See Materials and Methods). Shown is the last section of serial sections in each group representing a, b, c, d, e, and f levels. A line marker in each level represents 100 μM.
Verification of differentially expressed genes In addition to specific gene expression along the CV axis as described above, the microchip data showed that cell cycle relevant genes such as Ccnb2, Cks2, Cdk4, Cdc2a, Cdkn2, and Ccnb1 were greatly increased in the C-pole and the lipid transport genes such as Apoc2, Apoc3, Cd36, Apob, Apoa1 and Apol9a, hall marks of enterocyte differentiation, were preferentially expressed in the V-pole consistent with previous studies (Yeh et al., Am. J. Physiol., in press) (Accession number GSE7970). In additional experiments, a greater expression of genes involved in iron transport and iron binding such as Cybrd1, FPN1, Heph, ZIP14, Egln3 and Epas1 were often in upper crypts and transcripts of other groups of genes involved in iron metabolism such as Myc, Fxn (frataxin), Rrm2 (ribonucleatide
Figure 3. Northern blot analysis of Si and Descr4 mRNA in isolated cryostat sections. Total RNA was isolated from cryostat sections, separated into 6 levels from the crypt to villus and used for northern blot analyses to detect the distribution of Si and Descr4 mRNAs along the CV axis. The isolated sections show Si mRNA increasing from very low to high levels in the crypt-villus axis. Descr4 mRNA was expressed only in the crypt bottoms. GAPDH served as reference of RNA loading. Data shown is representative of all 11 rats of duodenal CV sections with a similar manner.
reductase 2), Trf, and mitoferrin (Slc25a37) were highly expressed in the bottom half of the crypts, suggesting that differential gene expression occurred spatially even within the crypts (Supplemental Table 1).
Transcript expression in the crypt-villus axis in iron deficiency and iron repletion
In searching the microarray results for iron binding and transport genes as defined by GeneShifter (Geospiza), we found that in rats fed a normal diet, there were numerous iron transport and binding genes expressed with more than 1.5-fold differences between the C-pole and the V-pole (Supplemental Table 2). Various adaptive changes were seen in rats fed iron-deficient or iron-replete
diets (Supplemental Table 3). Both hypoxia inducible factor Arnt and Epas1 and iron transport genes showed specific patterns of gene adaptation to systemic iron deficiency (Table 2). The increases of transcription factor Arnt and Epas1, but not HIf1α, were associated with the increase of transcripts for FPN1, Cybrd1, DMT1, Ctr1 and Hmox1 not only in the V-pole but also in the C-pole (Table 2). Most of the genes that were upregulated by iron deficiency were still elevated after iron refeeding except that Heph, Slc39a14, and Slc31a1 that returned to normal levels (Table 2). In contrast, the expression of Slc25a37 (mitoferrin), the transporter essential for transporting iron into mitochondria, was reduced, although marginally in the C-pole (> 1.49 fold) in iron deficiency and was reduced after iron repletion (Table 2). Steap3, the gene product that has been shown to colocalize with Tfrc in endosomes containing ferrireductase activity (Ohgami et al., 2006), was unaltered in the C-pole, but increased in the V-pole albeit with expression levels that were still significantly lower than in the C-pole. The genes associated with basolateral iron uptake including Tfrc, iron sensor iron response binding protein 2 (IRB2) (Galy et al., 2008) and oxygen sensor hypoxia inducible factor 1α (HIf1α ) were not changed (Table 2). The different responses of HIf1α and Epas1 illustrated tissue specific response associated with iron conditions.
The low mitoferrin expression in rats fed an iron deficient diet suggests that expression of genes involved in biosynthesis of heme and iron sulfur clusters would be reduced (48). Indeed, altered expression of a number of genes in these pathways were deceased either in the C-pole, the V-pole, or both poles including DNA glycosylase Mutyh (David et al., 2007), ribonucleoside-diphosphate reductase Rrm2, iron regulatory protein Aco1 and various genes in the cytochrome p450 family including Cyp2d2, Cyp2u1, Cyba, Cyp4f1, Cyp4f5, Cyp3a18, Cyp2d4v1, Cyp4f6, Cyp2j3 and Cyp2j10 transcripts in C- or V- or both poles (Supplemental Table 3).
Quantitative RT-PCR verification of some identified genes
To quantify gene expression by quantitative
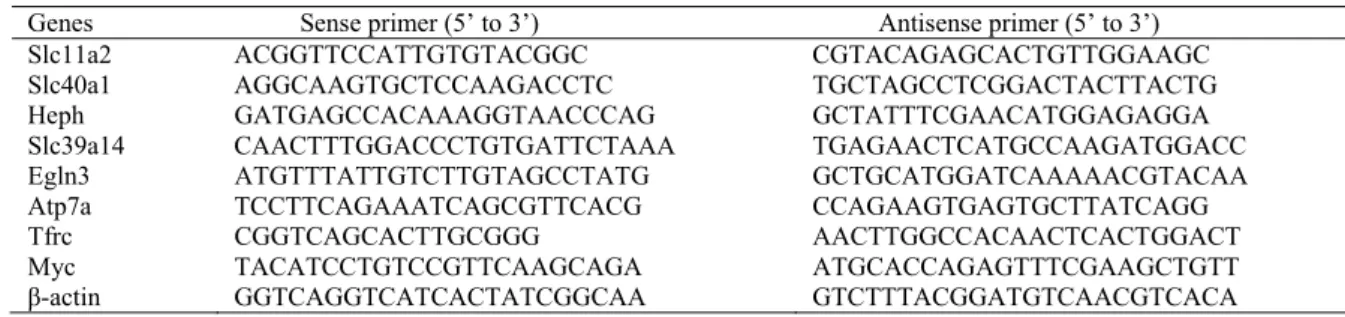
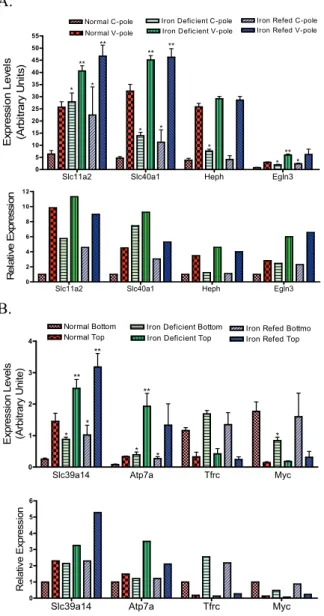
RT-PCR, 8 primer pairs for important iron binding and transport genes were synthesized as indicated (Table 3). It was found that the gene expression identified by microchips was essentially reproducible by quantitative RT-PCR (Figure 4). For example, the expression differences between C-pole and V-C-pole and the responses to iron deficiency and iron repletion, Slc11a2, Slc40a1, Heph, Egln3 (or PHD3), Slc39a14 and Atp7a were very similar with those detected by microarray (Figure 4A and 4B, top vs. bottom panels). Likewise, the patterns of expression for genes involved in other aspects of iron metabolism such as Tfrc and Myc were decreased whether detected by microarray or quantitative RT-PCR (Figure 4A and 4B, top vs. bottom panels).
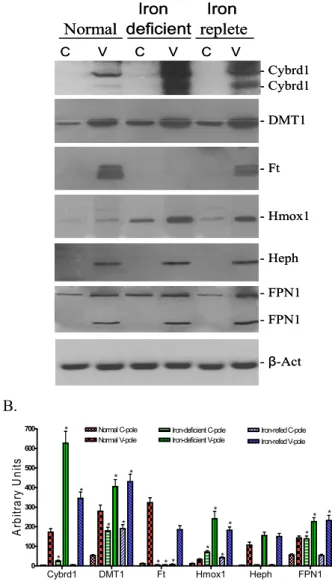
Iron transporter and binding protein expression determined by Western blots
To be functional significance, the change in mRNA expression has to be translated into the protein. Hence, we examined the protein levels for Arnt, Epas1, Egln3, Zip14 (Slc39a14), HCP1, Cybrd1, DMT1, Ft, Hmox1, Heph, FPN1 and β-act in the C- and V-poles of normal, iron deficient and iron-refed rats by Western blots. Among the determined proteins, Ft served as internal control and β-act used as the reference of protein loading (Figure 5 and 6, A and B). Transcriptional factor Arnt, and Epas1 (HIf2α ), and the feedback Egln3 proteins were increased in both the C- and V- poles in iron deficient, and such increases retained in iron refed rats. Subsequent to the increase of the transcription factors, the iron transport or binding proteins genes such as Zip14, HCP1 (combined of a high and a low mobility bands), Cybrd1 (the low mobility band), DMT1, Hmox1 and FPN1 (combined of a low and a high mobility bands) were also increased in both poles in iron deficient, and remained high except Zip14 after iron refed (Figure 5 and 6, A and B). Heph, however, remained unchanged in iron deficient and iron refed rats (Figure 6, A and B). Ft (Fth1 and Ftl1), whose transcripts is well-known to be essentially translationally regulated, was detected in modest levels at the V-poles of normal rats, was undetectable in either poles of iron deficient rats,
Table 2. Selected transcription factor and iron transport mRNAs expressed in the crypt-villus bottom and the villus top of iron deficient and iron-refed rats.
Table 3. The 9 primer pairs used for quantitative RT-PCR to detect specific gene expression. Genes Sense primer (5’ to 3’) Antisense primer (5’ to 3’)
Slc11a2 ACGGTTCCATTGTGTACGGC CGTACAGAGCACTGTTGGAAGC
Slc40a1 AGGCAAGTGCTCCAAGACCTC TGCTAGCCTCGGACTACTTACTG
Heph GATGAGCCACAAAGGTAACCCAG GCTATTTCGAACATGGAGAGGA Slc39a14 CAACTTTGGACCCTGTGATTCTAAA TGAGAACTCATGCCAAGATGGACC Egln3 ATGTTTATTGTCTTGTAGCCTATG GCTGCATGGATCAAAAACGTACAA Atp7a TCCTTCAGAAATCAGCGTTCACG CCAGAAGTGAGTGCTTATCAGG
Tfrc CGGTCAGCACTTGCGGG AACTTGGCCACAACTCACTGGACT
Myc TACATCCTGTCCGTTCAAGCAGA ATGCACCAGAGTTTCGAAGCTGTT
A.
Slc11a2 Slc40a1 Heph Egln3
0 2 4 6 8 10 12 R e la tive Exp re ssi o n B.
Figure 4. The comparison of gene expression by gene array and quantitative RT-PCR. Upper Panel of 4A and 4B: The expression levels as detected by gene array of 8 differentially expressed iron related genes, of which 6 were more highly expressed at the V-pole (Slc11a2, Slc40a1, Heph, Egln3, Slc39a14 and Atp7a) (A and B), and 2 more highly expressed at the C-pole (Tfrc and Myc) (B). The statistical values are from 4 normal and 4 iron deficient and 3 iron-refed rats. *P < 0.05 vs. crypt-bottom cells and **P < 0.05 vs. villus top cells of the normal rats. Lower Panel of 4A and 4B: Real-time RT-PCR quantitation confirming expression patterns of the same 8 genes in the upper panel shown by gene array. The quantitative RT-PCR is from pooled samples representing 3 rats from each group.
A.
B.
Figure 5. Western blots analyses of transcription factor Arnt, Hif2a and PHD3 and putative iron transporter Zip14 and HCP1. Duodenal mucosal sections from the crypt-villus bottom (C) and the villus top (V) from normal (lanes 1 and 2), iron deficient (lanes 3 and 4) and iron replete (lanes 5 and 6) rats were collected and extracted with the RIPA buffer as described in Materials and Methods. Subsequently 40 μg protein was applied to each lane for SDS-PAGE, the separated proteins transferred to nitrocellulose membranes and blotted with the indicated antiserum. β-Act serves as control. A: Western blot analysis of Arnt, HIf2α , PHD3, Zip14 and HCP1. Data shown these proteins are increased in both C- and V- poles in iron deficient rats. These increases persist after iron refed for 3 days except Zip14. A representative data calculated from 3 independent studies. B: Quantitation of proteins shown in A. Since Arnt, PHD3 and HCP1 are detected in two bands, they are calculated together. The integrated density of each protein in the Western blots was measured with NIH Image-J software and expressed as the mean of the three measurements. The data shown are calculated from 3 sets of samples. *P < 0.05 vs. the normal control.
Slc11a2 Slc40a1 Heph Egln3
0 5 10 15 20 25 30 35 40 45 50 55 Normal C-pole Normal V-pole
Iron Deficient C-pole Iron Deficient V-pole
Iron Refed C-pole Iron Refed V-pole
* * ** ** * * * ** ** * *** E xp re ssi o n L e ve ls (Arbi trary U n its )
Slc39a14 Atp7a Tfrc Myc
0 1 2 3 4 Normal Bottom Normal Top
Iron Deficient Bottom Iron Deficient Top
Iron Refed Bottmo Iron Refed Top
* * ** ** * * ** * E xpr es si on L ev el s (A rb itra ry U ni te )
Slc39a14 Atp7a Tfrc Myc
0 1 2 3 4 5 6 Re la tiv e E xpr es si on
ARNT Epas1 Egln3 Zip 14 HCP1
0 100 200 300 400 500 600 Normal C-pole Normal V-pole Iron-deficient C-pole
Iron-deficient V-pole Iron-refed C-poleIron-refed V-pole
* * * * * * * * * * * * * * * * Ar b itr at y U n its
and only reappeared in the V-pole after iron repletion (Figure 6, A and B).
Discussion
The intestinal epithelial cell proliferation and differentiation occur in rapid succession at distinct and separate zones along the CV axis. The CV axis provides, then, a model system for studying the regulation of genes involved in various aspects of cell proliferation and differentiation and for the effect of nutrients. The cryostat sectioning method for isolating tissue from different parts of the CV axis has been well established (Moog and Yeh, 1973; Yeh et al., 2000; Yeh et al., 1991). The tissues isolated with this technique not only include all important niche cells that modulate epithelial cell proliferation and differentiation (Moore and Lemischka, 2006), but also allow analyses of enzyme activity, Western blots and protein-protein interaction in defined cellular levels along the CV axis in vivo in a certain intestinal segment without previous enzyme treatment. In the current study, we analyzed the duodenal genes affected by the iron status of the animal, as it is only in this region that iron absorption occurs and iron homeostasis is regulated.
The present study found that iron deficiency resulted in the increase of duodenal mass without altering protein/DNA ratio. The same increase was also found in rats after iron repletion for 3 days. The increase of cellularity of the duodenum in iron deficient rats is consistent with an earlier report (Oates and Morgan, 1996), but a more striking increase in iron deficient rats was found in the present study, because the very proximal duodenal segment is used for this study. The proximal duodenum is more responsible for iron regulation and therefore reacts to dietary iron more vigorously. The increase of cellularity in the duodenum is also in agreement with the finding that DMT1 mutant Belgrade rats have increased cellularity in comparison to normal rats (Yeh et al., Am. J. Physiol. In press).
The increase of cellularity was further amplified by precocious expression of iron (and/or copper) transporters and iron-binding proteins in the
A.
B.
Cybrd1 DMT1 Ft Hmox1 Heph FPN1
0 100 200 300 400 500 600 700 Normal C-pole Normal V-pole Iron-deficient C-pole Iron-deficient V-pole Iron-refed C-pole Iron-refed V-pole * * * * * * * * * * * * * * * * * A rb it ra ry U n it s
Figure 6. Western blots analyses of iron transporter and related proteins as indicated in Figure 5. A: The expression of Cybrd1, DMT1, Ft, Hmox, Heph and FPN1 proteins. The protein of Cybrd1, DMT1, Hmox1 and FPN1 is increased in both C- and V- poles, while Heph do not change and Ft disappear in iron deficient rats. After iron-refed, the increased protein under iron deficiency are retained, and the Ft protein appears in the V-pole. A representative data collect from 3 independent determinations. B: Quantification of the Western blots shown in A. The integrated density of each band in the Western blots was measured with NIH Image-J software and expressed as the mean of the 3 measurements. Please note that for Cybrd1 and FPN1, two isoforms are detected, the combination of these bands is shown. *P < 0.05 vs. the normal control.
C V C V C V
Iron Iron Normal deficient replete
- Cybrd1 - Cybrd1 - DMT1 - Ft - Hmox1 - Heph - FPN1 - FPN1 - β-Act C V C V C V Iron Iron Normal deficient replete
- Cybrd1 - Cybrd1 - DMT1 - Ft - Hmox1 - Heph - FPN1 - FPN1 - β-Act
C-pole under iron deficiency. As detected by microarray, transcription factors including Arnt, Epas1 and proryl hydroxylase PHD3, and cellular iron and/or copper transporters including FPN1, DMT1, HCP1, Zip14, Slc31a1 and Atp7a transcripts in the C-pole were expressed significantly higher (Table 2). This increased expression continued and reached to the high levels in the V-pole. After iron refeeding, the increased protein expression remained higher than the normal, except Zip14 and Ctr1 that returned to normal levels (Table 2). In association with iron transporter genes, iron-binding genes such as Cybrd1, Hmox1 and Heph were also prematurely expressed in the C-pole. The premature expression of transcriptional factors and iron transport mRNAs were translated, as demonstrated in Western blots that Arnt, Epas1, Cybrd1, DMT1, Zip14, Hmox1 and FPN1 proteins had precociously appeared in the C-pole of iron deficient rats. As controls, Fth1 and Ftl1 proteins expressed modest levels in both poles in normal rats, no detectable in both poles in iron deficient rats and increased only in the V-pole in iron-fed rats.
Myc has been shown to affect cellular iron metabolism by suppressing Fth1 synthesis, and increasing Ireb2 and Tfrc expression in various cell model systems (O'Donnell et al., 2006; Wu et al., 1999). Myc, a major transcription factor that regulates at least 10% of all cellular genes for proliferation, differentiation and apoptosis (Fermandez et al., 2003; Knoepfler, 2007), was expressed in relatively higher levels in the C-pole than the V-pole in all rats (Supplemental Tables 3 and Table 2). Myc expression in the lower crypts is consistent with results obtained by laser capture or dissociated epithelial cell fractions (Bates et al., 2002; Erwin et al., 2006; Mariadason et al., 2005). In the present study, Myc expression was decreased with iron deficiency despite the increased duodenal growth, suggesting that Myc exerts limited, if any, role on duodenal epithelial cell growth. This observation is consistent with Myc being dispensable for intestinal epithelium homeostasis (Bettess et al., 2005). Coordinate changes in Fth1, Ireb2 and Tfrc have been shown to be induced by Myc ( O'Donnell et al., 2006), but the present in vivo study failed to confirm this observation.
Further protein measurement of Myc will be needed to explore the true relationship between Myc and other protein expression in the duodenal growth and gene expression.
The heterodimeric transcriptional factor HIF consists of an alpha subunit Hifα [HIf1α, Hif2α (Epas1), or Hif3α] and a Hif1β (Arnt) subunits (Wang et al., 1995). The Arnt and HIF2α protein levels increase significantly to increase transcription activity in both iron deficient and iron-fed rats. In association with the increases of Arnt and HIf2α, a parallel increase of PHD3 occurs, due to the presence of hypoxia response element in the region of the PHD3 gene (Pescador et al., 2005) (Figure 5, A and B). Since the expression of Hifα are controlled by prolyl hydroxylases (PHDs), the binding of PHDs leads to HIFα polyubituitination by the von Hippel-Lindau protein (pVHL) and subsequent degradation. The present study found that both Arnt and Epas1, but not HIf1α, are increased in iron deficient and iron-replete rats in parallel to the increase of Cybrd1 and DMT1. Since iron absorption depends on Cybrd1 and DMT1 expression that are regulated by Epas1 ( Mastrogiannaki et al., 2009; Peyssonnaux et al., 2007; 47), the tight feedback regulation of Epas1 by PHD3 is essential for controlling iron absorption.
The present study not only confirms the changes in gene expression seen during cell differentiation in the Caco2 cell line and in differential isolated cells along the CV axis (Bedrine-Ferran et al., 2004; Mariadason et al., 2005), but further identifies that duodenal genes required for iron uptake from the lumen in the C-pole of iron deficient rats. With iron deficiency, the cells in the C-pole increased protein expression of membrane bound iron transporters including DMT1, Zip14 and FPN1. This observation raises the questions as to whether during iron deficiency the cells at the C-pole play a compensatory role for epithelial cell for dietary iron uptake. With the low circulatory levels of hepcidin from low dietary iron ( Nicolas et al., 2001; Nicolas et al., 2002), the ontogenetic expression of iron transporter genes in the C-pole is expected to increase without repression. In fact, in the C-pole iron transporter FPN1 and DMT1 do increase with iron deficiency
and retained high with iron repletion. A similar pattern of expression is seen for Hmox1 and Cybrd1 in the V-pole. The observation of the de-repression at the C-pole is consistent with the hypothesis of crypt cell programming ( Roy and Enns, 2000). Unexplained, however, is the persistent elevation of DMT1, Cybrd1, FPN1 and Hmox in the V-pole with iron repletion. The possibility of Arnt and Hif2α involves in this situation will be studied.
The present western blot studies reveal different forms of Arnt, PHD3, Cybrd1, HCP1 and FPN1 that change with the iron status of the animal (Figure 5A and 6A). It is known that Arnt express as isoforms (Wang and Semenza, 1995), but the others remained uncharacterized. Most notably, PHD3, Cybrd1 and FPN1 appear to have two isoforms, which were similarly increased by iron deficiency and reduced by iron refeeding. The HCP1 is expressed as a relatively stable low molecular weight form in the C-pole and a high molecular weight form that responded to iron in the V-pole. As HCP1 has been reported to be a bi-functional protein acting both as a heme carrier protein (Shayeghi et al., 2005) and a proton coupled folate transporter (Qiu et al., 2006), it is possible that it is the larger molecular weight isoform which responds to dietary iron that plays a role in heme transport. Further studies to clarify this issue are needed.
Acknowledgments
The author (KY Yeh) would like to thank Drs. Sydney Shiau, Harry Wang and Florence Moog, and Mrs. Yanung C. Wang for early career development. This work was supported in part by NIH grants DK-65101.
References
Abboud S and Haile DJ. A novel mammalian iron-regulated protein involved in intracellular iron metabolism. J Biol Chem 275: 19906-19912, 2000.
Anderle P, Sengstag T, Mutch DM, Rumbo M, Praz V, Mansourian R, Delorenzi M, Williamson G, and Roberts MA. Changes in the
transcriptional profile of transporters in the intestine along the anterior-posterior and crypt-villus axes. BMC Genomics 6: 69, 2005. Anderson GJ, Powell LW, and Halliday JW. The
endocytosis of transferrin by rat intestinal epithelial cells. Gastroenterology 106: 414-422, 1994.
Anderson GJ, Powell LW, and Halliday JW. Transferrin receptor distribution and regulation in the rat small intestine. Effect of iron stores and erythropoiesis. Gastroenterology 98: 576-585, 1990.
Bates MD, Erwin CR, Sanford LP, Wiginton D, Bezerra JA, Schatzman LC, Jegga AG, Ley-Ebert C, Williams SS, Steinbrecher KA, Warner BW, Cohen MB, and Aronow BJ. Novel genes and functional relationships in the adult mouse gastrointestinal tract identified by microarray analysis. Gastroenterology 122: 1467-1482, 2002.
Bedrine-Ferran H, Le Meur N, Gicquel I, Le Cunff M, Soriano N, Guisle I, Mottier S, Monnier A, Teusan R, Fergelot P, Le Gall JY, Leger J, and Mosser J. Transcriptome variations in human CaCo-2 cells: a model for enterocyte differentiation and its link to iron absorption. Genomics 83: 772-789, 2004.
Bettess MD, Dubois N, Murphy MJ, Dubey C, Roger C, Robine S, and Trumpp A. c-Myc is required for the formation of intestinal crypts but dispensable for homeostasis of the adult intestinal epithelium. Mol Cell Biol 25: 7868-7878, 2005.
Collins JF, Franck CA, Kowdley KV, and Ghishan FK. Identification of differentially expressed genes in response to dietary iron deprivation in rat duodenum. Am J Physiol Gastrointest Liver Physiol 288: G964-971, 2005.
Collins JF, Hu Z, Ranganathan PN, Feng D, Garrick LM, Garrick MD, and Browne RW. Induction of arachidonate 12-lipoxygenase (Alox15) in intestine of iron-deficient rats correlates with the production of biologically active lipid mediators. Am J Physiol Gastrointest Liver Physiol 294: G948-962, 2008.
David SS, O'Shea VL, and Kundu S. Base-excision repair of oxidative DNA damage. Nature 447: 941-950, 2007.
De Domenico I, Ward DM, Langelier C, Vaughn MB, Nemeth E, Sundquist WI, Ganz T, Musci G, and Kaplan J. The molecular mechanism of hepcidin-mediated ferroportin down-regulation. Mol Biol Cell 18: 2569-2578, 2007.
Doell RG, Rosen G, and Kretchmer N. Immunochemical studies of intestinal disaccharidases during normal and precocious development. Proc Natl Acad Sci U S A 54: 1268-1273, 1965.
Donovan A, Lima CA, Pinkus JL, Pinkus GS, Zon LI, Robine S, and Andrews NC. The iron exporter ferroportin/Slc40a1 is essential for iron homeostasis. Cell Metab 1: 191-200, 2005. Erwin CR, Jarboe MD, Sartor MA, Medvedovic M,
Stringer KF, Warner BW, and Bates MD. Developmental characteristics of adapting mouse small intestine crypt cells. Gastroenterology 130: 1324-1332, 2006.
Fernandez PC, Frank SR, Wang L, Schroeder M, Liu S, Greene J, Cocito A, and Amati B. Genomic targets of the human c-Myc protein. Genes Dev 17: 1115-1129, 2003.
Frazer DM and Anderson GJ. The orchestration of body iron intake: how and where do enterocytes receive their cues? Blood Cells Mol Dis 30: 288-297, 2003.
Galy B, Ferring-Appel D, Kaden S, Grone HJ, and Hentze MW. Iron regulatory proteins are essential for intestinal function and control key iron absorption molecules in the duodenum. Cell Metab 7: 79-85, 2008.
Gao J, Zhao N, Knutson MD, and Enns CA. The hereditary hemochromatosis protein, HFE, inhibits iron uptake via down-regulation of Zip14 in HepG2 cells. J Biol Chem 283: 21462-21468, 2008.
Gunshin H, Allerson CR, Polycarpou-Schwarz M, Rofts A, Rogers JT, Kishi F, Hentze MW, Rouault TA, Andrews NC, and Hediger MA. Iron-dependent regulation of the divalent metal ion transporter. FEBS Lett 509: 309-316, 2001. Gunshin H, Mackenzie B, Berger UV, Gunshin Y,
Romero MF, Boron WF, Nussberger S, Gollan
JL, and Hediger MA. Cloning and characterization of a mammalian proton-coupled metal-ion transporter. Nature 388: 482-488, 1997.
Hall PA, Coates PJ, Ansari B, and Hopwood D. Regulation of cell number in the mammalian gastrointestinal tract: the importance of apoptosis. J Cell Sci 107 (Pt 12): 3569-3577, 1994.
Hentze MW, Muckenthaler MU, and Andrews NC. Balancing acts: molecular control of mammalian iron metabolism. Cell 117: 285-297, 2004.
Hentze MW, Muckenthaler MU, Galy B, and Camaschella C. Two to tango: regulation of Mammalian iron metabolism. Cell 142: 24-38, 2010.
Knoepfler PS. Myc goes global: new tricks for an old oncogene. Cancer Res 67: 5061-5063, 2007.
Laftah AH, Latunde-Dada GO, Fakih S, Hider RC, Simpson RJ, and McKie AT. Haem and folate transport by proton-coupled folate transporter/haem carrier protein 1 (SLC46A1). Br J Nutr: 1-7, 2008.
Lambe T, Simpson RJ, Dawson S, Bouriez-Jones T, Crockford TL, Lepherd M, Latunde-Dada GO, Robinson H, Raja KB, Campagna DR, Villarreal G, Jr., Ellory JC, Goodnow CC, Fleming MD, McKie AT, and Cornall RJ. Identification of a Steap3 endosomal targeting motif essential for normal iron metabolism. Blood 113: 1805-1808, 2009.
Latunde-Dada GO, Simpson RJ, and McKie AT. Duodenal cytochrome B expression stimulates iron uptake by human intestinal epithelial cells. J Nutr 138: 991-995, 2008.
Liuzzi JP, Aydemir F, Nam H, Knutson MD, and Cousins RJ. Zip14 (Slc39a14) mediates non-transferrin-bound iron uptake into cells. Proc Natl Acad Sci U S A 103: 13612-13617, 2006. Mariadason JM, Arango D, Corner GA, Aranes MJ,
Hotchkiss KA, Yang W, and Augenlicht LH. A gene expression profile that defines colon cell maturation in vitro. Cancer Res 62: 4791-4804, 2002.
Mariadason JM, Nicholas C, L'Italien KE, Zhuang M, Smartt HJ, Heerdt BG, Yang W, Corner GA, Wilson AJ, Klampfer L, Arango D, and Augenlicht LH. Gene expression profiling of intestinal epithelial cell maturation along the crypt-villus axis. Gastroenterology 128: 1081-1088, 2005.
Mastrogiannaki M, Matak P, Keith B, Simon MC, Vaulont S, and Peyssonnaux C. HIF-2alpha, but not HIF-1alpha, promotes iron absorption in mice. J Clin Invest 119: 1159-1166, 2009. McKie AT, Marciani P, Rolfs A, Brennan K, Wehr
K, Barrow D, Miret S, Bomford A, Peters TJ, Farzaneh F, Hediger MA, Hentze MW, and Simpson RJ. A novel duodenal iron-regulated transporter, IREG1, implicated in the basolateral transfer of iron to the circulation. Mol Cell 5: 299-309, 2000.
Moog F and Yeh KY. Intestinal alkaline phosphatase of the rat: development and distribution of activity with phenylphosphate and -glycerophosphate. Comp Biochem Physiol B 44: 657-666, 1973.
Moore KA and Lemischka IR. Stem cells and their niches. Science 311: 1880-1885, 2006.
Naishiro Y, Yamada T, Idogawa M, Honda K, Takada M, Kondo T, Imai K, and Hirohashi S. Morphological and transcriptional responses of untransformed intestinal epithelial cells to an oncogenic beta-catenin protein. Oncogene 24: 3141-3153, 2005.
Nemeth E, Tuttle MS, Powelson J, Vaughn MB, Donovan A, Ward DM, Ganz T, and Kaplan J. Hepcidin regulates cellular iron efflux by binding to ferroportin and inducing its internalization. Science 306: 2090-2093, 2004. Nicolas G, Bennoun M, Devaux I, Beaumont C,
Grandchamp B, Kahn A, and Vaulont S. Lack of hepcidin gene expression and severe tissue iron overload in upstream stimulatory factor 2 (USF2) knockout mice. Proc Natl Acad Sci U S A 98: 8780-8785, 2001.
Nicolas G, Bennoun M, Porteu A, Mativet S, Beaumont C, Grandchamp B, Sirito M, Sawadogo M, Kahn A, and Vaulont S. Severe iron deficiency anemia in transgenic mice
expressing liver hepcidin. Proc Natl Acad Sci U S A 99: 4596-4601, 2002.
O'Donnell KA, Yu D, Zeller KI, Kim J-w, Racke F, Thomas-Tikhonenko A, and Dang CV. Activation of Transferrin Receptor 1 by c-Myc Enhances Cellular Proliferation and Tumorigenesis. Mol Cell Biol 26: 2373-2386, 2006.
Oates PS and Morgan EH. Effects of dietary iron loading with carbonyl iron and of iron depletion on intestinal growth, morphology, and expression of transferrin receptor in the rat. Anat Rec 246: 364-371, 1996.
Ohgami RS, Campagna DR, McDonald A, and Fleming MD. The Steap proteins are metalloreductases. Blood 108: 1388-1394, 2006.
Pescador N, Cuevas Y, Naranjo S, Alcaide M, Villar D, Landazuri MO, and Del Peso L. Identification of a functional hypoxia-responsive element that regulates the expression of the egl nine homologue 3 (egln3/phd3) gene. Biochem J 390: 189-197, 2005.
Peyssonnaux C, Zinkernagel AS, Schuepbach RA, Rankin E, Vaulont S, Haase VH, Nizet V, and Johnson RS. Regulation of iron homeostasis by the hypoxia-inducible transcription factors (HIFs). J Clin Invest 117: 1926-1932, 2007. Pigeon C, Ilyin G, Courselaud B, Leroyer P, Turlin
B, Brissot P, and Loreal O. A new mouse liver-specific gene, encoding a protein homologous to human antimicrobial peptide hepcidin, is overexpressed during iron overload. J Biol Chem 276: 7811-7819, 2001.
Qiu A, Jansen M, Sakaris A, Min SH, Chattopadhyay S, Tsai E, Sandoval C, Zhao R, Akabas MH, and Goldman ID. Identification of an intestinal folate transporter and the molecular basis for hereditary folate malabsorption. Cell 127: 917-928, 2006.
Roy CN and Enns CA. Iron homeostasis: new tales from the crypt. Blood 96: 4020-4027, 2000. Shah YM, Matsubara T, Ito S, Yim SH, and
Gonzalez FJ. Intestinal hypoxia-inducible transcription factors are essential for iron
absorption following iron deficiency. Cell Metab 9: 152-164, 2009.
Shaw GC, Cope JJ, Li L, Corson K, Hersey C, Ackermann GE, Gwynn B, Lambert AJ, Wingert RA, Traver D, Trede NS, Barut BA, Zhou Y, Minet E, Donovan A, Brownlie A, Balzan R, Weiss MJ, Peters LL, Kaplan J, Zon LI, and Paw BH. Mitoferrin is essential for erythroid iron assimilation. Nature 440: 96-100, 2006.
Shayeghi M, Latunde-Dada GO, Oakhill JS, Laftah AH, Takeuchi K, Halliday N, Khan Y, Warley A, McCann FE, Hider RC, Frazer DM, Anderson GJ, Vulpe CD, Simpson RJ, and McKie AT. Identification of an intestinal heme transporter. Cell 122: 789-801, 2005.
Stappenbeck TS, Mills JC, and Gordon JI. Molecular features of adult mouse small intestinal epithelial progenitors. Proc Natl Acad Sci U S A 100: 1004-1009, 2003.
Vulpe CD, Kuo YM, Murphy TL, Cowley L, Askwith C, Libina N, Gitschier J, and Anderson GJ. Hephaestin, a ceruloplasmin homologue implicated in intestinal iron transport, is defective in the sla mouse. Nat Genet 21: 195-199, 1999.
Wang GL, Jiang BH, Rue EA, and Semenza GL. Hypoxia-inducible factor 1 is a basic-helix-loop-helix-PAS heterodimer regulated by cellular O2 tension. Proc Natl Acad Sci U S A 92: 5510-5514, 1995.
Wang GL and Semenza GL. Purification and characterization of hypoxia-inducible factor 1. J Biol Chem 270: 1230-1237, 1995.
Wu K-J, Polack A, and Dalla-Favera R. Coordinated Regulation of Iron-Controlling Genes, H-Ferritin and IRP2, by c-MYC. Science 283: 676-679, 1999.
Yeh K, M. Yeh, L. Mims and J. Glass. The folate transporter Slc46a1 and Slc19a1 exhibite differential expression in intestinal cells in response to iron deficiency. Gastroenterology 134: A431, 2008.
Yeh KY. Cell kinetics in the small intestine of suckling rats. I. Influence of hypophysectomy. Anat Rec 188: 69-76, 1977.
Yeh KY, Alvarez-Hernandez X, Glass J, and Yeh M. Rat intestinal and hepatic ferritin subunit expression during development and after dietary iron feeding. Am J Physiol Gastrointest Liver Physiol 270: G498-505, 1996.
Yeh KY, Yeh M, and Glass J. Hepcidin regulation of ferroportin 1 expression in the liver and intestine of the rat. Am J Physiol Gastrointest Liver Physiol 286: G385-394, 2004.
Yeh KY, Yeh M, Glass J, and Granger DN. Rapid activation of NF-kappaB and AP-1 and target gene expression in postischemic rat intestine. Gastroenterology 118: 525-534, 2000.
Yeh KY, Yeh M, and Holt PR. Differential effects of thyroxine and cortisone on jejunal sucrase expression in suckling rats. Am J Physiol Gastrointest Liver Physiol 256: G604-612, 1989.
Yeh KY, Yeh M, and Holt PR. Intestinal lactase expression and epithelial cell transit in hormone-treated suckling rats. Am J Physiol Gastrointest Liver Physiol 260: G379-384, 1991.
Yeh KY, Yeh M, Mims L, and Glass J. Iron feeding induces ferroportin 1 and hephaestin migration and interaction in rat duodenal epithelium. Am J Physiol Gastrointest Liver Physiol 296: G55-65, 2009.
Yeh KY, Yeh M, Watkins JA, Rodriguez-Paris J, and Glass J. Dietary iron induces rapid changes in rat intestinal divalent metal transporter expression. Am J Physiol Gastrointest Liver Physiol 279: G1070-1079, 2000.
Zhang A-S and Enns CA. Iron Homeostasis: Recently Identified Proteins Provide Insight into Novel Control Mechanisms. J Biol Chem 284: 711-715, 2009.
Supplemental Table 1. Changes iron related gene expression in the lower and upper crypts in normal rats. Other ID Gene ID Lower Crypt Upper Crypt Gene Name Increased expression in the upper crypt position
BF419070 Cybrd1 16.01 46.47 Cytochrome b reductase 1
NM_013173 Slc11a2 29.35 42.13 DMT1
NM_133315 Slc40a1 16.20 41.93 FPT1
NM_133304 Heph 8.10 21.59 Hephaestin
NM_019623 Cyp4f1 10.04 20.30 Cytochrome P450, family 4f1 NM_012753 Cyp17a1 4.95 15.34 Cytochrome P450, family 17a1 AA850715 Slc39a14 5.58 13.13 Iron or zinc transporter member 14 AB052846 Sc5d 5.77 11.00 Sterol-C5-desaturase homolog NM_133600 Slc31a1 5.19 10.32 Copper transporters 1
NM_012520 Cat 4.55 8.05 Catalase
NM_023025 Cyp2j4 3.52 7.66 Cytochrome P450, family 2j4 NM_019371 Egln3 2.59 6.23 EGL nine homolog 3 (C. elegans) NM_012580 Hmox1 1.94 5.32 Heme oxygenase (decycling) 1 NM_031576 Por 2.11 4.90 P450 (cytochrome) oxidoreductase
BE109206 Ireb2 2.02 4.79 IRP2
NM_031027 Dpyd 1.90 2.91 Dihydropyrimidine dehydrogenase BE329050 Egln2 1.19 2.05 EGL nine homolog 2 (C. elegans) NM_052803 Atp7a 0.30 1.79 ATPase, Cu++ transporting, a D38381 Cyp3a18 1.03 1.78 Cytochrome P450, 3a18
AI179227 Cybasc3 0.53 1.38 Cytochrome b, ascorbate dependent 3 U48219 Cyp2d4v1 0.78 1.36 Cytochrome P450, family 2d4 AI409634 Rsad2 0.22 0.65 Radical S-adenosyl methionine 2 AF120492 Atp7b 0.38 0.60 ATPase, Cu++ transporting, b BI274401 P4ha1 0.36 0.57 Proline 4-hydroxylase, alpha 1 M29853 Cyp4b1 0.21 0.55 Cytochrome P450, family 4b1 NM_012687 Tbxas1 0.22 0.45 Thromboxane A synthase 1, platelet BF417391 Slc31a2 0.14 0.29 Solute carrier family 31, member 2 AA964902 LOC691221 0.17 0.28 Similar to CG1998-PA J02585 Scd1 0.09 0.26 Stearoyl-Coenzyme A desaturase 1 NM_019184 Cyp2c 0.12 0.22 Cytochrome P450, subfamily IIC M33936 Cyp4a3 0.11 0.19 Cytochrome P450, family 4a2
NM_012740 Th 0.05 0.17 Tyrosine hydroxylase
BI283592 Aox4 0.08 0.16 Aldehyde oxidase 4 Decreased expression in the upper crypt position
NM_031841 Scd2 5.12 2.09 Stearoyl-Coenzyme A desaturase 2 NM_024359 Hif1a 3.68 2.20 Hypoxia inducible factor 1, alpha NM_031052 Mipep 2.43 1.17 Mitochondrial intermediate peptidase
U46149 Coq7 1.70 0.84 Demethyl-Q 7
BI277328 Nfu1 1.59 0.92 NFU1 iron-sulfur cluster scaffold NM_053445 Fads1 1.27 0.48 Fatty acid desaturase 1
NM_012603 Myc 1.22 0.24 Myelocytomatosis oncogene AW533321 Fads3 0.87 0.40 Fatty acid desaturase 3 U39207 Cyp4f5 0.75 0.45 Cytochrome P450 4F5
BG375952 Fxn 0.74 0.21 Frataxin
AA957260 Rrm2 0.73 0.17 Ribonucleotide reductase M2 BG374493 Cyp2j10 0.52 0.28 Cytochrome P450, family 2j10
NM_130744 Cygb 0.50 0.32 Cytoglobin
BF392959 Cyp2u1 0.42 0.21 Cytochrome P450, family 2u1
AA945178 Trf 0.35 0.01 Transferrin
AI229706 Slc25a37 0.31 0.15 Solute carrier family 25, member 37 aData are pooled lower and upper crypts from 2 rats with P < 0.01 and > 1.5 fold.
Supplemental Table 2. Iron binding and transport gene expression in C- and V- polesa. C-pole V-pole
GenBank Gene ID Bottom SEM Top SEM Gene Name
Increased expression in the V-pole
BF419070 Cybrd1 1.12 0.05 28.12 2.34 duodenal cytochrome b mRNA D38381 Cyp3a18 1.04 0.29 9.14 0.96 cytochrome P450, 3a18 AI409634 Rsad2 0.14 0.03 1.15 0.18 Best5 protein NM_133315 Slc40a1 4.71 0.68 32.26 2.85 solute carrier family 39a1 U46118 - 5.11 0.92 34.97 3.56 cytochrome P450 3A9 NM_133304 Heph 3.83 0.79 25.8 1.44 hephaestin NM_023025 Cyp2j4 3.34 0.55 20.66 1.69 CYP2J4
BE109206 Ireb2 1.89 0.15 11.64 1.04 iron-regulatory protein 2 BI294340 Slc39a14 0.25 0.04 1.45 0.26 Slc39a14
NM_031576 Por 1.68 0.14 8.23 0.61 P450 oxidoreductase NM_012753 Cyp17a1 3.99 0.91 18.55 0.85 cytochrome P450, 17 NM_016999 Cyp4b1 0.24 0.03 1.06 0.3 cytochrome P450, 4B 1 NM_133600 Slc31a1 2.37 0.37 10.24 0.69 copper transporters,1 NM_052803 Atp7a 0.08 0.02 0.33 0.02 ATPase, Cu++ transporting, a U48219 Cyp2d4v1 0.84 0.19 3.43 0.16 cytochrome P450 2d18 NM_013173 Slc11a2 6.37 1.47 25.66 2.27 solute carrier family 11a2 NM_019371 Egln3 0.77 0.18 2.96 0.19 EGL nine homolog 3 NM_019623 Cyp4f1 8.41 3.53 27.81 1.64 cytochrome P450, IVF14 NM_019144 Acp5 1.15 0.12 2.97 0.02 acid phosphatase 5
AA964229 Sfxn1 2.58 0.37 6.58 0.54 tricarboxylate carrier mRNA AB052846 Sc5d 1.93 0.32 4.82 0.66 sterol-C5-desaturase-like U39208 Cyp4f6 1.23 0.22 2.83 0.13 cytochrome P450 4F6 AI232788 Cyba 2.11 0.12 4.64 0.27 cytochrome b558 alpha NM_012580 Hmox1 0.48 0.09 0.98 0.21 heme oxygenase 1 NM_012730 Cyp2d2 0.64 0.14 1.25 0.14 Cytochrome P450, IID2 NM_080886 Sc4mol 3.2 0.48 5.57 2.14 sterol-C4-methyl oxidase-like Increased expression in the C-pole
NM_012603 Myc 1.77 0.30 0.14 0.03 v-myc oncogene homolog BE107760 Scd2 0.14 0.01 0.02 0.01 stearoyl-Coenzy A desaturase 2 NM_053445 Fads1 0.64 0.07 0.12 0.02 fatty acid desaturase 1
AA957260 Rrm2 0.63 0.09 0.14 0.02 ribonucleoside-diph reductase 2 BG375952 Fxn 1.2 0.07 0.28 0.04 Frataxin
U46149 Coq7 1.73 0.04 0.41 0.03 demethyl-Q 7
AI229706 Slc25a37 0.63 0.05 0.16 0.03 mitoferrin (LOC306000), mRNA BF417032 Tfrc 11.60 0.93 3.26 1.48 transferrin receptor
AF335281 Steap3 0.48 0.07 0.15 0.05 tumor suppressor pHyde
NM_031052 Mipep 2.44 0.18 0.78 0.1 mitochondrial intermediate peptidase AW533321 Fads3 1.01 0.1 0.37 0.03 putative fatty acid desaturase AI575254 Sfxn5 0.32 0.03 0.12 0.03 sideroflexin 5
BI277328 Nfu1 1.34 0.09 0.51 0.08 HIRA-interacting protein 5 mRNA NM_133316 Mutyh 0.28 0.05 0.11 0.03 mutY homolog (E. coli)
NM_130744 Cygb 0.87 0.08 0.38 0.04 cell activation associated protein BF283985 Ppp3cb 1.42 0.1 0.68 0.04 protein phosphatase 3b
BM387756 Srprb 2.57 0.12 1.24 0.21 similar to Ab2-417 mRNA BF392959 Cyp2u1 0.59 0.03 0.29 0.04 transcribed sequences AI102191 Cyb561d2 0.87 0.06 0.43 0.07 similar to 101F6 protein mRNA AW524453 Lias 2.05 0.16 1.06 0.09 lipoic acid synthetase mRNA BI282122 Egln1 1.43 0.07 0.81 0.07 similar to egl nine homolog 1 AA851675 Ndufs2 8.26 0.62 4.91 0.54 NADH dehydrogenase Fe-S 2 NM_031127 Suox 0.72 0.05 0.43 0.03 sulfite oxidase
AI171362 Ndufs1 6.39 0.4 4.25 0.13 RIKEN cDNA 9930026A05 mRNA a Data are means ± SEM of 4 rats with ≥ 1.5 fold and P < 0.01 between C- and V-poles.
Supplemental Table 3. Effects of iron deficiency and iron repletion on gene expression involved in iron metabolism and transport in the crypt-villus bottom (C-pole) and villus top (V-pole)a.
Normal Iron deficient Iron repleted
GenBank Gene ID C-pole V-pole C-pole V-pole C-pole V-pole Gene Name Both C- and V-poles increased expression in iron deficient and in iron-refed rats
NM_013173 Slc11a2 6.37 25.7 27.9 40.6 22.5 46.7 solute carrier family 11a2 BF419070 Cybrd1 1.12 28.1 14.8 51.7 9.2 48.41 duodenal cytochrome b NM_080886 Sc4mol 3.2 5.57 10.2 19.4 4.82 12.35 sterol-C4-methyl oxidase-like AB052846 Sc5d 1.93 4.82 5.34 9.98 3.79 6.77 sterol-C5-desaturase NM_019371 Egln3 0.77 2.96 1.95 5.97 2.38 6.18 EGL nine homolog 3 NM_012580 Hmox1 0.48 0.98 1.56 4.07 1.56 4.35 heme oxygenase 1
BI294340 Slc39a14 0.25 1.45 0.88 2.5 1.02 3.18 cDNA sequence BC021530 NM_052803 Atp7a 0.08 0.33 0.39 1.93 0.27 1.33 ATPase, Cu++ transporting a AI409634 Rsad2 0.14 1.15 0.34 4.16 0.23 3.64 Best5 protein
The C-pole alone increased expression in both iron deficient and iron-refed rats
NM_133315 Slc40a1 4.71 32.3 13.9 45.1 11.3 46.26 solute carrier family 39 a1 The C-pole increased expression in iron deficient and further increased only the V-pole afer iron-refed
NM_053445 Fads1 0.64 0.12 1.14 0.19 0.77 0.32 fatty acid desaturase 1
BE107760 Scd2 0.14 0.02 0.31 0.14 0.13 0.25 stearoyl-Coenzyme A desaturase 2 The C-pole alone increased expression in iron deficient and retuned to normal levels after iron-refed
U46118 - 5.11 35 9.02 33.8 6.51 42.65 cytochrome P450 3A9 NM_133304 Heph 3.83 25.8 7.61 29.2 4.15 28.58 hephaestin
NM_012753 Cyp17a1 3.99 18.6 6.14 12.2 4.86 12.27 cytochrome P450, subfamily 17 NM_133600 Slc31a1 2.37 10.2 4.83 11.2 2.81 10.18 solute carrier family 31a1 The C-pole increased expression only in iron refed rats
NM_031576 Por 1.68 8.23 2.44 7.94 2.63 9.15 P450 oxidoreductase The V-pole increased expression only in iron deficeint and recovered to the normal level in iron refed
NM_013065 Ppp1cb 5.86 8.45 7.07 12.8 4.48 7.57 protein phosphatase 1b Decreased expression in the V-pole of iron both in iron deficient and iron refed rats
BI285135 Slc46a1 0.11 4.66 0.16 1.67 0.23 2.73 HCP1
The V-pole increased expression only in iron refed rats
AF335281 Steap3 0.48 0.15 0.39 0.18 0.42 0.39 tumor suppressor pHyde The C-pole decreased expression in iron deficient and returned to normal levels after iron refed
NM_130744 Cygb 0.87 0.38 0.39 0.26 0.67 0.27 stellate cell activation protein NM_017043 Ptgs1 0.63 0.89 0.36 1.11 0.55 0.79 prostaglandin-endoperoxide 1 Both C- and V-poles decreased expression in iron deficient and further depressed in iron repleted rats
NM_133316 Mutyh 0.28 0.11 0.15 0.07 0.25 0.02 mutY homolog (E. coli) The C-pole decreased expresion both in iron deficient and repleted rats
AI229706 Slc25a37 0.63 0.16 0.42 0.21 0.41 0.14 mitoferrin Both the C- and V-poles decreased expression both iron deficient and iron repleted rats
BF392959 Cyp2u1 0.59 0.29 0.31 0.14 0.3 0.06 transcribed sequences NM_016999 Cyp4b1 0.24 1.06 0.15 0.47 0.13 0.55 cytochrome P450,4B1 The C-pole decreased expression only in iron refed and the V-pole decreased in iron deficient and refed
NM_012730 Cyp2d2 0.64 1.25 0.52 0.21 0.38 0.64 Cytochrome P450,IID2 The V-pole decreased expression in iron deficient and remained decreased after iron repleted rats
D38381 Cyp3a18 1.04 9.14 0.78 2.84 0.98 5.02 cytochrome P450, 3a18 AI232788 Cyba 2.11 4.64 1.65 2.14 1.62 2.13 cytochrome b558 alpha
NM_017321 Aco1 3.16 2.33 2.88 1.5 2.87 1.25 IRP1
The V-pole decreased expression in iron deficient but returned to nomal levels after iron repleted rats
NM_019623 Cyp4f1 8.41 27.8 6.51 12.2 7.11 19.18 cytochrome P450 IVF14 U48219 Cyp2d4v1 0.84 3.43 0.93 2.26 0.75 4.87 cytochrome P450 2d18 U39208 Cyp4f6 1.23 2.83 1.15 1.8 1 2.59 cytochrome P450 4F6
AI575254 Sfxn5 0.32 0.12 0.3 0.05 0.36 0.11 sideroflexin 5 The V-pole increased expression only in iron repleted rats
NM_012603 Myc 1.77 0.14 0.84 0.18 1.60 0.31 v-myc viral oncogene The V-pole increased expression only in iron repleted rats
NM_012848 Fth1 40.85 57.46 47.77 64.13 51.26 129.43 ferritin, heavy polypeptide 1 The V-pole decreased expression only in iron repleted rats
NM_017126 Fdx1 5.61 5.78 6.93 3.95 5.84 3.47 ferredoxin 1
AI171362 Ndufs1 6.39 4.25 6.18 2.98 5.3 2.33 RIKEN cDNA 9930026A05
NM_031052 Mipep 2.44 0.78 2.47 0.6 2.81 0.46 Mipep
U46149 Coq7 1.73 0.41 1.53 0.35 1.18 0.17 demethyl-Q 7
BI289098 LOC690214 0.8 0.46 0.86 0.35 0.86 0.2 peptide deformylase-like Neither C- or V-pole expression were alterred in iron deficeint or iron repreted rats
AI104240 Cycs 22.7 31.2 29.5 35.1 22.4 32.19 cytochrome c, somatic NM_023025 Cyp2j4 3.34 20.7 4.56 14.2 4.15 18.19 CYP2J4
X15030 Cox5a 20.3 19.6 23.4 17.6 21.9 14.9 cytochrome c oxidase, Va L01122 Ftl1 11.05 15.95 11.65 23.07 10.20 19.97 ferritin light chain 1 NM_017039 Ppp2ca 8.07 12.1 9.14 17 10.1 16.48 protein phosphatase 2a, α BE109206 Ireb2 1.89 11.6 2.41 12.1 1.82 11.68 iron-regulatory protein 2 M22756 Ndufv2 12.4 8.7 10.7 6.83 13.1 5.59 mitochondrial NADH DH AI232357 Cisd1 10.1 7.51 12.4 5.92 10.6 5.12 expressed mRNA AA964229 Sfxn1 2.58 6.58 3.41 5.04 3.1 5.27 tricarboxylate carrier NM_017126 Fdx1 5.61 5.78 6.93 3.95 5.84 3.47 ferredoxin 1
AA851675 Ndufs2 8.26 4.91 8.09 3.33 8.5 3.68 NADH dehydrogenase Fe-S2 NM_024359 Hif1a 4.15 3.99 3.70 5.10 3.51 4.03 hypoxia inducible factor 1, a BF417032 Tfrc 11.60 3.26 16.89 4.20 13.48 2.38 transferrin receptor NM_019144 Acp5 1.15 2.97 0.94 2.49 0.9 2.45 acid phosphatase 5 BM387756 Srprb 2.57 1.24 2.65 1.27 2.77 1.18 similar to Ab2-417 mRNA AW524453 Lias 2.05 1.06 1.91 0.95 2 0.89 lipoic acid synthetase mRNA
NM_017043 Ptgs1 0.63 0.89 0.36 1.11 0.55 0.79 PTGS1
BI282122 Egln1 1.43 0.81 1.42 0.87 1.76 1.08 similar to egl nine homolog 1
NM_031052 Mipep 2.44 0.78 2.47 0.6 2.81 0.46 Mipep
BF283985 Ppp3cb 1.42 0.68 1.49 0.64 1.26 0.46 protein phosphatase 3, beta BI277328 Nfu1 1.34 0.51 1.46 0.53 1.44 0.46 HIRA-interacting protein 5 AI102191 Cyb561d2 0.87 0.43 1.01 0.37 0.82 0.35 101F6 protein mRNA NM_031127 Suox 0.72 0.43 0.53 0.33 0.6 0.34 sulfite oxidase
AW533321 Fads3 1.01 0.37 1.12 0.33 1.49 0.31 putative fatty acid desaturase BG375952 Fxn 1.2 0.28 0.92 0.22 1.15 0.22 similar to HUMAN Frataxin aData is the gene expression ± SEM with 4 rats for the normal controls and iron-deficiency and 3 rats for iron repletion. Gene expression is categorized only if comparison of normal to iron-deficient or normal to iron repletion had ≥ 1.5 fold difference in the comparison with P < 0.05.
缺鐵誘導十二指腸腺窩絨毛底部細胞
Epas1 及鐵轉運蛋白基因的表現
葉國義* 葉瑪麗
Departments of Medicine and Molecular and Cellular Physiology, LSU Health Sciences Center Louisiana, USA (收稿日期:2011.1.10,接受日期:2011.2.24) 摘 要 目前已知十二指腸上皮細胞能適應膳食中鐵質的改變,但是有關基因以及腸道適應位置之資訊 目前並不瞭解。為了探討這些問題,我們從正常、飲食缺乏鐵質及重新攝取鐵質等三組實驗大鼠中, 將腸道腺窩-絨毛底部(C-pole)及絨毛頂部(V-pole)組織內的 RNA 分離出來,進行基因微矩陣 分析,再分別利用RT-PCR 及西方墨點法確認與缺氧及鐵質吸收相關表現的 RNA 及蛋白質。在鐵 質缺乏的大鼠組別中,其十二指腸中轉錄因子Arnt 及 Epas1(Hlf2α)的表現有顯著上升的情況; 而與鐵轉運相關的基因,如二價金屬運輸體(DMT1)、cytochrome b reductase(Cybrd 1)、ferroportin (FPN1)、hephaestin(Heph)、heme oxygenase(Hmox1)、Slc39a14(ZIP14)及 Slc31a1(Ctr1) 等,表現量也有顯著上升的情況,這些基因在絨毛底部(C-pole)都會提早表現;相較之下,細胞 內的運輸體Slc31a7(Znt7)表現量不變,而 Slc25a37(mitoferrin)的表現量卻下降。重新攝取鐵 質之大鼠經血液檢查確認鐵質濃度復原後,發現除了Heph、ZIP14 及 Ctr1 的表現量會回復至正常 值外,Arnt、Hlf2α及大部分和鐵運輸相關的基因,其表現量依然比正常值高。這些結果可以證明 膳食鐵質之攝取會刺激C-pole 到 V-pole 漸次增加其細胞核內轉錄因子及鐵轉運蛋白的表現量,我 們現有的結果支持C-pole 細胞是負責鐵質吸收適應的假說。 關鍵詞:十二指腸上皮細胞、微矩陣、缺氧誘導因子、鐵轉運蛋白、膳食鐵適應