http://nnr.sagepub.com
Neurorehabilitation and Neural Repair
DOI: 10.1177/1545968306294729
2007; 21; 233 originally published online Mar 9, 2007; Neurorehabil Neural Repair
Yu-Wei Hsieh, Chun-Hou Wang, Shwu-Chong Wu, Pau-Chung Chen, Ching-Fan Sheu and Ching-Lin Hsieh
Establishing the Minimal Clinically Important Difference of the Barthel Index in Stroke Patients
http://nnr.sagepub.com/cgi/content/abstract/21/3/233
The online version of this article can be found at:
Published by:
http://www.sagepublications.com On behalf of:
American Society of Neurorehabilitation
can be found at: Neurorehabilitation and Neural Repair
Additional services and information for
http://nnr.sagepub.com/cgi/alerts Email Alerts: http://nnr.sagepub.com/subscriptions Subscriptions: http://www.sagepub.com/journalsReprints.nav Reprints: http://www.sagepub.com/journalsPermissions.nav Permissions: http://nnr.sagepub.com/cgi/content/refs/21/3/233 Citations
at National Taiwan Univ Library on April 15, 2009
http://nnr.sagepub.com
Difference of the Barthel Index in Stroke Patients
Yu-Wei Hsieh, MS, Chun-Hou Wang, Shwu-Chong Wu, PhD,
Pau-Chung Chen, PhD, Ching-Fan Sheu, PhD, and Ching-Lin Hsieh, PhD
Background. The interpretation of the change scores of the
Barthel Index (BI) in follow-up or outcome studies has been hampered by the fact that its minimal clinically important dif-ference (MCID) has not been determined. Objective. This arti-cle was written to establish the MCID of the BI in stroke patients. Methods. Both anchor-based and distribution-based methods were used to establish the MCID. In the anchor-based method, 43 stroke inpatients participated in a follow-up study designed to determine the MCID of the BI using patients’ global ratings of the activities of daily living function on a 15-point Likert-type scale. The mean change scores on the 20-point scale of the BI of the MCID group, based on the patients’ ratings on the Likert-type scale, served as the first estimate of the MCID. In the distribution-based method, 56 chronic stroke patients participated in the test-retest reliabil-ity study to determine the MCID of the BI. One standard error of measurement (SEM) served as the second estimate for the MCID. The larger MCID value of the 2 estimates was chosen as the MCID of the BI. Results. In the anchor-based study, there were 20 patients in the MCID group, with a mean change score of 1.85 points (ie, the first MCID estimate). In the distribution-based study, the SEM based on test-retest agreement was 1.45 points (ie, the second MCID estimate). The MCID of the BI in stroke patients was estimated to be 1.85 points. Conclusion. The authors’ results, within the limi-tations of their design, suggest that if the mean BI change score within a stroke group has reached 1.85 points in a study, the change score on the BI can be perceived by patients as
important and beyond measurement error (ie, such a change score is clinically important).
Key Words: Minimal clinically important difference—Barthel
Index—Stroke.
D
etermining whether the change scores of patients on instruments are clinically important is criti-cal in interpreting the results of studies (eg, interpretation of score changes on outcome measures).1,2 Most previous studies have commonly examined and reported statistically significant differences of change scores on instruments. However, a statistically signifi-cant difference does not necessarily mean a clinically important difference, which is more meaningful for both clients and clinicians.3-5To target the differences that are clinically important within a group over time, the minimal clinically important difference (MCID) of an instrument, which is the lowest benchmark by which to determine whether or not the differences are clini-cally important,1,6has to be determined. The MCID of an instrument can be used to determine whether the change scores indicate true and meaningful changes in follow-up or outcome studies.1,7The MCID of an instrument can be determined via anchor-based or distribution-based methods.8 Anchor-based methods take the external criteria that are clini-cally relative as the anchors (or references) for determining the MCID via longitudinal or cross-sectional approaches. Longitudinal approaches are preferable to cross-sectional approaches because longitudinal ones are more directly linked with change.9Among longitudinal approaches, the method of patient global rating of change is commonly used and especially well suited for assessing perception of change from the individual patient’s perspective.9,10
Distribution-based methods are based on the statisti-cal characteristics of scores of the obtained sample.9Three types of distribution-based methods are based on statisti-cal significance, sample variation, and measurement pre-cision.9Among distribution-based methods, the method of the standard error of measurement (SEM), which is based on measurement precision, is most promising for establishing the MCID for 3 reasons.9First, this method From the School of Occupational Therapy, College of Medicine,
National Taiwan University, Taipei, Taiwan (Y-WH, C-LH); School of Physical Therapy, College of Medical Technology, Chung Shan Medical University, Taichung, Taiwan (C-HW); Graduate Institute of Health Policy and Management, College of Public Health, National Taiwan University, Taipei, Taiwan (S-CW); Institute of Occupational Medicine and Industrial Hygiene, National Taiwan University College of Public Health, Taipei, Taiwan (P-CC); Institute of Cognitive Science, National Cheng Kung University, Tainan, Taiwan (C-FS); Department of Physical Medicine and Rehabilitation, National Taiwan University Hospital, Taipei, Taiwan (C-LH).
Address correspondence to Ching-Lin Hsieh, School of Occupational Therapy, College of Medicine, National Taiwan University, 4F., No.17, XuZhou Rd., Taipei 100, Taiwan. E-mail: clhsieh@ntu.edu.tw. Hsieh Y-W, Wang C-H, Wu S-C, Chen P-C, Sheu C-F, Hsieh C-L. Establishing the minimal clinically important difference of the Barthel Index in stroke patients. Neurorehabil Neural Repair 2007;21:233–238. DOI: 10.1177/1545968306294729
takes into account both the amount of error inherent in the instrument and the amount of random variation that can be expected in repeated administrations. Second, it is not influenced to a large degree by the sample size or vari-ability of the change.9Third, it is sample-independent (ie, the SEM is considered to be a fixed characteristic of the measure, regardless of the sample of subjects under inves-tigation).11 Therefore, using both methods, the patient global rating of change (anchor-based method) and the SEM (distribution-based method), in a study can deter-mine that the MCID is actually the result of the patients’ perceptions of change and beyond measurement error.9
The 20-point scale of the Barthel Index (BI) has been commonly used in assessing activities of daily living (ADLs), which is a main outcome indicator in stroke patients.12 The psychometric properties of the BI in stroke patients have been shown to be satisfactory.13-17 However, the MCID of the BI is still unknown, which has limited the interpretations of the mean change scores of a group of patients on the BI in outcome or fol-low-up studies. The purpose of this study was to com-bine the anchor-based and distribution-based methods to establish the MCID of the BI in stroke patients.
METHODS
This study had 2 parts: 1) the anchor-based study, which was a follow-up study to estimate the MCID of the BI using patients’ global ratings of ADL function on a Likert-type scale as an anchor, and 2) the distribution-based study, which was a test-retest reliability study to estimate the MCID of the BI using 1 SEM as the crite-rion.18The larger MCID value of these 2 estimates was treated as the MCID of the BI in this study to ensure that the value of the MCID results from the patients’ percep-tions and exceeds the measurement error. The study pro-tocol was approved by a local institutional review board.
Subjects
Anchor-Based Study. In the anchor-based study, we had
to recruit patients with a possibility of change on ADL function. Thus, we included stroke inpatients receiving intensive occupational therapy programs, who were assumed to have the possibility of change on ADL func-tion for estimating the MCID of the BI. Participants were recruited from the Departments of Physical Medicine and Rehabilitation of 3 hospitals in Taiwan between September 2004 and July 2005. Patients were eligible for this study according to the following inclu-sion criteria: 1) diagnosis (International Classification of Diseases, Ninth Revision Clinical Modification
codes) of cerebral hemorrhage (431), cerebral infarction (434), or others (430, 432, 433, 436, 437, 438); 2) those who were inpatients and were referred to occupational therapy; 3) no communication difficulty (eg, aphasia, severe hearing impairment); 4) absence of other major deficits (eg, brain tumor, fracture, amputation). Patients with Mini-Mental State Examination (MMSE) scores lower than 20 were excluded.
Distribution-Based Study. Patients in the
distribution-based study, which was designed for determining the SEM of the BI, were required to have stable ADL function to examine test-retest reliability.19Thus, only the patients who had had a stroke at least 6 months prior were assumed to have stable ADL function and were recruited in the distribution-based study. Patients who had had a stroke at least 6 months before were recruited from the Chung Shan Medical University Rehabilitation Hospital in Taichung, Taiwan. The other selection criteria, that is, diagnosis, communication ability, absence of other major deficits, were the same as in the anchor-based study.
For both parts of this study, only patients or their proxies who gave informed consent participated in the study. Demographic and diagnostic information on patients was collected from medical records.
Procedures
Anchor-Based Study. At baseline assessment (at patient’s
admission to occupational therapy), the BI was admin-istered to the patients. At follow-up assessment (at dis-charge or 4 weeks after baseline assessment), the BI and a 15-point Likert-type scale, measuring the patients’ perceptions of the magnitude of change in ADL func-tion since admission, were administered to the patients by an occupational therapist. An occupational therapist administered the BI to the patient and/or the patient’s main caregiver by face-to-face interview. The therapist rated the BI scores for the patients based on the actual performance of the patients in daily life.
Distribution-Based Study. The BI was administered to the
patients with stable conditions twice at an interval of 2 weeks by a trained rater. To ensure that the patients’ con-ditions were stable during the study period, any patients who developed other medical conditions or recurrent strokes during the test-retest period were excluded.
Instruments
The BI was developed to assess ADL function in per-sons with neurological or musculoskeletal disorders.20 Hsieh et al
The BI comprises 10 items about basic ADL: feeding, grooming, bathing, dressing, bowel care, bladder care, toilet use, ambulation, transfers, and stair climbing.20 The total score range of the BI is from 0 to 20.
The 15-point Likert-type scale (–7 to +7)6was used to assess the patients’ perceptions of the magnitude of change of independence level in ADL function from admission to the date of interview. At follow-up assess-ment, the patients were asked to answer the following question: “Compared with your condition at admission to the department of occupational therapy, has there been any change in your independence level of actually doing activities of daily living?” If patients stated that there had been “no change,” they were given a score of zero. If they stated that their condition was “better” or “worse,” they were asked, “How much ‘better’ or ‘worse’ would you rate your independence level of actually doing activities of daily living?” and were offered the 7-point response options. They were +7 (a very great
deal better) to +1 (almost the same, hardly any better at all) for “better”, –7 (a very great deal worse) to –1 (almost the same, hardly any worse at all) for “worse,” and 0 for
“no change” (see appendix).6Patients were classified as the MCID group if their ratings fell within the ranges of +2 to +3 (a little better to somewhat better) or –2 to –3 (a little worse to somewhat worse).3The patients in the MCID group were considered as having experienced a minimal important change.3 In addition, those with scores of 0, +1, or –1 were considered as having nearly no change. Those with scores of +4 to +7 or –4 to –7 were considered as having experienced moderate to large change.
The MMSE was developed to assess cognitive status, and its total score ranges from 0 to 30.21A score of 20 on the MMSE was reported as an optimal cutoff point for illiterate or minimally educated elderly Chinese.22
Data Analysis
Anchor-Based Study. The mean change score on the BI,
corresponding to patients’ ratings of +2 to +3 or –2 to –33who are defined as the MCID group on the 15-point Likert-type scale, served as the first estimate for the MCID of the BI.
Distribution-Based Study. The SEM is used to detect a
real change of subjects in groups.23,24The SEM was cal-culated as the square root of the within-subject error variance (ie, SEM = √WM——–S) from the 2-way ANOVA model on test-retest reliability data.23-25A real change is claimed when the value of mean change in a group of subjects is greater than an SEM. In this study, one SEM served as the second estimate for the MCID of the BI.18
On the other hand, the smallest real difference (SRD) is used to detect a real change between 2 mea-surements for a single subject.23,24,26,27The SRD was cal-culated as 1.96 × SEM × √2–(1.96 because of the 95% confidence interval, √2– because of the change scores between 2 measurements).26,27 That is, for a single subject whose change on repeated measurements is at least greater than or equal to the SRD, the change can be claimed as real change with 95% confidence level. In this study, the BI change score of an individual stroke patient has to reach an SRD to be viewed as indicative of real change.
RESULTS
Anchor-Based Study
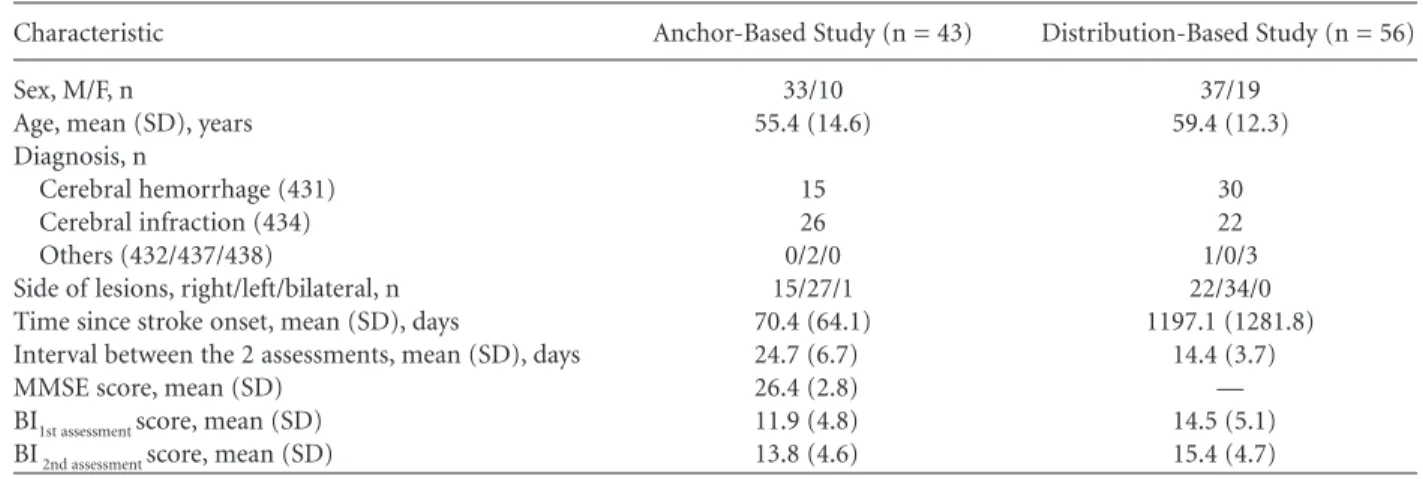
A total of 54 patients with stroke were recruited in the anchor-based study and completed the baseline assessment, but 11 of them were lost to follow-up because they were discharged directly from the wards without the therapists being informed, or the patients had other major medical conditions during the follow-up period. The remaining 43 patients (79.6%) com-pleted both assessments, and their data were analyzed in the study. Demographic and clinical characteristics of the 43 patients are shown in Table 1. Their mean age was 55 years, and 33 (76.7%) were male. There were 15 patients with ICD-9 code 431, 26 patients with code 434, and 2 patients with code 437. There were 15 patients with right hemisphere lesions, 27 patients with left hemisphere lesions, and 1 patient with bilateral hemisphere lesions. The average number of days after stroke onset was approximately 70, indicating that the patients were in the subacute stroke stage. The mean interval between baseline and follow-up assessment was 25 days. The patients’ mean BI baseline score was 11.9 points, indicating that their disability level was moderate.
The 43 patients were divided into 3 groups based on their ratings of ADL function on the Likert-type scale. No patient rated his or her independence level of doing ADL during the study periods as worse. The no-change group, with 10 patients, had nearly no change (ie, Likert-type rating: 0, 1); the MCID group, with 20 patients, had minimal change (ie, Likert-type rating: 2, 3); the substantial change group, with 13 patients, had moderate to large change (ie, Likert-type rating: 4 to 7). The mean BI scores of the MCID group were 11.45 at baseline assessment and 13.30 at follow-up assessment. The mean BI change score of the MCID group was 1.85, making the first estimate of the MCID of the BI (Table 2).
Distribution-Based Study
A total of 61 stroke patients were assessed in the pretest, but 5 of them did not complete the posttest owing to either refusal to participate in the posttest or loss of contact. In the end, 56 patients (91.8%) com-pleted both assessments, and their data were analyzed in the study. Demographic and clinical characteristics of the 56 patients are shown in Table 1. Their mean age was 59 years, and 37 (66%) were male. There were 30 patients with ICD-9 code 431, 22 patients with code 434, 3 patients with code 438, and 1 patient with code 432. There were 22 patients with right hemisphere lesions, and 34 patients with left hemisphere lesions. The average patients’ time after stroke onset was 39.6 months, indicating that they were in the chronic stroke stage. The mean interval between pretest and posttest was 14 days. The mean BI scores of the 56 patients were 14.5 points at pretest. The results indicate that their dis-ability level was moderate to mild.
The within-subject error variance was 2.09, and thus the SEM was 1.45, making the second estimate of the MCID of the BI (Table 2). In addition, the SRD of the BI was 4.02 points.
The larger of the 2 MCID estimates was 1.85, which is suggested as the MCID of the BI in stroke patients.
DISCUSSION
To the best of our knowledge, this study was the first to determine the MCID of the BI in stroke patients. Our results will help researchers interpret whether the change scores within a stroke group have reached the MCID in outcome or follow-up studies. Because the first estimate of the MCID of the BI was derived from patients with improvement in their ADL function, the data of this study are only applicable for improvement, not for deterioration. In research settings, if a stroke group achieves an average of 1.85 points of improve-ment on the BI, they are likely to have a reproducible and clinically important change in their ADL function. Conversely, if the mean improvement of a stroke group is less than 1.85 points, the change may not be clinically meaningful.
The MCID indicates true and meaningful within-group changes1,7; thus, the MCID is a better benchmark than traditional usage of the statistical significance (eg,
P < .05) to determine whether the change scores are
important or an intervention is effective. Using the P value to interpret the mean change score is influenced by not only the extent of change (effect) but also the sample size and the group variance of the study.9Thus, if the mean BI improvement score within a stroke group is smaller than the MCID of 1.85 points, even though the change score has reached a statistically significant level (P < .05), the change should not be viewed as a true and important change. Conversely, if the mean BI improvement score exceeds 1.85 points, even if the change score has not reached statistical significance (P > .05), the change may be clinically relevant.
The MCID is also critical for examining the respon-siveness of an instrument. For example, one study examined the responsiveness of the BI in a stroke group living at home.28The mean change on the BI was only 0.5 points (much less than 1.85 points), but its effect Hsieh et al
236 Neurorehabilitation and Neural Repair 21(3); 2007
Table 1. Demographic and Clinical Characteristics of the Patients in This Study
Characteristic Anchor-Based Study (n = 43) Distribution-Based Study (n = 56) Sex, M/F, n 33/10 37/19
Age, mean (SD), years 55.4 (14.6) 59.4 (12.3) Diagnosis, n
Cerebral hemorrhage (431) 15 30 Cerebral infraction (434) 26 22 Others (432/437/438) 0/2/0 1/0/3 Side of lesions, right/left/bilateral, n 15/27/1 22/34/0 Time since stroke onset, mean (SD), days 70.4 (64.1) 1197.1 (1281.8) Interval between the 2 assessments, mean (SD), days 24.7 (6.7) 14.4 (3.7) MMSE score, mean (SD) 26.4 (2.8) — BI1st assessment score, mean (SD) 11.9 (4.8) 14.5 (5.1) BI2nd assessment score, mean (SD) 13.8 (4.6) 15.4 (4.7)
MMSE = Mini-Mental State Examination; BI = Barthel Index.
Table 2. The 2 Estimates With 95% Confidence Interval of the Minimal Clinically Important Difference of the Barthel Index
Anchor-Based Distribution-Based Method Method MCID estimate 1.85 (0.89~2.81) 1.45 (1.22~1.78)
(95% CI)
MCID = minimal clinically important difference; CI = confidence interval.
at National Taiwan Univ Library on April 15, 2009
http://nnr.sagepub.com
size was 0.33. Another study examined the responsive-ness of the BI and found that the mean change on the BI from 90 to 180 days after stroke was 0.26 points (standardized response mean, another type of effect size = 0.28). The score of 0.26 points was much less than 1.85 points. The effect sizes of both studies were larger than 0.2, which has been considered as clinically important using Cohen’s criteria,29 but their mean changes did not reach the MCID, that is, the changes were not perceived by the patients as important and the changes did not exceed the measurement error of the BI. Therefore, the MCID may be a better benchmark than the effect size for use in determining the respon-siveness of an instrument.
For clinical applications (ie, for interpreting change within individual patients), the standards for measure-ment error of the instrumeasure-ments used are higher than for research applications that interpret change within a group of patients.30,31The SRD (1.96 × SEM × √2–) used for individuals is much higher than an SEM. As our results showed, the SRD of the BI (4.02 points) helps clinicians interpret the change score of an individual stroke patient and judge whether the change is beyond measurement error. Furthermore, for an individual patient, the BI change score must be an integer. When the BI change score within an individual stroke patient in a clinic reaches 5 points, the clinician can interpret the change as real, given the greater than 95% confi-dence level.
There are 2 strengths of this study. First, we used both anchor-based and distribution-based methods to determine the MCID of the BI. Combining the 2 methods can ensure that the MCID is the result of the clients’ subjective perceptions of changes of ADL func-tion and exceeds the measurement error of the BI. Second, our retest-retest reliability study had a large sample size (56), which was larger than those used in many previous test-retest reliability studies of the BI in stroke patients.14,32,33 It has been recommended that the sample size of retest-retest reliability studies should be preferably greater than 5034,35 to obtain a reliable SEM. It is noted that the distribution-based estimate of the MCID of the BI (1.45) is lower than the estimate based on patients’ ratings (1.85). That is, the value representing patients’ perceptions of important change is beyond the measurement error of the BI, indicating that our MCID estimate of the BI is appro-priate.10 On the other hand, if the patients’ ratings were lower than measurement error of an instrument, it would indicate that the instrument is unreliable in detecting patients’ perceptions, and the MCID is thus doubtful.
Five issues are of concern. First, there are several scoring guidelines for the BI. We adopted the scoring
guidelines that had been examined and suggested by Wade and Collin13 because they have detailed guidelines and satisfactory psychometric properties in stroke patients.13-17 Therefore, the results from this study should be interpreted with caution when other scoring guidelines are used. Second, to obtain patients’ self-rating data, we recruited only patients with sufficient cognitive ability to complete the test-ing. Some patients were excluded from this study because of cognitive or communication difficulties that prevented self-rating of perceived ADL function. The proxy ratings of their ADL function might be considered as an alternative method in future studies. Third, the reliability of the method of patient global rating of change on the 15-point Likert-type scale has not been examined in stroke patients. Further studies to validate the patient global rating of change in stroke patients are needed. Fourth, patients in the anchor-based and distribution-based study were dif-ferent in their recovery stages and disability levels (ie, ADL function). In the anchor-based study, we included stroke inpatients for estimating the MCID of the BI. In general, these inpatients had severe or mod-erate ADL disabilities. On the other hand, in the dis-tribution-based study, only the patients (mostly outpatients) who had had a stroke at least 6 months previously were recruited. These patients generally had mild or moderate ADL disabilities. Therefore, the differences that existed between the 2 groups in this study were unavoidable due to the study design. In addition, the generalizability of the results may be limited by the modest sample size of the MCID group and the recruiting scheme (eg, unstandardized and unequal follow-up time period). Further studies with larger sample sizes and a standardized and equal fol-low-up time period are warranted. Fifth, this study is the first to determine the MCID of the BI. Because of the heterogeneity of stroke patients, our findings need to be cross-validated in further studies.
In summary, this study provides a preliminary result of the MCID of the BI in stroke patients. We established that the MCID of the BI was 1.85 points and that the SRD was 4.02 points in stroke patients. These values of the MCID and SRD can help clinicians and researchers determine whether or not the change scores on the BI have reached clinical importance.
ACKNOWLEDGEMENTS
The study was supported by research grants from the National Science Council (NSC94-2314-B-002-080) and the National Health Research Institute (NHRI-EX93-9204PP) of Taiwan.
APPENDIX
The 15-point Likert-type scale used to assess the patients’ perceptions of the magnitude of change of independence
level in activities of daily living function
+7 A very great deal better +6 A great deal better +5 A good deal better +4 Moderately better +3 Somewhat better +2 A little better
+1 Almost the same, hardly any better at all 0 No change
–1 Almost the same, hardly any worse at all –2 A little worse
–3 Somewhat worse –4 Moderately worse –5 A good deal worse –6 A great deal worse –7 A very great deal worse
REFERENCES
1. Beaton DE, Boers M, Wells GA. Many faces of the minimal clini-cally important difference (MCID): a literature review and direc-tions for future research. Curr Opin Rheumatol. 2002;14:109-114. 2. Brealey S. Measuring patient health status in rheumatoid arthritis— what is a minimal clinically important difference? J Rheumatol. 2004;31:1026-1028.
3. Juniper EF, Guyatt GH, Willan A, Griffith LE. Determining a minimal important change in a disease-specific quality of life questionnaire. J Clin Epidemiol. 1994;47:81-87.
4. Kelleher CJ, Pleil AM, Reese PR, Burgess SM, Brodish PH. How much is enough and who says so? BJOG. 2004;111:605-612. 5. Osoba D, Rodrigues G, Myles J, Zee B, Pater J. Interpreting the
significance of changes in health-related quality-of-life scores.
J Clin Oncol. 1998;16:139-144.
6. Jaeschke R, Singer J, Guyatt GH. Measurement of health status. Ascertaining the minimal clinically important difference. Control
Clin Trials. 1989;10:407-415.
7. Wright JG. The minimal important difference: Who’s to say what is important? J Clin Epidemiol. 1996;49:1221-1222.
8. Lydick E, Epstein RS. Interpretation of quality of life changes.
Qual Life Res. 1993;2:221-226.
9. Crosby RD, Kolotkin RL, Williams GR. Defining clinically mean-ingful change in health-related quality of life. J Clin Epidemiol. 2003;56:395-407.
10. Hagg O, Fritzell P, Nordwall A. The clinical importance of changes in outcome scores after treatment for chronic low back pain. Eur Spine J. 2003;12:12-20; discussion 21.
11. Nunnally J, Bernstein I. Psychometric Theory. New York, NY: McGraw Hill; 1994.
12. Kelly-Hayes M, Robertson JT, Broderick JP, et al. The American Heart Association stroke outcome classification. Stroke. 1998;29: 1274-1280.
13. Collin C, Wade DT, Davies S, Horne V. The Barthel ADL Index: a reliability study. Int Disabil Stud. 1988;10:61-63.
14. Green J, Forster A, Young J. A test-retest reliability study of the Barthel Index, the Rivermead Mobility Index, the Nottingham
Extended Activities of Daily Living Scale and the Frenchay Activities Index in stroke patients. Disabil Rehabil. 2001;23:670-676. 15. Hsueh IP, Lee MM, Hsieh CL. Psychometric characteristics of the Barthel Activities of Daily Living Index in stroke patients. J
Formos Med Assoc. 2001;100:526-532.
16. Hsueh IP, Lin JH, Jeng JS, Hsieh CL. Comparison of the psycho-metric characteristics of the Functional Independence Measure, 5 item Barthel Index, and 10 item Barthel Index in patients with stroke. J Neurol Neurosurg Psychiatry. 2002;73:188-190. 17. Wallace D, Duncan PW, Lai SM. Comparison of the
responsive-ness of the Barthel Index and the motor component of the Functional Independence Measure in stroke: the impact of using different methods for measuring responsiveness. J Clin Epidemiol. 2002;55:922-928.
18. Wyrwich KW. Minimal important difference thresholds and the standard error of measurement: Is there a connection? J Biopharm
Stat. 2004;14:97-110.
19. Guyatt G, Walter S, Norman G. Measuring change over time: assessing the usefulness of evaluative instruments. J Chronic Dis. 1987;40:171-178.
20. Mahoney FI, Barthel DW. Functional evaluation: the Barthel Index. Md State Med J. 1965;14:61-65.
21. Folstein MF, Folstein SE, McHugh PR. “Mini-mental state”. A practical method for grading the cognitive state of patients for the clinician. J Psychiatr Res. 1975;12:189-198.
22. Xu G, Meyer JS, Huang Y, Du F, Chowdhury M, Quach M. Adapting mini-mental state examination for dementia screening among illiterate or minimally educated elderly Chinese. Int J
Geriatr Psychiatry. 2003;18:609-616.
23. Flansbjer UB, Holmback AM, Downham D, Lexell J. What change in isokinetic knee muscle strength can be detected in men and women with hemiparesis after stroke? Clin Rehabil. 2005;19:514-522. 24. Flansbjer UB, Holmback AM, Downham D, Patten C, Lexell J.
Reliability of gait performance tests in men and women with hemiparesis after stroke. J Rehabil Med. 2005;37:75-82. 25. Stratford PW, Goldsmith CH. Use of the standard error as a
reli-ability index of interest: an applied example using elbow flexor strength data. Phys Ther. 1997;77:745-750.
26. Beckerman H, Roebroeck ME, Lankhorst GJ, Becher JG, Bezemer PD, Verbeek AL. Smallest real difference, a link between repro-ducibility and responsiveness. Qual Life Res. 2001;10:571-578. 27. van der Esch M, Steultjens M, Ostelo RW, Harlaar J, Dekker J.
Reproducibility of instrumented knee joint laxity measurement in healthy subjects. Rheumatology (Oxford). 2006;45:595-599. 28. van Bennekom CA, Jelles F, Lankhorst GJ, Bouter LM.
Respon-siveness of the rehabilitation activities profile and the Barthel Index. J Clin Epidemiol. 1996;49:39-44.
29. Cohen J. Statistical Power Analysis for the Behavior Sciences. New York, NY: Academic Press; 1988.
30. de Vet HC, Terwee CB, Bouter LM. Current challenges in clini-metrics. J Clin Epidemiol. 2003;56:1137-1141.
31. Schmitt JS, Di Fabio RP. Reliable change and minimum impor-tant difference (MID) proportions facilitated group responsive-ness comparisons using individual threshold criteria. J Clin
Epidemiol. 2004;57:1008-1018.
32. Loewen SC, Anderson BA. Reliability of the Modified Motor Assessment Scale and the Barthel Index. Phys Ther. 1988;68: 1077-1081.
33. Wolfe CD, Taub NA, Woodrow EJ, Burney PG. Assessment of scales of disability and handicap for stroke patients. Stroke. 1991; 22:1242-1244.
34. Donner A, Eliasziw M. Sample size requirements for reliability studies. Stat Med. 1987;6:441-448.
35. Hopkins WG. Measures of reliability in sports medicine and science. Sports Med. 2000;30:1-15.
Hsieh et al