國立交通大學
機械工程學系
碩士論文
石墨及 PDMS 呼吸式質子交換膜燃料電池之水
管理與熱分佈分析
Water Management and Thermal Distribution
Analyses of Graphite and PDMS Air-breathing
PEMFC
研 究 生:鍾云婷
指導教授:陳俊勳 教授
石墨及 PDMS 呼吸式質子交換膜燃料電池之水
管理與熱分佈分析
Water Management and Thermal Distribution Analyses of Graphite and PDMS Air-breathing PEMFC
研究生:鍾云婷 Student:Yun-Ting Chung 指導教授:陳俊勳 Advisor:Chiun-Hsun Chen 國 立 交 通 大 學 機 械 工 程 學 系 碩 士 論 文 A Thesis
Submitted to Department of Mechanical Engineering College of Engineering
National Chiao Tung University In Partial Fulfiillment of the Requirements
For the Degree of Master of Science In Mechanical Engineering
June 2011
Hsinchu, Taiwan, Republic of China
i
Water Management and Thermal Distribution Analyses of Graphite and PDMS Air-breathing PEMFC 石墨及 PDMS 呼吸式質子交換膜燃料電池之水管理與熱分佈分析 學 生 :鍾 云 婷 指 導 教 授 : 陳 俊 勳 國立交通大學機械工程學系
摘要
本文主要為研究以 PDMS 與石墨質子交換膜燃料電池之實驗測試, 探討反應面積為 5 公分×5 公分的單電池。第一部分是 PDMS(聚二甲基 矽氧烷)單電池之研究,實驗參數包括流量及其對應之氫氣利用率以 及組裝時鎖合扭力的影響;第二部分是石墨單電池的研究,實驗參數 包括流量、鎖合扭力以及電池溫度的影響,此兩部分實驗皆用熱顯像 儀拍攝陰極溫度分佈;另外,PDMS 與石墨燃料電池都經由長時間 24 小時放電測試以觀察其耐久度。最後,本論文將 PDMS 與石墨燃料電 池做性能的比較與分析。 由實驗結果可知,PDMS 與石墨燃料電池的性能都隨著流量的增 大而增大,但 PDMS 燃料電池到達 60sccm 和石墨燃料電池到達 40sccm 以上,性能就不會再增大;PDMS 燃料電池的氫氣利用量是 60sccm, 因此熱顯像儀拍攝出的溫度分布在此流量時較均勻;電池組裝之鎖合 扭力必須在不使流道結構變型的情況下增加才能有效提升其性能;石 墨燃料電池的性能會隨著電池溫度的增加而增加,到達 60℃以上, 性能會隨著溫度的增加而減少;PDMS 燃料電池堆經過二十四小時長 時間測試後,都有良好的耐久度,但是石墨的卻不穩定,但若將石墨 電池溫度加熱至 60℃,即有穩定的輸出;經比較後,在同樣的條件 下和同樣的阻抗下,PDMS 燃料電池皆比石墨燃料電池性能表現佳; 由於 PDMS 燃料電池有比較少的積水現象,因此比石墨燃料電池更適 合用在呼吸式燃料電池上。 關鍵字:PDMS,石墨,質子交換膜燃料電池,氫氣利用量,熱顯像儀, 鎖合扭力,電池溫度ABSTRACT
This study fabricated PDMS (Polydimethyl Siloxane) and graphite PEMFC (Proton Exchange Membrane Fuel Cell). The active area of the membrane is 5cm×5cm. Firstly, a series of performance experiments on a single PDMS air-breathing PEMFC were carried out and demonstrated. The experimental parameters included flow rate with the corresponding hydrogen utilization and clamping force. Secondly, the similar performance experiments on single graphite air-breathing PEMFC were also carried out and illustrated. The experimental parameters consisted of flow rate, clamping force and cell temperature. For both experimental studies, the corresponding thermal imagines of resultant temperature distributions on the cathode surface were given as well. In addition, in order to justify the durability of continuous usage and water produced situation, both fuel cells mentioned above were tested for 24 hours at a fixed operating voltage. Finally, we made a comparison between PDMS and graphite PEMFCs to see the performance difference and the advantage.
The experimental results show that both the performances of the single PDMS and graphite air-breathing PEMFC increase with an increase of flow rate, but have no further obvious improvements when the Water Management and Thermal Distribution Analyses of Graphite and
PDMS Air-breathing PEMFC
Student: Yun-Ting Chung Advisor: Prof. Chiun-Hsun Chen
Department of Mechanical Engineering National Chiao Tung University
iii
flow rates are greater than 60sccm and 40sccm, receptivity. The hydrogen utilization of the single PDMS PEMFC is 60sccm, and the corresponding thermal image show its temperature distribution being more uniform; An appropriate clamping torque should be considered carefully to enhance the performance without narrowing the fuel flow channels; The performance has significantly improved as increasing graphite fuel cell temperature, however, it starts to decrease as the cell temperature above 60℃; The single PDMS fuel cell can maintain a stable power output for a long time use up to 24 hours. One the contrary, the single graphite air-breathing PEMFC cannot, but it can maintain a stable power output when the cell temperature is raised to 60℃ manually; The PDMS PEMFC has a better performance than that of the graphite one under the same conditions and the same resistance; PDMS is a better material than graphite for air-breathing fuel cell because it has less water flooding effects and possesses a better performance.
Keywords: PDMS, Graphite, PEMFC, Hydrogen Utilization, Thermal Imaging Analyzer, Clamping Force, Cell Temperature
Acknowledgements
最感謝我的指導教授 陳俊勳,除了論文的指導外,也教導我很 多做人處事的道理,不斷的磨練我的心智,使我更加的堅強,這是我 兩 年 中 所 獲 得 最 大 的 淬 鍊 。 感 謝 燃 料 電 池 國 科 會 的 計 畫 經 費 及 Lab506 支持我做此研究。感謝阿貴學長在研究上不厭其煩的教導, 因為學長從容的態度,才使我擔憂的心情得到舒緩。感謝義嘉學長細 心的指導,使我的研究之路更加順遂。感謝昶安、宗翰、家維、瑭原、 金輝學長平日的幫忙,感謝同屆的聖容、嘉軒、世庸、黃鈞一起同甘 共苦,讓我的學習之路不孤單,感謝凌宇、詠翔、鉦鈞、天洋學弟的 平日的幫忙,讓口試能順利進行。最後要感謝我的父母、妹妹、信志、 牛頓室友們,你們永遠是我心靈的避風港,沒有你們的陪伴,也不會 有今日的我,在這兩年期間,你們扮演非常重要的角色。v
Contents
ABSTRACT (ENGLISH) ... i ABSTRACT (CHINESE) ... ii Acknowledgements ... iv Contents ... v LIST OF TABLE... ix LIST OF FIGURES ... x Chapter 1 ... 1 Introduction ... 11.1 Motivation and Background: ... 1
1.2 Literature Review: ... 4
1.3 Scope of Present Study ... 14
Chapter 2 ... 20
Fundamentals of Fuel Cell ... 20
2.1 History of Fuel Cell: ... 20
2.2 Principle of the Fuel Cell ... 21
2.2.1 Thermodynamics ... 21
2.2.2 Kinetics ... 23
2.2.2.1 Activation Losses ... 24
2.2.2.2 Ohmic Losses ... 25
2.2.2.3 Concentration Losses ... 25
2.3 Type of Fuel Cell ... 26
2.3.1 PAFC ... 28
2.3.2 AFC ... 28
2.3.4 MCFC ... 29
2.3.5 PEMFC ... 29
2.4 Fuel Cell Stack ... 30
2.5 Principle of PEMFC ... 30
2.6 Structure of PEMFC ... 31
2.6.1 Bipolar Plate, Current Collector and End Plate ... 31
2.6.2 Gas Diffusion Layer (GDL) ... 32
2.6.3 Gasket ... 32
2.6.4 Proton Exchange Membrane (PEM) ... 32
2.6.5 Active Layer ... 32
Chapter 3 ... 36
Experimental Apparatus and Fabrication Processes ... 36
3.1 Processes of Fabricating the PDMS Flow Field Plates ... 36
3.2 Assembly and Components of PEMFC ... 36
3.2.1 Components of PEMFC ... 36
3.2.2 MEA and GDL ... 37
3.2.3 Assembly of Air-breathing PEMFC ... 37
3.2.4 Current Collector Slices ... 38
3.3 Test Station ... 38
3.4 Thermal Infrared Imaging Camera System ... 40
3.4.1 Thermal Imaging Analyzer ... 40
3.4.2 Technical Specification of SAT-S160 ... 41
3.4.3 Calibration Procedure of SAT-S160 ... 42
3.5 Hydrogen Flow Meter ... 43
vii
3.8 Uncertainty Analysis ... 46
3.8.1 Analyses of the Propagation of Uncertainty in Calculations ... 46
3.8.2 The Uncertainty of Test Station Apparatus ... 47
3.8.2.1 The Uncertainty of HP 6060B Electronic Load: uV,uA ... 47
3.8.2.2 The Uncertainty of Mass Flow Controller ... 49
3.8.2.3 The Uncertainty of Temperature Controller ... 50
3.8.3 The Uncertainty of Fuel Cell Power Density ... 51
Chapter 4 ... 63
Results and Discussion ... 63
4.1 The Single PDMS Air-breathing PEMFC ... 63
4.1.1 Reference Case ... 63
4.1.2 Effect of Flow Rate ... 67
4.1.2.1 I-P and I-V Curves ... 67
4.1.2.2 Hydrogen Utilization ... 68
4.1.2.3 Thermal Images of Temperature Distributions ... 70
4.1.3 Effect of Clamping Force ... 71
4.1.4 Durability and Stability Test (24 hours) ... 72
4.1.4.1 Power Density-Time Curves (P-t curves) ... 72
4.1.4.2 Water Accumulation ... 72
4.2 The Single Graphite Air-breathing PEMFC ... 73
4.2.1 Effect of Flow Rate ... 73
4.2.1.1 I-P and I-V Curves ... 73
4.2.1.2 Thermal Images of Temperature Distributions ... 74
4.2.3 Effect of Cell Temperature ... 75
4.2.4 Durability and Stability Test (24 hours) ... 76
4.2.4.1 Power-Time Density Curves (P-t curves) ... 76
4.2.4.2 Water Accumulation ... 78
4.3 Comparison between Graphite and PDMS Air-breathing ... 78
PEMFCs ... 78 4.3.1 Flow Rate ... 78 4.3.2 Clamping Force ... 79 4.3.3 Cell Temperature ... 80 4.4 Dimensional Analyses ... 82 Chapter 5 ... 124
Conclusions and Recommendations ... 124
5.1 Conclusions ... 124
5.2 Recommendations ... 126
ix
LIST OF TABLE
Table 1.1 Major Fuel Cell Types [1] ... 2
Table 2.1 The Five Major Types of Fuel Cells ... 27
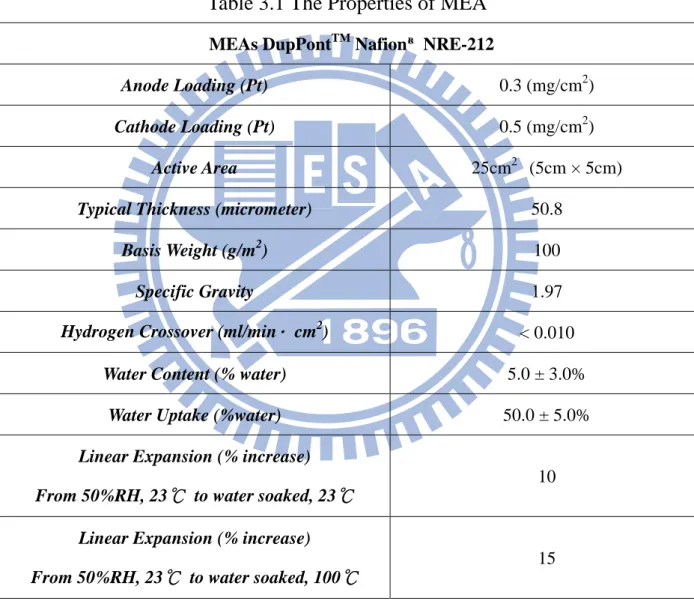
Table 3.1 The Properties of MEA ... 37
Table 3.2 Instrument of Hardware Specifications ... 38
Table 3.3 Function of Software ... 39
Table 3.4 One or More PEMFC Testing Range ... 39
Table 3.5 Technical Indexes of SAT-S160 ... 42
Table 3.6 Object Parameter of Thermal Imaging Analyzer ... 43
Table 3.7 Hydrogen Flow Meter Calibration Data ... 44
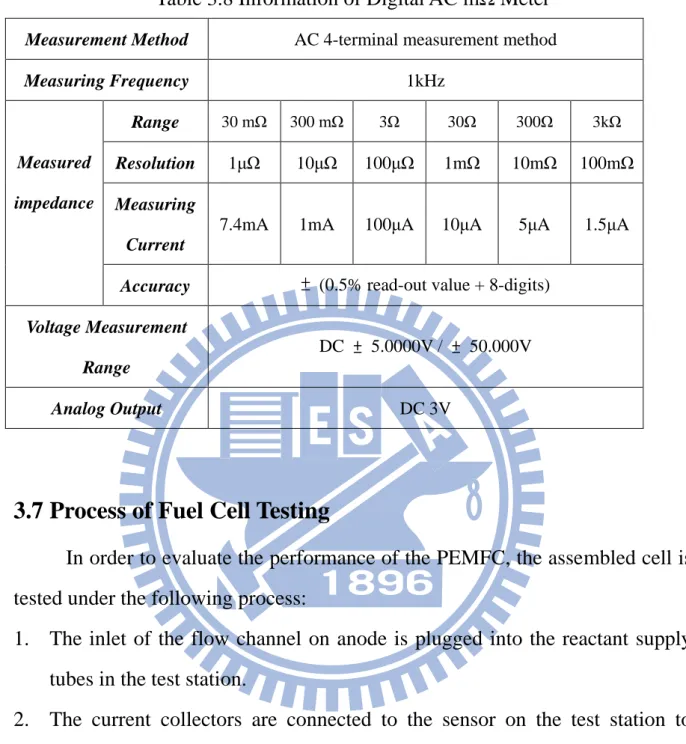
Table 3.8 Information of Digital AC mΩ Meter ... 45
Table 3.9 Uncertainty of Electronic Load Potential Meter ... 48
Table 3.10 Uncertainty of Electronic Load Current Meter ... 48
Table 3.11 Uncertainty of Anode MFC... 49
Table 3.12 Uncertainty of Cathode MFC ... 49
Table 3.13 Uncertainty of Air Bleeding MFC ... 50
Table 3.14 Uncertainty of Anode Temperature Controller ... 50
Table 3.15 Uncertainty of Cathode Temperature Controller ... 51
Table 3.16 Uncertainty of Cell Temperature Controller ... 51
Table 3.17 The Measuring Uncertainty of Fuel Cell ... 52
Table 4.1 Testing Conditions of Reference case ... 65
Table 4.2 Hydrogen Utilization (At 0.2V) ... 68
Table 4.3 Testing Conditions of the Graphite PEMFC ... 79
LIST OF FIGURES
Fig. 1.1 The Petroleum’s Price in Recent Year ... 16
Fig. 1.2 Global Fossil Carbon Emissions in Recent Years ... 16
Fig. 1.3 Comparison of Power Densities for Bilayer and Monolithic Design [4] ... 17
Fig. 1.4 Flow Field Patterns of Anode and Cathode on 200 cm2 PEMFC: (A) 3-Channel Serpentine Flow-Field; (B) 6-Channel Flow-Field; (C) 13-Channel Flow Field; (D)26-Channel Flow Field; (E) 26-Channel Complex Flow-Field [7] ... 17
Fig. 1.5 Three Different Open Cathode Designs: (a) Parallel Slit (b) Circular Opening and (c) Oblique Slit [17] ... 18
Fig. 1.6 Unit Cell Cathode Plate Designs for the Rectangular, Triangular and Circular Opening Geometries at Various Opening Ratios [21] ... 18
Fig. 1.7 Research Flow Chart ... 19
Fig. 2.1 Typical I-V Curve For a PEMFC ... 34
Fig. 2.2 I-V Curve of Fuel Cell ... 34
Fig. 2.3 Sandwich Structure of PEMFC ... 35
Fig. 3.1 Vacuum Chamber ... 53
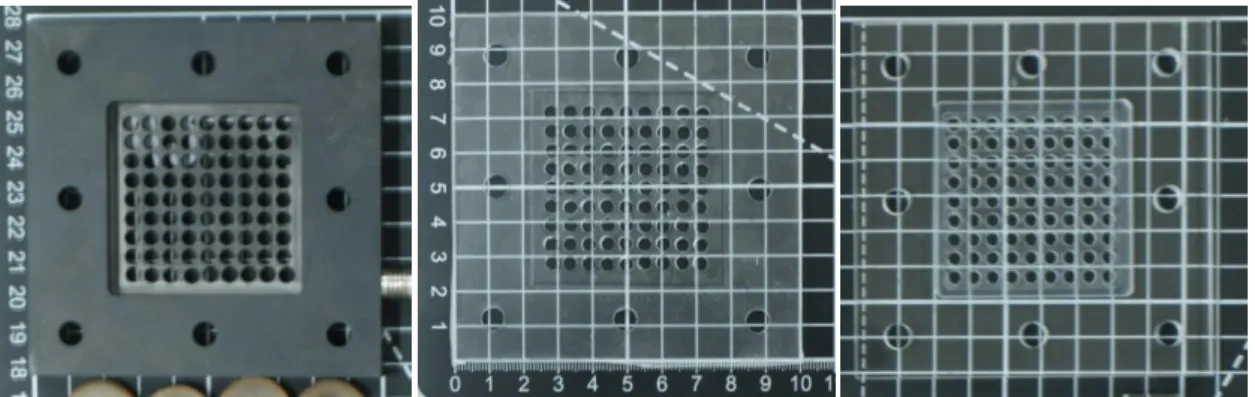
Fig. 3.2 PDMS Flow Field Plates ... 53
Fig. 3.3 GDL and MEA ... 54
Fig. 3.4 Components of a Single PDMS Fuel Cell ... 54
Fig. 3.5 Components of a Single Graphite Fuel Cell... 55
Fig. 3.6 Assembly of PDMS PEMFC ... 55
xi
Fig. 3.8 Sandwich Structure of Single PDMS Air-breathing PDMFC ... 56
Fig. 3.9 Shape of Acrylic Plate, Graphite Plate and the PDMS ... 57
Fig. 3.10 Current Collector Slice ... 57
Fig. 3.11 Test Station ... 58
Fig. 3.12 Components of Test Station ... 58
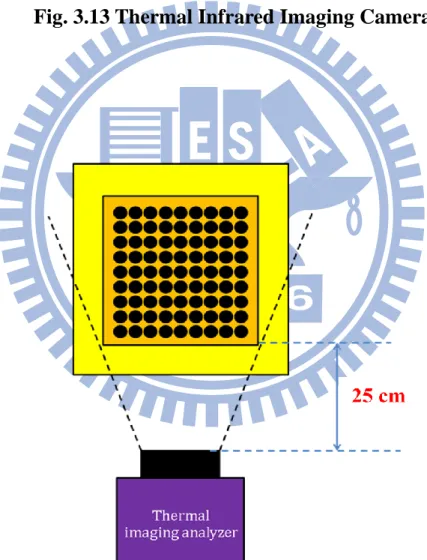
Fig. 3.13 Thermal Infrared Imaging Camera ... 59
Fig. 3.14 Configuration of Thermal Infrared Imaging Camera and Air-breathing Fuel Cell ... 59
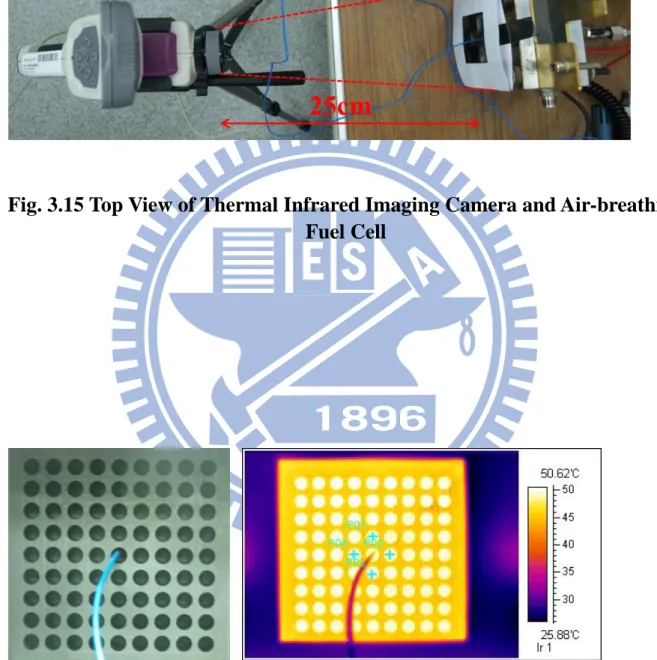
Fig. 3.15 Top View of Thermal Infrared Imaging Camera and Air-breathing Fuel Cell ... 60
Fig. 3.16 Schematic of Thermocouple and the Surface of PEMFC and Their Thermal Imaging Picture ... 60
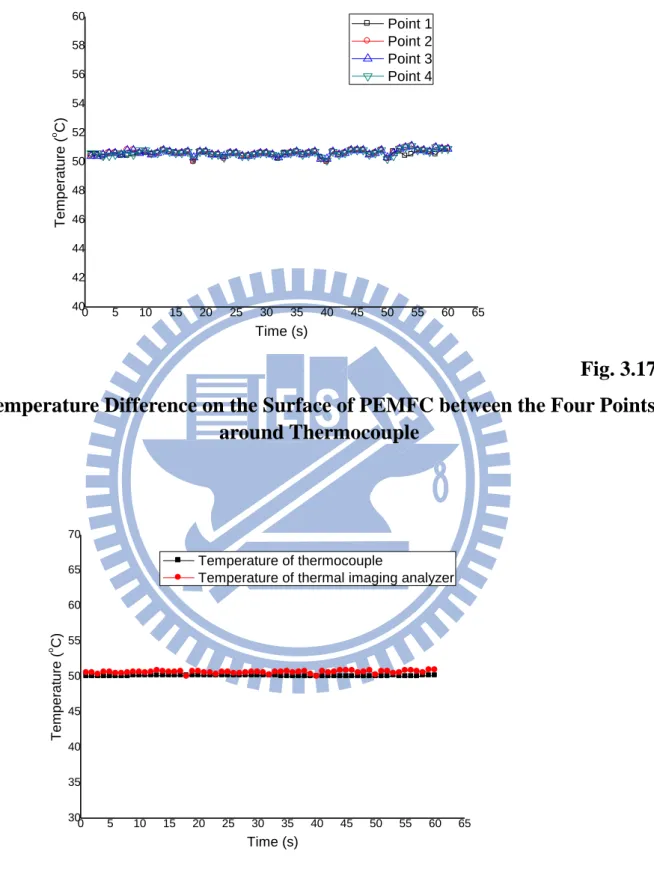
Fig. 3.17 Temperature Difference on the Surface of PEMFC between the Four Points around Thermocouple ... 61
Fig. 3.18 Temperature of Thermocouple and Thermal Imaging Analyzer ... 61
Fig. 3.19 Hydrogen Flow Meter ... 62
Fig. 4.1 Reference Case ... 83
Fig. 4.2 Value of AC Meter and Voltage/Current for Comparison ... 83
Fig. 4.3 I-P Curves in Different Flow Rates (PDMS PEMFC) ... 84
Fig. 4.4 I-V Curves in Different Flow Rates (PDMS PEMFC) ... 84
Fig. 4.5 Comparison between Measured and Calculated Utilization (PDMS PEMFC) ... 85
Fig. 4.6 Comparison between Measured and Calculated Utilization after Eliminating Water Vapor (PDMS PEMFC) ... 85
Fig. 4.8 Thermal Images in Hydrogen Flow Rate of 10sccm ... 87 Fig. 4.9 Temperature Distribution Analyses in Hydrogen Flow Rate of 10sccm (PDMS PEMFC)... 87 Fig. 4.10 Thermal Images in Hydrogen Flow Rate of 20sccm ... 88 Fig. 4.11 Temperature Distribution Analyses in Hydrogen Flow Rate of 20sccm (PDMS PEMFC)... 88 Fig. 4.12 Thermal Images in Hydrogen Flow Rate of 30sccm ... 89 Fig. 4.13 Temperature Distribution Analyses in Hydrogen Flow Rate of 30sccm (PDMS PEMFC)... 89 Fig. 4.14 Thermal Images in Hydrogen Flow Rate of 40sccm ... 90 Fig. 4.15 Temperature Distribution Analyses in Hydrogen Flow Rate of 40sccm (PDMS PEMFC)... 90 Fig. 4.16 Thermal Images in Hydrogen Flow Rate of 50sccm ... 91 Fig. 4.17 Temperature Distribution Analyses in Hydrogen Flow Rate of 50sccm (PDMS PEMFC)... 91 Fig. 4.18 Thermal Images in Hydrogen Flow Rate of 60sccm ... 92 Fig. 4.19 Temperature Distribution Analyses in Hydrogen Flow Rate of 60sccm (PDMS PEMFC)... 92 Fig. 4.20 I-P Curves in Different Clamping Forces (PDMS PEMFC) ... 93 Fig. 4.21 I-V Curves in Different Clamping Forces (PDMS PEMFC) .... 93 Fig. 4.22 I-R Curves in Different Clamping Forces (PDMS PEMFC) .... 94 Fig. 4.23 Durability Test for 24 Hours (PDMS PEMFC) ... 94 Fig. 4.24 Pictures of Water Accumulation at 0.5V (PDMS PEMFC) (a) 6 hours (b) 12 hours (c) 18 hours (d) 24 hours ... 95 Fig. 4.25 Pictures of Water Accumulation at 0.6V (PDMS PEMFC) (a) 6
xiii
Fig. 4.26 Pictures of Water Accumulation at 0.7V (PDMS PEMFC) (a) 6
hours (b) 12 hours (c) 18 hours (d) 24 hours ... 97
Fig. 4.27 Thermal Images at 0.5V (PDMS PEMFC) ... 98
Fig. 4.28 Thermal Images at 0.6V (PDMS PEMFC) ... 99
Fig. 4.29 Thermal Images at 0.7V (PDMS PEMFC) ... 100
Fig. 4.30 I-P Curves in Different Flow Rates (Graphite PEMFC) ... 101
Fig. 4.31 I-V Curves in Different Flow Rates (Graphite PEMFC) ... 101
Fig. 4.32 Thermal Images in Hydrogen Flow Rate of 10sccm (Graphite PEMFC) ... 102
Fig. 4.33 Temperature Distribution Analyses in Hydrogen Flow Rate of 10sccm (Graphite PEMFC) ... 102
Fig. 4.34 Thermal Images in Hydrogen Flow Rate of 20sccm (Graphite PEMFC) ... 103
Fig. 4.35 Temperature Distribution Analyses in Hydrogen Flow Rate of 20sccm (Graphite PEMFC) ... 103
Fig. 4.36 Thermal Images in Hydrogen Flow Rate of 30sccm (Graphite PEMFC) ... 104
Fig. 4.37 Temperature Distribution Analyses in Hydrogen Flow Rate of 30sccm (Graphite PEMFC) ... 104
Fig. 4.38 Thermal Images in Hydrogen Flow Rate of 40sccm (Graphite PEMFC) ... 105
Fig. 4.39 Temperature Distribution Analyses in Hydrogen Flow Rate of 40sccm (Graphite PEMFC) ... 105
Fig. 4.40 Thermal Images in Hydrogen Flow Rate of 50sccm (Graphite PEMFC) ... 106 Fig. 4.41 Temperature Distribution Analyses in Hydrogen Flow Rate of
50sccm (Graphite PEMFC) ... 106 Fig. 4.42 Thermal Images in Hydrogen Flow Rate of 60sccm (Graphite PEMFC) ... 107 Fig. 4.43 Temperature Distribution Analyses in Hydrogen Flow Rate of 60sccm (Graphite PEMFC) ... 107 Fig. 4.44 I-P Curves in Different Clamping Forces (Graphite PEMFC) 108 Fig. 4.45 I-V Curves in Different Clamping Forces (Graphite PEMFC) ... 108 Fig. 4.46 I-R Curves in Different Clamping Forces (Graphite PEMFC) ... 109 Fig. 4.47 I-P Curves in Different Cell Temperatures (Graphite PEMFC) ... 109 Fig. 4.48 I-V Curves in Different Cell Temperatures (Graphite PEMFC) ... 110 Fig. 4.49 I-R Curves in Different Cell Temperatures (Graphite PEMFC) ... 110 Fig. 4.50 Durability Test for 24 Hours (Graphite PEMFC) ... 111 Fig. 4.51 Pictures of Water Accumulation at 0.5V (Graphite PEMFC) (a) 6 hours (b) 12 hours (c) 18 hours (d) 24 hours ... 112 Fig. 4.52 Pictures of Water Accumulation at 0.6V (Graphite PEMFC) (a) 6 hours (b) 12 hours (c) 18 hours (d) 24 hours ... 113 Fig. 4.53 Pictures of Water Accumulation at 0.7V (Graphite PEMFC) (a) 6 hours (b) 12 hours (c) 18 hours (d) 24 hours ... 114 Fig. 4.54 Thermal Images at 0.5V (Graphite PEMFC) ... 115 Fig. 4.55 Thermal Images at 0.6V (Graphite PEMFC) ... 116
xv
Fig. 4.57 Durability Test for 24 Hours after Improvement (Graphite PEMFC) ... 118 Fig. 4.58 Pictures of Water Accumulation at 30 Kgf∙cm and Room Temperature (Graphite PEMFC) (a) 6 hours (b) 12 hours (c) 18 hours (d) 24 hours ... 119 Fig. 4.59 Pictures of Water Accumulation at 100 Kgf∙cm and Room Temperature (Graphite PEMFC) (a) 6 hours (b) 12 hours (c) 18 hours (d) 24 hours ... 120 Fig. 4.60 Pictures of Water Accumulation at 100 Kgf∙cm and 60℃ (Graphite PEMFC) (a) 6 hours (b) 12 hours (c) 18 hours (d) 24 hours.. 121 Fig. 4.61 Comparison between PDMS and Graphite PEMFC under the Same Conditions ... 122 Fig. 4.62 Comparison between PDMS and Graphite PEMFC under the Same Resistance ... 122 Fig. 4.63 Comparison between PDMS and Graphite PEMFC ... 123 Fig. 4.64 Comparison with Hsu’s study [3] ... 123
Chapter 1
Introduction
1.1 Motivation and Background:
Fossil fuel is a main source for vehicles in our daily life. A great amount of fossil fuel has been used in the petroleum industrial age, and it almost depletes in recent years. Because of the shortage of fossil fuel, the price of petroleum has been soared as shown in Fig. 1.1. Besides, fossil fuel has some drawbacks: to begin with, the emissions from chemical reactions, like CO2, CO,
CH4 and N2O etc., causing acid rain and global warming, pollute our
environment; see Fig. 1.2. And the Greenhouse effect is getting more severe, and it becomes a global problem now. Next, when the petroleum discharges or accidently leaks to the ocean, they will hurt or kill the marine life to lead a disequilibrium to the biosphere. Last but not least, the productions of fossil fuel, such as plastics and Styrofoam, etc., cannot dissolute themselves, and they cause severe damage to the land. Most importantly, fossil fuel cannot be a permanent energy source for mankind. Looking for the alternative energy becomes an important issue.
There have been developed several ways to replace fossil fuel in recent years. Nuclear is one of the viable ways, but it is hard to find a material that can endure the high temperature for a long time. Wind and water also can be the sources of power, but they have limitations of land. Geothermal energy resources and bio-fuels are not good enough to generate electric power still. Some researchers will consider gas-electric hybrid for vehicles, but it is not a permanent choice eventually. As a consequence, fuel cells are the best way to supply electricity. Because the hydrogen can be fully supplied without
2
depletion, fuel cells become the most important research topics in 21st century. The fuel cells can become such promising devices nowadays because they have a lot of advantages. They combine many advantages of both combustion engines and batteries, like high energy densities and highly reliable. They also have their own advantages: no-pollution, no moving parts, silent and quickly recharged by refueling. There are five major types of fuel cells operating at different temperature regimens (see Table 1.1): the phosphoric acid fuel cell (PAFC), the proton exchange membrane fuel cell (PEMFC), the alkaline fuel cell (AFC), the molten carbonate fuel cell (MCFC) and the solid-oxide fuel cell (SOFC). Among them, the PEMFC is the most attractive one due to its low temperature operation and high power density that can be started and stopped quickly at the room temperature. In addition, it is a good electricity supply device, ranged from W to KW. For example, mobile phones, lap-top, personal computer, portable generation, household appliances, vehicles and other electronic equipments can be used with the PEMFC widely.
Table 1.1 Major Fuel Cell Types [1]
PEMFC PAFC AFC MCFC SOFC
Operating
temperature 80℃ 200℃ 60-220℃ 650℃ 600-1000℃
PEMFC can be divided into two categories according to the fuels supplied: methanol and the hydrogen. The methanol is liquid and the hydrogen is gas. The methanol type of PEMFC is called the direct methanol fuel cell (DMFC). It was under extensive investigation in 2005, but it has some drawbacks. It is harmful to the human health, and it also produces CO to poison Pt catalyst and CO2 to cause the Greenhouse effect. Besides, it has lower performance than
that of PEMFC, because of the slower fuel anode reaction process. On the contrary, the PEMFC with hydrogen has a higher open circuit voltage (OCV) and produces water only that cannot be a problem to our life, so the application of hydrogen fuel in PEMFC is more preferred.
The PEMFC employs a proton exchange membrane as an electrolyte, which is a solid polymer. It is located between anode and cathode, which are porous graphite. Such anode-membrane-cathode sandwich structure is called a membrane electrode assembly (MEA), whose entire thickness is less than 1 mm. The electrochemical reactions in the PEMFC are as following:
Anode: H2 2H+ + 2e
-Cathode O2 + 2H+ + 2e- H2O + heat
Overall: H2 + O2 H2O + heat
The hydrogen reacts at the anode that is catalyzed by the catalyst, Pt. After reaction, the products are hydrogen ion H+, which reacts with oxygen at the cathode to generate water and heat, and electron e-. And the corresponding internal temperature range is less than 90˚C.
In this research team of Chen, Chung [2] used the MEMS (Micro Electro Mechanical Systems) technology to fabricate the single micro PEMFC on silicon-based wafer in order to accomplish a better performance of PEMFC. Unfortunately, the structure of silicon-based flow field plate was too friable to crack while assembling, and its inelastic property easily causes the gas-leaking problem. Hsu [3] used a better material, Polydimethyl Siloxane (PDMS; (H3C)3SiO [Si(CH3)2O]n Si(CH3)3), to replace the silicon-based one for the micro
PEMFC. This material has good biocompatibility, nontoxicity, opaque, hydrophobicity, plasticity and has low heat conduction coefficient, etc. Besides,
4
it can combine the gasket and flow field together. It can keep fuel cell maintained at a higher temperature to prevent water from condensing that solves water management problem because PDMS is not a good heat conductor. Then, the PEMFC has better performance without the formation of water droplet. Therefore, this thesis continues the effort to apply PDMS in a 5╳5cm2 reaction area of the air-breathing single PEM fuel cell to mitigate water flooding problem. In addition to the performance tests, thermal imaging analyzer is used to find the temperature distribution in the cell.
1.2 Literature Review:
There are a lot of research subjects to investigate the factors to improve the fuel cell performance, such as air movement, system considerations, system integration, load handling, fuel delivery, water removal, uniform temperature distribution, homogeneous fluid distribution, good current transport, high conductivity and materials.
Meyers and Maynard [4] used a miniaturized fuel cell integrated on a silicon substrate. There were two designs, one was a bilayer design, which was like sandwich structure that the anode and cathode was separated; another design was a monolithic design that the anode and cathode was on the same substrate. Comparing with the two designs, they found that the power density of a bilayer design is much better as shown in Fig.1.3.
Noponen et al. [5] introduced a measurement system for mapping of current distribution in a free-breathing PEMFC. The results showed that the operating temperature has a significant influence on the performance of the fuel cell. Furthermore, the free convection is weak at low cell temperature, and the membrane is dry at high cell temperatures. They also showed that under some
conditions the fuel cell has homogenous current distribution and does not need any auxiliary pumps or fans to increase the airflow.
The paper by Shah, Shin and Besser [6] was the first report using PDMS as the base material in micro fuel cell. They manufactured micro flow channels on PDMS by soft lithography, because PDMS was cheaper material comparing to silicon. They also compared Pd catalyst with Pt one and found that Pt catalyst is better than Pd one due to the poorer reaction kinetics of Pd catalyst. The performance of fuel cell is proportional to the humidification of hydrogen stream, the conversion of hydrogen, and the catalyst porosity in electrodes. The loading of catalyst has no influence on the conversion of hydrogen; the conversion of hydrogen is determined by the partial pressure of gases at the outlet measured by the mass spectrometer and the temperature on catalysts. When the temperature on catalysts increases, the conversion of hydrogen is decreased, leading to a poor performance.
Shimpalee et al. [7] established a model of 200 cm2 serpentine flow-fields with different patterns to make the gas distribution uniform. In this paper, they employed the 3-channel, 6-channel, 13-channel, 26-channel serpentine flow-fields and 26-channel complex flow-field on 200 cm2 PEMFC as shown in Fig. 1.4. The conclusion was that the performance changes with the number of parallel channels, which is related to the path length. The shorter path length (the higher number of parallel channels) has better performance, less water production and more uniform distribution of current density. However, the performance of 13-channel serpentine flow-field is better than that of the 26-channel one, because it has higher water content in membrane, which leads to a higher proton conductivity. The performances of 26-channel serpentine and 26-channel complex flow-fields are similar, indicating that the performance
6
is independent of configuration.
Schmitz et al. [8] indicated that the performance of an air-breathing PEMFC is related to the opening size of cathode and the gas diffusion layers (GDLs). They considered three opening ratios of 33, 50 and 80%, and the GDLs with different wetting properties to perform the analyses. Larger opening ratio (80%) produces the higher current density and temperature at corresponding cell potentials. The GDL with the hydrophobic has a better performance than the one with the hydrophilic. The latter absorbs water in the GDL, so the membrane is dry out. On the contrary, the hydrophobic GDL cannot absorb water in the GDL, so it keeps the membrane humidified and blocks the oxygen supply. The best performance for air-breathing PEMFCs is an untreated Toray○R
GDL, which has a lower contact resistance and higher porosity; it keeps the membrane humidified, but does not block the supply of oxygen.
Jung et al. [9] improved the water management problem and the performances of the air-breathing and air-blowing PEMFCs at low temperature by adding hydrophilic SiO2 particles to the anode catalyst layer. The
conclusion was that the performance of air-blowing PEMFC is higher than that of the air-breathing one due to the good transportation of air at the cathode. The performance becomes highest with 100% humidification at the anode; on the other hand, the performance becomes the lowest with flooding at the cathode. The advantages of SiO2 are that the back diffusion of water to the anode can be
enhanced and the water at the cathode can be removed by absorbing water to the anode.
Chen et al. [10] used rapid prototyping (RP) technology to build a new 10-cell air-breathing miniature planar array fuel cell stack, which has a volume
of 6cm×6cm×0.9cm, and the active area was 1.3cm×1.3cm in each individual MEA. The flow field plate was made of acrylonitrile-butadiene-styrene (ABS) by plastic injection molding technology. The RP technology is much faster and cheaper than the conventional CNC and MEMS. The peak powers of the parallel connected and serial connected stack are 99mWcm-2 at 0.425V and 92mWcm-2 at 4.25V under free convection (at 70℃), and 123mWcm-2 at 0.425V and 105mWcm-2 at 5.25V under forced convection. The parallel connected stack has higher power density than the serial one, and the performance under forced convection is higher than that of free convection.
Ito et al. [11] developed an evaluation method based the ratio of liquid water to pore volume in GDL. They measured the differential pressure through the interdigitated fuel cell to estimate the liquid water ratio in GDL. The differential pressure was measured by ac impedance method that measuring the ionic resistance in polymer electrolyte membrane, and the water saturation was related to the operation condition of fuel cell. The variables included the material of GDL, load current, gas utilization ratio and humidification temperature. The conclusion was that the performance of cloth-type GDL is higher than that of paper-type one, and the water saturation is proportional to the load current, gas utilization ratio and humidification temperature.
Wen and Huang [12] presented a new method to discharge the waste heat to ambiance by using the pyrolytic graphite sheet (PGS) in a single fuel cell. The PGS is a thermal conduction material, playing an important role as a heat spreader, and the advantages are less volume, light weight and cost reduction by reducing the ancillary components. The heat transportation and temperature distribution are better with PGS than the ones without PGS. When increasing
8
the oxygen flow rates, more water is removed from the membrane and it becomes dehydrated. The use of PGS increases the water condensation due to the temperature decrease by conduction, so the membrane becomes hydrated. The conclusion was that the PGS increases the water droplets under the high flow rates and dry conditions.
Pandiyan et al. [13] developed an analytical method to understand the thermal and electrical resistances of PEMFC, which were determined by the mass balance and polarization curve, respectively. Thermal and electrical resistances of the electrode are 67.7 and 52mΩ in a four cells stack, respectively. When the increase of thermal resistance is three times, the current increases 50% and the temperature change is 10℃. The electrode fabrication process can change the internal resistance of the fuel cell stack, which is a major key in thermal management.
Siu and Chiao [14] used PDMS as the material of gasket and electrode in microbial fuel cell. They used MEMS technology, such as etching and evaporation processes, to form the microchannel pattern on the silicon wafer, and to mold PDMS on the wafer. Comparing with the recent silicon micromachined microbial fuel cell, their result showed the better performances in the average power density and average current density.
Song et al. [15] used PDMS to fabricate planar PEM fuel cells. They measured current density at different flow rates. The result showed that the current density is a decreasing function of flow rate because the residence times for protons reaching the cathode are shorter at higher flow rates. Since the distance between anode and cathode must be as short as possible, they used Nafion membrane, whose thickness was only 200~400nm. The current density
increases 166% compared to the other planar membrane device.
According to [12], Wen et al. [16] used PGS in a 10-cell stack with 100 cm2 active area. The temperature variation was measured by four thermocouples on the cathode gas channel plate. The result showed that the temperature distribution becomes uniform in fuel cell stack with the PGS, indicating that PGS is a good thermal management material. And the maximum power of fuel cell stack with the PGS increases 15%.
Bussayajarn et al. [17] applied three different cathode geometries with the same opening ratio: parallel slit, circular open and oblique slit as shown in Fig. 1.5. The performance and stability were investigated with the different cathode geometries. The circular open design is found to be the best in performance and current density, and the performances of parallel slit and oblique slit design are similar, because the shorter rib distance and hydraulic diameter can result in better oxygen transportation and uniform oxygen distribution. The oblique slit design shows high stability, on the contrary, the parallel slit and circular open design are unstable. Both the performance and stability are better in forced convection condition than in self-breathing condition.
Dai et al. [18] surveyed the papers related to water transport and balance in the MEA of PEMFCs. The parameters included operating conditions, component designs and material properties. The major rule of the water balance depends on the materials of water management properties and the components matching operating conditions and load requirements. The data of materials and components in MEA were insufficient, so it was difficult to optimize the design of MEA. It needs to develop a new material for water management capability and to design a component structure and water balance models. Water balance influences not only the performance but also the
10
durability in both experiment and modeling.
Karst et al. [19] used different cathodic cover opening ratio to manage water content for micro air-breathing PEMFCs. It was a method which decreased the flooding at the cathode and increased the water back-diffusion at the anode by varying the cover opening ratio. The new method didn’t require any control tool and didn’t increase the volume of cell, either. The total closure of the cover maintains the water accumulated at the cathode. The 5% of cover opening ratio maximizes the back-diffused water and produces 33% of total water at 150mA cm-2.
Pomfret et al. [20] used a Si-charge-coupled device (CCD), camera-based and near-infrared imaging system, to observe the anode processes in the solid oxide fuel cell. A Si-CCD camera-based NIR imagining system was the first equipment using at the Ni/YSZ cermet anodes. The benefit of the NIR imagining system was cheaper, lighter and more sensitive than mid-IR imaging system. Most importantly, it was easier and quicker to observe the operation and processes in SOFCs under various conditions. And the result showed that the temperature drop is due to the presence of oxides and water in SOFCs.
Kim et al. [21] used the thin flexible printed circuit board (FPCB) as a current collector in order to reduce an air-breathing monopolar stack's volume. They also designed different patterns of air-breathing holes on the cathode to find the effect of varying the geometry and opening ratios on stack performance as shown in Fig. 1.6. They found that in cathode, the circular-hole pattern with opening ratio of 38% has the best performance; on the other hand, the rectangular cathode opening pattern with 65% opening ratio causes cathode flooding and unstable output problems.
performance of miniature silicon wafer fuel cells. Three different thicknesses of current collector were selected. They found that the thicker the current collector, the better the cell performance. It is because an increment of the current collector thickness increases the area of conductor, which decreases the cell resistance and improves the cell performance.
Zhang et al. [23] used two effective methods, FEM analysis and simplified
prediction method, for estimating the contact resistance between the bipolar plate and GDL. The predicted results by both methods show the good agreement with the experimental ones. The contact resistance is influenced by the average clamping pressure and the assembly clamping pressure distributions.
Chang et al. [24] studied the effects of the clamping pressure on the performance of PEMFC. The contact electrical resistance is a function of the clamping pressure, so it is necessary to assemble a fuel cell with a proper force. The results showed that increasing the clamping pressure reduces the interfacial resistance and enhances the electrochemical performance of a PEMFC at the low clamping pressure levels. In contrast, increasing the clamping pressure reduces the Ohmic resistance, but meanwhile narrows down the mass diffusion path from gas channels to the catalyst layers at the high clamping pressure levels. The above two effects make the power density not to rise due to the lower mass-transfer limitation for higher current density.
Zhou et al. [25] investigated the effect of clamping force on the performance of PEMFC that directly affects the interfacial contact resistance, non-uniform porosity distribution of GDL, GDL deformation and reactant transport in GDL. They used finite element method (FEM) to analyze the elastic deformation of GDL and porosity distribution, and finite volume method (two-phase flow model) to analyze the mass transport of reactants and products.
12
The results showed that the contact resistance plays an important role at a low clamping force in determining the power density because the contact resistance decreases obviously with increasing clamping force. But at a high clamping force, the contact resistance decreases slightly with an increasing clamping force, and now the GDL deformation plays a main role. As the GDL porosity decreases, the transport resistances of gas and liquid water increase. Accordingly, the power density decreases with an increase of clamping force when the influence of GDL porosity is more significant than that of Ohmic contact resistance.
Wen et al. [26] applied the pressure-sensitive films (FUJI-FILM I&I) to observe the internal contact pressure distributions under three different clamping torques (8, 12 and 16 N-m) and three different bolt configurations (2, 4 and 6-bolt configurations). When the torque was applied, the pressure-sensitive film was broken and a color-forming material was released and absorbed by the film. The pressure film was then transferred into a color image file that was compared with the reference color bar to obtain the pressure values. The results showed that the larger mean contact pressure and more bolt numbers, the higher maximum power. The uniformity of the contact pressure distribution is improved and the contact ohmic resistance is reduced when increasing the mean contact pressure and bolt numbers. However, the maximum power does not increase linearly with the bolt numbers and torques. In fact, it increases until a certain torque point (e.g. >10 bar) is reached, and further increasing the clamping pressure not only reduces the contact ohmic resistance but also narrows down the mass transfer path from gas channels to the catalyst layers.
Lee and Chu [27] applied a finite volume-based CFD approach to
humidification temperature influence the location of the gas-liquid interface (defined as the location where the liquid water begins to condense), the cell performance and the distribution of liquid water saturation. The results indicated that the humidification temperature slightly higher than the cell one is the best working condition. It is because that in such condition, liquid water forms when the inlet gases enter the channel, some of the liquid water keeps the membrane moist to enhance its ionic conductivity.
Matian et al. [28] used a thermal imaging camera to study the temperature distribution and variation on the outer surfaces of PEM fuel cell. One important parameter, namely the surface emissivity factor, that needed to be identified in advance. A calibrated thermocouple was put on surface and the temperature was recorded, then, emissivity factor in the camera settings was altered until the temperature measured by the camera agreed with the one by the thermocouple. They obtained the emissivity factor of 0.88, and this value did not change throughout the experiments. The results showed that the temperature distribution in the stack is not only affected by convection in the gas flow channels but also by natural convection and conduction; about 50~60% of the heat is dissipated by natural convection.
Zhang et al. [29] operated a PEMFC without external humidification (0% relative humidity) to eliminate the gas humidification system and decrease the complexity of the fuel cell system. The performance at 100% RH is higher than that at 0% RH, because the membrane needs to be humidified to carry hydrogen ions. The results showed that the cell performance at 0% RH decreases with the increasing operation temperature and reactant gas flow rate and a decreasing operation pressure.
14
single PEM fuel cell to investigate the formation of water droplets and their aggregation in the cathode under various operating parameters, such as air and hydrogen stoichiometry, cell temperature and external load. The stoichiometry of air and hydrogen causes droplets aggregation and makes fewer droplets extraction. In contrast, the temperature and external load have the effects on removing water, and the temperature is especially an obvious operating parameter. The formation of water droplets is reduced as the temperature increases, but the over-temperature can cause the membrane dehydrated.
1.3 Scope of Present Study
In this study, the materials of PDMS and graphite are used for the flow field plates to improve the water management in the 5╳5 cm2 reaction area of the air-breathing single PEM fuel cells. The use of a 25 cm2 air-breathing cell can observe the temperature distribution more easily, and the air-breathing one can reduce the auxiliary oxygen supply system.
The research flow chart is given in Fig. 1.7. The experimental parameters included the material, flow rate, clamping force and cell temperature. The temperature distribution images on cell surfaces were obtained by using a thermal imaging analyzer. The data of hydrogen utilization were deduced by the measurements from mass flow meters. The contact and ionic resistance was measured by an Ohm Tester. The I-V (I-P) curves and durability data were recorded by the test station. Those measured data are used to evaluate the performances of the manufactured fuel cells. After a series of performance tests were carried out, the performance comparisons by using PDMS and graphite flow field plates are given as well. In addition, the comparison with other work, such as Zhang et al. [29], Chang et al. [24] and Ous and Arcoumanis
16
Fig. 1.1 The Petroleum’s Price in Recent Year
http://en.wikipedia.org/wiki/Price_of_petroleum
Fig. 1.2 Global Fossil Carbon Emissions in Recent Years
Fig. 1.3 Comparison of Power Densities for Bilayer and Monolithic Design [4]
Fig. 1.4 Flow Field Patterns of Anode and Cathode on 200 cm2 PEMFC: (A) 3-Channel Serpentine Flow-Field; (B) 6-Channel Flow-Field; (C) 13-Channel Flow Field; (D)26-Channel Flow Field; (E) 26-Channel
18
Fig. 1.5 Three Different Open Cathode Designs: (a) Parallel Slit (b) Circular Opening and (c) Oblique Slit [17]
Fig. 1.6 Unit Cell Cathode Plate Designs for the Rectangular, Triangular and Circular Opening Geometries at Various Opening Ratios [21]
20
Chapter 2
Fundamentals of Fuel Cell
2.1 History of Fuel Cell:
The origin of fuel cell can be traced back to the 19 century. In 1839, a scientist also a lawyer named William R. Grove who had the first concept of a fuel cell. The idea of fuel cell came from the experiment of water electrolysis. He used electricity to electrolyze water into hydrogen and oxygen, and then took the reverse reaction that it generated a small current that established the foundation of the fuel cell. The electrolysis and the reverse of electrolysis are as follow:
Electrolysis: H2O + electricity H2 + O2
Reverse reaction: H2 + O2 H2O + electricity
In 1889, L. Mond and C. Langev employed a metal Pt as the catalyst to fabricate the first fuel cell which could generate 3.5mA/cm2 at 0.73V. Therefore, the formal name of “fuel cell” had come up at that time.
In 1932, Francis Bacon used Ni as the catalyst to replace Pt and alkaline electrolyte which was different from Mond and Lavgev’s. He invented the “bacon battery” which was based on Mond and Lavgev’s. In fact, the bacon battery is the first alkaline fuel cell. In 1959, both Bacon and Allis-Chalmers companies used the machines driven by fuel cells, the development of fuel cell became commercialization since then and it helped fuel cell became more realistic in the future.
During 1960~1970, NASA found out a proper main power source, hydrogen fuel cell, for spaceship. Because the power was suitable for the
spaceship and the produced water could supply astronauts to drink in the outer space. In 1976, a new polymer membrane called Nafion came out, and it was registered by DuPont. In 1993, Ballard power system company invented the first automobile in the world that powered by fuel cells. But the development of fuel cell is not complete yet.
Nowadays, the flooding situation is still a main problem for air-breathing type of fuel cell, because it becomes difficult to breathe when the water blocks air supply to gas diffusion layer and then it decreases the voltage. Thus it takes a long time for fuel cells to be realistic in commercialization. Fortunately, we can use thermal imaging analyzer to observe the temperature distribution to indicate water flooding situation and then use PDMS to solve the flooding problem.
2.2 Principle of the Fuel Cell
2.2.1 Thermodynamics
Fuel cell converts chemical energy into electrical energy directly, so it is more efficient than heat engines. The maximum theoretical efficiency of a heat engine is described by the Carnot cycle as follow:
εCarnot =
,
where TH is maximum temperature and TL is the rejection temperature of the
heat engine. For example, a heat engine operates at 675K and rejects heat at 325K, the resultant Carnot efficiency is 52%.
The ideal efficiency (ε ) of a fuel cell is the amount of useful energy that can be extracted from the reaction relative to the total heat energy released by the reaction in combustion:
22 0 0 H G
For example, ΔH0 is -285.83KJ/mole for the hydrogen/oxygen reaction and ΔG0 is -237.14KJ/mole at standard conditions, so the ideal efficiency is 83%.
But the real efficiency of fuel cell is lower than the ideal one due to the voltage and the fuel utilization losses. The real efficiency of fuel cell may be expressed as:
εreal = εideal × εvoltage × εfuel
where εideal is the ideal efficiency of the fuel cell, εvoltage the voltage efficiency
and εfuel the fuel utilization efficiency.
The energy can be expressed as an electrical potential or standard-state reversible voltage (E0) when ΔG0 represents the amount of useful energy that can be extracted from the fuel cell at standard condition, and the relation equation is:
E0 = Δ
The reversible voltage of hydrogen-oxygen is 1.23V at standard condition, which is the open circuit voltage (OCV).
The open circuit voltage of the fuel cell depends on the operating conditions, because ΔG is a function of pressure and temperature. When the case is not under standard condition, these dependencies can be described by the Nernst equation: ENernst = E0 –
It provides us to observe how the voltage changes with the partial pressures of reactant and product. However, the real voltage of fuel cell is lower than the ideal one due to the irreversible kinetic losses and the fuel utilization losses.
2.2.2 Kinetics
The ideal voltage of fuel cell is determined by the Nernst equation, but the real voltage output is less than the ideal one. In the real fuel cell, the more current outflow is drawn, the more voltage output loses and it declines the total power. There is a graph of fuel cell that incorporates current and voltage characteristics called a current-voltage (I-V) curve (Fig.2.1), which can illustrate the performance of real fuel cell. From this curve, it can know the real voltage output of the fuel cell at a given current output.
According to the I-V curve, it is difficult to keep a high voltage at the higher current due to irreversible losses, and there are three types of losses for fuel cell, which can be identified in I-V curve (see Fig 2.2):
1. Activation losses 2. Ohmic losses
3. Concentration losses
The activation losses are due to electrochemical reaction in the initial section, the ohmic losses are due to ionic and electronic conduction in the middle section, and the concentration losses are due to mass transport in the last section of the curve.
There is an equation that can predicate the real voltage output of fuel cell based on the ideal voltage output minus three kinds of losses:
Ereal = ENernst – ηact – ηohmic – ηconc
where Ereal is the real voltage output, ENernst the ideal voltage output, ηact the
activation losses, ηohmic the ohmic losses and ηconc the concentration losses.
24 2.2.2.1 Activation Losses
The voltage output decreases rapidly at the lower current density, because the electrochemical half reactions at the anode and cathode electrodes are slow. The oxygen reduction reaction at the cathode is especially slow that is the main reason that voltage output decreases rapidly at lower current density.
Although the free energy of products is lower than that of reactants, reaction rates are still limited. Because there exists an energy barrier called activation energy between the reactants and products, it impedes reactants to convert into products. In order to lower the energy barrier, a part of generated voltage must sacrifice to increase the rate of reaction and the current output. The Butler-Volmer equation can describe the relationship between the current density output and activation overvoltage.
i = i0 (
— )
When the activation overvoltage is over 50mV, the Butler-Volmer can be simplified into a simpler form:
i = i0
When it transforms to logarithmic form, it is called the Tafel equation. ηact =
Activation losses can be reduced by increasing the current density, which is the functions of the catalyst material and the surface area of electrodes. Platinum is the best catalyst material and the highly porous electrodes can expand the reaction surface area. Disperse the nano particles of platinum into the porous electrodes, so the gas phase pores, the electrode and the electrolyte contact intimately. It maximizes the triple phase boundary which increases the
current density.
2.2.2.2 Ohmic Losses
The voltage output decreases in the middle section of the I-V curve because of the internal resistance of materials and the movement of protons and electrons. These section of losses follow Ohms law, V = I R, so it is called “Ohmic losses”. The reason that causes ohmic losses is the electrically conductive electrodes and the ion conductive electrolyte. The latter is larger than the former, so the electrolyte influence is the main reason of ohmic losses. Even though there are ohmic losses, the peak power occurs in the middle of I-V curve.
2.2.2.3 Concentration Losses
The voltage output decreases rapidly at the high current density and then drops to zero. When the voltage is zero, the current density output is the maximum current, known as the short-circuit current. Because the voltage output is zero, the total power delivered is also zero. The reason causing concentration losses are the mass transport limitation. The consumed rate of the reactant gases on the reaction surfaces is faster than the one of its supply at the high current density. Due to insufficient of the reactant gases, the partial pressure of the reactant gases reduces to zero. According to the Nernst equation, the partial pressure of the reactant gases drops rapidly, leading the voltage output to zero. The voltage loss caused by the mass transportation limit of reactant can be expressed as:
ηconc =
where ηconc is the concentration losses and iL is the limiting current density.
26
density. However, the good design of the flow field plate and the highly porous electrodes can mitigate concentration losses and have a better performance.
2.3 Type of Fuel Cell
There are five major types of fuel cells, they are: 1. Phosphoric Acid Fuel Cell (PAFC)
2. Alkaline Fuel Cell (AFC) 3. Solid Oxide Fuel Cell (SOFC)
4. Molten Carbonate Fuel Cell (MCFC)
5. Proton Exchange Membrane Fuel Cell (PEMFC)
These five categories of fuel cell have the same operation principles, but they operate in different temperature and have different electrolyte and electrode materials. In addition, their fuel tolerance and performance characteristics are also different. The detailed differences are summarized in Table 2.1.
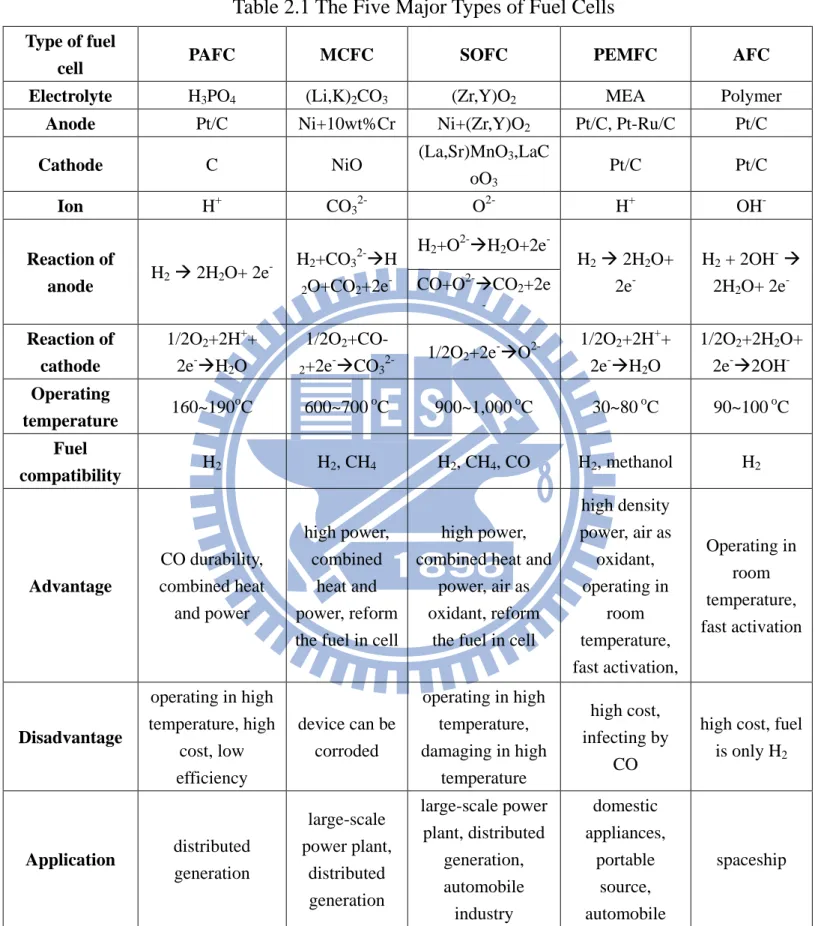
Table 2.1 The Five Major Types of Fuel Cells
Type of fuel
cell PAFC MCFC SOFC PEMFC AFC
Electrolyte H3PO4 (Li,K)2CO3 (Zr,Y)O2 MEA Polymer
Anode Pt/C Ni+10wt%Cr Ni+(Zr,Y)O2 Pt/C, Pt-Ru/C Pt/C
Cathode C NiO (La,Sr)MnO3,LaC
oO3 Pt/C Pt/C Ion H+ CO32- O2- H+ OH- Reaction of anode H2 2H2O+ 2e - H2+CO3 2-H 2O+CO2+2e -H2+O2-H2O+2e- H2 2H2O+ 2e -H2 + 2OH- 2H2O+ 2e -CO+O2-CO2+2e
-Reaction of cathode 1/2O2+2H++ 2e-H2O 1/2O2 +CO-2+2e-CO3
2-1/2O2+2e-O
2-1/2O2+2H++ 2e-H2O 1/2O2+2H2O+ 2e-2OH -Operating temperature 160~190 o C 600~700 oC 900~1,000 oC 30~80 oC 90~100 oC Fuel compatibility H2 H2, CH4 H2, CH4, CO H2, methanol H2 Advantage CO durability, combined heat and power high power, combined heat and power, reform the fuel in cell
high power, combined heat and
power, air as oxidant, reform
the fuel in cell
high density power, air as oxidant, operating in room temperature, fast activation, Operating in room temperature, fast activation Disadvantage operating in high temperature, high cost, low efficiency device can be corroded operating in high temperature, damaging in high temperature high cost, infecting by CO
high cost, fuel is only H2 Application distributed generation large-scale power plant, distributed generation large-scale power plant, distributed generation, automobile industry domestic appliances, portable source, automobile spaceship
28 2.3.1 PAFC
The phosphoric acid fuel cell employs liquid H3PO4 as an electrolyte,
which is in the middle of two porous graphite electrodes coated with a platinum catalyst. Hydrogen is used at the anode and air or oxygen is at the cathode. The PAFCs operate above 42℃, around 180 to 210℃, because the freezing point of pure phosphoric acid is 42℃. The benefit of the phosphoric acid is high thermal, chemical, volatility and electrochemical stability and it also has greater tolerance of CO, which is up to 1%. The PAFC become the first widely used fuel cell in commercial market.
2.3.2 AFC
The alkaline fuel cell employs potassium hydroxide as an electrolyte. It operates at about 200℃, and uses hydrogen at the anode and air or oxygen at the cathode. H+ is transported from the anode to the cathode in acidic fuel cells, in opposite, OH- is transported from the cathode to the anode in an alkaline fuel cell. Thus, water is produced at the anode. It is important to remove the excess water; otherwise the performance of AFC will decline. NASA used the AFC in spaceship for a main power source and it also is employed in hydrogen-powered vehicles.
2.3.3 SOFC
The solid oxide fuel cell employs solid ceramic as an electrolyte, and yttria-stabilized zirconia (YSZ) is the common used material. The YSZ has a lot of advantages, such as high porosity, high thermal expansion compatibility, good ion conductivity and mechanical stability. The materials of anode and cathode are different. The anode is made of nickel zirconia, which has high
catalytic activity and good conductivity and the cathode is made of lanthanum manganate, which has high catalytic activity and good oxidation resistance. It operates around 600 to 1000℃, so the electrodes must be able to stand the high temperature environment. The efficiency of the SOFC is only about 50~60%, but it can reach 90% when combining heat and power advices. Therefore, the SOFC is always used in industrial and electricity generating stations.
2.3.4 MCFC
The molten carbonate fuel cell employs a molten mixture of alkali carbonates as an electrolyte, such as lithium and potassium or lithium and sodium carbonates. It uses CO2 at the cathode and produces CO2 at the anode,
recycling the CO2 from the anode to the cathode, and the carried ion between the
cathode and the anode is CO32-. The anode is made of nickel/chromium alloy
and the cathode is lithiated nickel oxide that both have high catalytic activity and good conductivity. It operates at about 650℃, which is the high temperature, similar to SOFC. The efficiency of MCFC is about 50%, but it can reach 90% when combining heat and power advices.
2.3.5 PEMFC
The proton exchange membrane fuel cell employs a thin polymer membrane as an electrolyte like plastic wrap, and the most common material is NafionTM. The membrane is between the anode and cathode, which have two sections, platinum-based catalyst and porous carbon electrode. The structure is electrode-catalyst-membrane-catalyst- electrode, which is called a membrane electrode assembly (MEA). Hydrogen is used at the anode, and air or oxygen is used at the cathode. The other type of fuel supply at the anode is methanol
30
and it is called direct methanol fuel cell (DMFC). It operates at about 90℃, because the polymer membrane must be aqueous with liquid water for ion conduction. The principles of PEMFC and PAFC are the same, but PEMFC is more attractive and a common used power source for automobile than PAFC. It is because PEMFC can start and stop quickly at low temperature and has high efficiency, most importantly, its quantity of power density is suitable for portable applications.
2.4 Fuel Cell Stack
The voltage of a single fuel cell is fixed. The way to enlarge the voltage is to connect the fuel cells together in series that is called “fuel cell stack”. The total voltage of the stack is adding the voltages of individual single fuel cell together, so the number of fuel cells of a stack depends on the amount of voltage needed. But the real voltage of fuel cell stack is less than the summed voltages of single fuel cells due to the utilization rate of fuel and the various losses.
2.5 Principle of PEMFC
PEMFC is different from a conventional battery; it converts chemical energy into power energy directly. As long as we supply fuel to the PEMFC, it continuously generates current, in other words, it is just like a transformation machine. There are hydrogen oxidation reaction and oxygen reduction reaction in PEMFC. The oxidation is taken place at the anode, where hydrogen is split into electrons and protons (H+). Then, the electrons pass through the wire connected with the two electrodes, and the protons (H+) pass through the electrolyte to reach cathode. The oxygen reduction is occurred at cathode, where the electrons, protons and oxygen are combined together to produce water. The half of electrochemistry reactions are as follow:
anode: H2 2H + + 2e -cathode O2 + 2H + + 2e- H2O + heat overall: H2 + O2 H2O + heat
The process of electron flow is the critical point to generate current, and the amount of current depends on the reaction area of electrodes. Enlarging the reaction area of electrodes leads to larger current. The electrode is usually made into a thin and highly porous structure to increase the surface area that maximizes surface-to-volume ratio.
2.6 Structure of PEMFC
The structure of PEMFC is shown in Fig.2.3, which is like a sandwich structure, and each individual item is described as follow:
2.6.1 Bipolar Plate, Current Collector and End Plate
The voltage of single fuel cell is too small to drive electrical appliances, so connecting several fuel cells in series is a common way to increase voltage. The bipolar plate is a structure to connect the fuel cells in series, and the plate is between the anode of a fuel cell and the cathode of adjacent fuel cell. It is a high conductive plate to collect the current and contains flow channels to uniform gas distribution. It is an important structure to support MEA stably and reduce the difference of gas pressures between the anode and cathode. In the study, we use the PDMS as the material of bipolar plate, but it is not a conductive. And the current collector is next to bipolar plate in order to collect current to outside load. The outer structure is end plate, which fixes all the segments of fuel cell together and keeps the pressure distribution uniformly.
32 2.6.2 Gas Diffusion Layer (GDL)
The gas diffusion layer is a porous structure to let the gas pass through, and is made of carbon paper or cloth. It has good conductivity for electron and ability to remove water. The scale of the gas diffusion layer is constant, so the contact resistance is small. In addition, it is hydrophobic, so the holes cannot be blocked by water.
2.6.3 Gasket
The purpose of the gasket, made of Teflon-PTFE, is for sealing. It can stand high temperature and corrosion. Most importantly, it can prevent gas leaking from gas diffusion layer.
2.6.4 Proton Exchange Membrane (PEM)
The proton exchange membrane, a very important section of PEM fuel cell, is named as Nafion. The function of PEM is being a path for protons. The proton conductivity is related to the PEM thickness and the amount of water content. The proton conductivity increases when the PEM thickness becomes thinner and the amount of water content is higher. For this reason, it is necessary to keep the PEM thinner and hydrous. Another important function of the PEM is to separate the reactants of anode and cathode, otherwise, the reaction of the hydrogen and oxygen will discharge heat to increase temperature that is dangerous.
2.6.5 Active Layer
The active layer is between the PEM and GDL, the reaction gas flows through the bipolar plate, GDL and active layer in sequence. The active layer is an important segment to convert chemical energy into electrical energy. We
employed the metal platinum (Pt) in the anode and cathode, because it is a good material to activate the electrochemical reaction.
34
Fig. 2.1 Typical I-V Curve For a PEMFC
36
Chapter 3
Experimental Apparatus and Fabrication Processes
3.1 Processes of Fabricating the PDMS Flow Field Plates
The overall fabrication includes two processes: (1) process of fabricating acrylic flow field mold; (2) process of molding PDMS on the acrylic flow field mold. The molding process takes advantage of the fact that PDMS is a fluid at room temperature that is easily converted into solid form by cross-linking upon heating. To begin the molding process, a premixed substance of 10:1 weight ratio of Sylgard polymer base and curing agent is slowly poured on the acrylic mold, and then the acrylic mold is put into the vacuum chamber (see Fig. 3.1). After degassing for 1 hour to remove bubbles before curing, the PDMS is cured at 60℃ for 2 hours and peeled-off from the acrylic mold. Now the PDMS flow field plates are completed; see Fig. 3.2. The patterns of anode flow field plates are introduced into my study from ITRI.
3.2 Assembly and Components of PEMFC
3.2.1 Components of PEMFC
For the PDMS PEMFC, its components include Membrane Electrode Assembly (MEA), Gas Diffusion Layer (GDL), Current collector slices, PDMS flow field plate, and Acrylic plate. For the graphite PEMFC, its components include Membrane Electrode Assembly (MEA), Gas Diffusion Layer (GDL), Current collector plate, Graphite flow field plate, and End plate. Some of them have to be done extra works. For examples, the flow field plates need to be drilled gas inlet and outlet before assembly, and the flow field plate in air-breathing cell needs an extra hole for natural convection. These components

![Fig. 1.3 Comparison of Power Densities for Bilayer and Monolithic Design [4]](https://thumb-ap.123doks.com/thumbv2/9libinfo/8621754.191587/34.892.244.676.132.462/fig-comparison-power-densities-bilayer-monolithic-design.webp)
![Fig. 1.6 Unit Cell Cathode Plate Designs for the Rectangular, Triangular and Circular Opening Geometries at Various Opening Ratios [21]](https://thumb-ap.123doks.com/thumbv2/9libinfo/8621754.191587/35.892.234.693.399.824/cathode-designs-rectangular-triangular-circular-opening-geometries-various.webp)