行政院國家科學委員會專題研究計畫 成果報告
固固固固固固固固固固固固固固固固固固固固固研究(2/2)
計畫類別: 個別型計畫 計畫編號: NSC93-2113-M-002-016- 執行期間: 93 年 08 月 01 日至 94 年 09 月 30 日 執行單位: 國立臺灣大學化學系暨研究所 計畫主持人: 陳固中 報告類型: 完整報告 報告附件: 出席國際會議研究心得報告及發表論文 處理方式: 本計畫可公開查詢中 華 民 國 95 年 1 月 2 日
I
行政院國家科學委員會補助專題研究計畫
☑ 成 果 報 告
□期中進度報告
固態核磁共振對多肽與生物活性玻璃相互作用之研究
計畫類別:☑ 個別型計畫 □ 整合型計畫
計畫編號:NSC 93-2113-M-002-016
執行期間: 93 年 08 月 01 日至 94 年 9 月 30 日
計畫主持人:陳振中
共同主持人:
計畫參與人員:
成果報告類型(依經費核定清單規定繳交):□精簡報告 ☑完整報告
本成果報告包括以下應繳交之附件:
□赴國外出差或研習心得報告一份
□赴大陸地區出差或研習心得報告一份
☑出席國際學術會議心得報告及發表之論文各一份
□國際合作研究計畫國外研究報告書一份
處理方式:除產學合作研究計畫、提升產業技術及人才培育研究計畫、
列管計畫及下列情形者外,得立即公開查詢
□涉及專利或其他智慧財產權,□一年□二年後可公開查詢
執行單位:國立台灣大學化學系
中 華 民 國 94 年 12 月 30 日
II
摘要
此計畫之重點是研究附於生物活性玻璃上的多肽之結構。計畫的動因乃是要明白人體 內骨胳形成的機理,以利發展新一代的生物材料。我們的研究有三個具體目標:(一)分析 hydroxyapatite 在矽玻璃表面的結晶過程;(二)發展新的固態核磁共振技術,用以測量多 肽的脊柱扭轉角度 ψ;(三)測量附於矽玻璃表面的多肽之二級結構。 首先,我們以溶膠─凝膠技術合成均勻球狀的矽玻璃系統,以固態核磁共振光譜觀察 其於人工體液中如何生成羥基磷灰石。此研究亦衍生另一副題:我們與台大化學系牟中原教授合作,以固態核磁共振光譜觀察 octacalcium phosphate 如何轉化成 hydroxyapatite。此相 轉變過程在生物礦化領域中受高度重視,因它有可能是 hydroxyapatite 在生物中的礦化機 理。這部份的工作成果豐碩,內容已發表於三篇 SCI 期刋,並有一篇在審議中:
1. YH Tseng, J Zhan, KSK Lin, CY Mou and JCC Chan, 2004 SEPT, “High Resolution 31P NMR Study of Octacalcium Phosphate,” Solid State Nucl. Magn. Reson., 26, 99-104. 2. YH Tseng, Y Mou, CY Mou and JCC Chan, 2005 JUN, “Double-Quantum NMR
spectroscopy based on finite pulse RFDR,” Solid State Nucl. Magn. Reson., 27, 266-270. 3. KSK Lin, YH Tseng, Y Mou, YC Hsu, CM Yang and JCC Chan, 2005 AUG “Mechanistic
Study of Apatite Formation on Bioactive Glass Surface Using 31P Solid-State NMR Spectroscopy,” Chem. Mater., 17, 4493-4501.
4. YH Tseng, CY Mou and JCC Chan, “Transformation of Octacalcium Phosphate to
Hydroxyapatite: A Study of the Molecular Mechanism by SEM, TEM, XRD and Solid-State NMR Spectroscopy,” submitted.
對於第二個目標,我們成功地發展出一新穎的高分辨固態核磁共振技術,利用 J 耦合
作為極化傳遞之機理,此技術當可應用於測量含13
C 和15N 均勻標籤的多肽的二級結構。
部份結果已發表於以下 SCI 期刊:
1. Y Mou, JCH Chao, JCC Chan, 2006, “Efficient Spin-Spin Scalar Coupling Mediated C-13 Homonuclear Polarization Transfer in Solid-State NMR Spectroscopy,” Solid State Nucl.
Magn. Reson., in press.
2. Y Mou and JCC Chan, 2006, “Frequency Selective Polarization Transfer Based on Multiple Chemical Shift Precession,” Chem. Phys. Lett., in press.
本計劃的第三個目標,乃是把選定的多肽 DpSpSEEKFLRRIGRFG,附於矽玻璃的表 面,然後以多種固態核磁共振技術來測量其結構,探討多肽的二級構形與礦物的表面結構 有何特定關係。目前我們已部份地完成此目標。計劃中的多肽已純化成功,經 FT-IR,TGA, 固態 UV 光譜與 ninhydrin 試劑等測量,我們初步肯定多肽已成功附上矽玻璃表面的 hydroxyapatite,唯數量上仍不足以進行固態核磁共振之測量,需要更多時間於樣品製備上。 整體而言,我們已初步建立一體系,成功證明固態核磁共振於生物礦化上有極佳之應用前 景。
III
Abstract
The main objective of this proposal is to study the conformation of a polypeptide when it is adsorbed to bioactive glasses. The motivation is to understand in detail the bone mineralization process in human body for long-term implants development. This proposal comprises three specific aims: (i) characterization of the crystallization process of hydroxyapatite (HAp) on
gel-silica glass surface; (ii) development of new solid-state nuclear magnetic resonance (SSNMR) technique for the determination of backbone torsion angle ψ of polypeptide; (iii) determination of the secondary structure of polypeptide adsorbed on gel-silica glass surface.
To accomplish the first aim, we have prepared a sol-gel glass system with novel morphology, which can greatly facilitate the study of the molecular mechanism of HAp formation on glass surface when soaked in simulated body fluid. Furthermore we also prepare an inorganic model system to study the mechanism of octacalcium phosphate (OCP) to HAp conversion, which has been postulated as the biomineralization mechanism of bones and teeth. This part of the work has resulted in three articles (published in SCI journals) and one manuscript (submitted) thesis: 1. YH Tseng, J Zhan, KSK Lin, CY Mou and JCC Chan, 2004 SEPT, “High Resolution 31P
NMR Study of Octacalcium Phosphate,” Solid State Nucl. Magn. Reson., 26, 99-104. 2. YH Tseng, Y Mou, CY Mou and JCC Chan, 2005 JUN, “Double-Quantum NMR
spectroscopy based on finite pulse RFDR,” Solid State Nucl. Magn. Reson., 27, 266-270. 3. KSK Lin, YH Tseng, Y Mou, YC Hsu, CM Yang and JCC Chan, 2005 AUG “Mechanistic
Study of Apatite Formation on Bioactive Glass Surface Using 31P Solid-State NMR Spectroscopy,” Chem. Mater., 17, 4493-4501.
4. YH Tseng, CY Mou and JCC Chan, “Transformation of Octacalcium Phosphate to
Hydroxyapatite: A Study of the Molecular Mechanism by SEM, TEM, XRD and Solid-State NMR Spectroscopy,” submitted.
For the second aim, we have developed a novel technique to accomplish the polarization transfer via the scalar coupling. This technique is expected to find a very useful application in backbone torsion angle determination. Parts of the results have been documented in two manuscripts accepted for publication in SCI journals:
3. Y Mou, JCH Chao, JCC Chan, 2006, “Efficient Spin-Spin Scalar Coupling Mediated C-13 Homonuclear Polarization Transfer in Solid-State NMR Spectroscopy,” Solid State Nucl.
Magn. Reson., in press.
4. Y Mou and JCC Chan, 2006, “Frequency Selective Polarization Transfer Based on Multiple Chemical Shift Precession,” Chem. Phys. Lett., in press.
We have partially accomplished the third aim by preparing a 15-residue polypeptide DpSpSEEKFLRRIGRFG and attach it on synthetic HAp crystals. The system has been well characterized by FT-IR, solid-state UV spectroscopy and ninhydrin test. While more works have to be done to characterize the conformation of the attached peptide, we have established a very solid foundation for further study.
IV
Content
I. Introduction
1II. Results
A.
Formation mechanism of Hydroxyapatite
2B.
Characterization of Octacalcium Phosphate
11C. Solid-State NMR Characterization of Octacalcium Phosphate by
Double Quantum Spectroscopy
17
D. Transformation of Octacalcium Phosphate to Hydroxyapatite: A
Study of the Molecular Mechanism by SEM, TEM, XRD and
Solid-State NMR Spectroscopy (submitted)
22
E. C-13 Homonuclear Polarization Transfer in Biological Solids
without Proton Decoupling
47
F. Frequency
Selective
Polarization Transfer Based on Multiple
Chemical Shift Precession
55
G. Peptide Preparation and
52III. Self
Evaluation
60Appendix
Oral Presentation at the 4th Alpine conference on Solid-State
NMR, Charmonix, France.
“Efficient Spin-Spin Scalar Coupling Mediated 13C-13C
Polarization Transfer in Solid-State NMR Spectroscopy”
1
I. Introduction
In the post-genomic era, proteomics has become the new frontier in biological science. While most biotech and drug companies focus on identifying proteins associated with diseases, there are academic consortia working on different topics such as cell signaling. These large-scale research efforts, which heavily rely on cutting-edge robotics and x-ray crystallography, are expected to generate several hundred protein crystal structures a year. Nevertheless, in view of the vast complexity of proteomics, the structure-function relationships of many proteins would remain unknown in the near future. Biomineralization, which is a process describing the formation of composite materials in organisms, is a particularly challenging research area in proteomics because it is extremely difficult to study the interaction between two dissimilar organic (e.g. collagen fibrils) and inorganic nanophases (e.g. hydroxyapatite, calcium carbonate) by diffraction techniques. Thus, it has long been a mystery how living organisms control the mineral deposition with hierarchical structures. To date, the molecular mechanism of the interaction between the biopolymers and the mineral surfaces remains largely unknown. Yet our knowledge of the molecular mechanism of biomineralization is crucial for the development of implant biomaterials, e.g. bioactive glasses. Therefore in this project we manage to study the mechanism of surface reaction occurring on bioactive glass surface when soaked in simulated body fluid. Glasses that are bioactive must exhibit certain solubility to allow the necessary reactions to take place between the living tissues and the glass surface. In this proposal, we suggest to investigate the interaction between polypeptides and bioactive glasses using solid-state NMR (SSNMR) spectroscopy. In the past ten years SSNMR spectroscopy has been established as an element-selective, inherently quantitative method suited to the study of amorphous and compositionally complex systems. Many advanced SSNMR methods have been developed for the determination of internuclear distance and backbone torsion angles in isotopically labeled polypeptides. In this pilot study of SSNMR investigation of biomineralization, we manage to apply many different advanced SSNMR techniques to study different aspects of biomineralization. To the best of our knowledge, this proposal represents the first systematic investigation of the interaction between a polypeptide and bioactive glasses at the molecular level.
This project focuses on the interaction between bioactive glasses and polypeptides. There are three specific aims, viz. (i) characterization of the crystallization process of hydroxyapatite (HAP) on gel-silica glass surface; (ii) development of new SSNMR technique for the determination of backbone torsion angle ψ of polypeptides; (iii) determination of the secondary structure of polypeptide adsorbed on gel-silica glass surface. In the following sections, we will first discuss the results obtained for the characterization of the HAp crystallization process on bioactive glass surface, followed by a series of three articles on the study of the octacalcium phosphate to HAp transformation mechanism. Then, we will discuss the new pulse sequence with the acronym (MCSP) developed for homonuclear polarization transfer under magic-angle spinning. Finally, we will summarize some preliminary data obtained for the study of the glass-peptide interaction.
2
II. Results
11
17
II-C. Solid-State
NMR
Characterization
of Octacalcium Phosphate by Double
Quantum Spectroscopy
22
II-D. Transformation of Octacalcium Phosphate to Hydroxyapatite: A Study of
the Molecular Mechanism by SEM, TEM, XRD and Solid-State NMR
Spectroscopy (submitted)
Biomineralization is a biological process describing the formation of minerals in living organisms.1 Calcium phosphates are the major inorganic constituents of biological hard tissues in vertebrates, existing in the form with close resemblance to hydroxyapatite (HAp, Ca10(PO4)6(OH)2).2 The so-called biological apatite or dahllite refers to poorly crystallized
nonstoichiometric carbonate-containing HAp. Whether biological apatite is formed by direct precipitation or through an intermediate phase remains an unsettled issue in the field of biomineralization.2,3 Because of the structural similarity between HAp and octacalcium phosphate (OCP, Ca8H2(PO4)6⋅5H2O), OCP has been hypothesized as the precursor phase of
biological apatite.4 The most compelling evidence for this hypothesis is the observation of an OCP “central dark line” in many biological apatites and in some synthetically prepared HAp.5-7 OCP is thermodynamically less stable than hydroxyapatite and it is often found as an intermediate phase during the precipitation of HAp.8,9 Many in-vitro studies of calcium phosphate precipitation have been carried out to elucidate the dependence of the thermodynamic events and the crystal morphology on the degree of supersaturation,10 temperature,11,12 pH conditions13,14 and the rate of precipitation.15-22 The most informative results hitherto reported were obtained from X-ray powder diffraction (XRD), scanning electron microscopy (SEM) and transmission electron microscopy (TEM).3
OCP can be described as an alternating layer structure of apatite layer and hydrated layer,23 where the apatite layer is structurally very similar to HAp.24,25 According to the OCP precursor model proposed by Brown,4 the first calcium phosphate crystals formed in a supersaturated solution under physiological condition are OCP like. The subsequent hydrolysis step leads to the formation of HAp, where the c axes of the OCP and HAp unit cells are along the same direction during the structural transition. While this model is consistent with the results of some TEM studies,26,27 a recent computational study shows that the c axes of the OCP and HAp should be at opposite directions in order to minimize the free energy at the interface between OCP and HAp.28 It is by no means trivial to verify this computational prediction experimentally because TEM results cannot distinguish the alignment of two crystallographic axes from parallel to anti-parallel fashion. Furthermore, OCP is meta-stable and it will appear only if the pH in the crystallization system is below 6. In our previous work, we developed an in-vitro system to realize a single-crystal-to-single-crystal transformation from OCP to HAp in the presence of gelatin and urea.29 The transformation of OCP to HAp is initiated by raising the pH condition from acidic to alkaline. Since a uniform pH increase of the reaction mixture is achieved by slow decomposition of urea at 100°C, our in-vitro system is an ideal model system for the study of the molecular mechanism of OCP to HAp transition. While all the phosphorus atoms in a unit cell of HAp are equivalent, there are six crystallographically non-equivalent phosphorous sites in OCP. As such, solid-state 31P NMR is well suited to characterize the OCP to HAp transformation at the molecular level.
23
The high-resolution 31P NMR studies of OCP can be dated back to the 1980s30,31 and the complete spectral assignment has been made very recently.32,33 Throughout the years, a large variety of advanced NMR techniques such as 31P{1H} cross-polarization (CP) at variable contact delays,30 dipolar dephasing technique,31 heteronuclear correlation spectroscopy (HETCOR),34-36 differential cross polarization,37,38 and multi-nuclear double-resonance techniques39,40 had been successfully used to characterize the structures of synthetic hydroxyapatite, calcified tissues and apatite formation. Therefore, in the present study we chose to use a series of solid-state 31P NMR techniques including 31P{1H} Lee-Goldburg spectroscopy41,42 and 31P homonuclear double-quantum (DQ) NMR43 to monitor the OCP to HAp transition. The in-vitro system we developed earlier, in the absence of gelatin, is used to prepare calcium phosphate precipitated at different pH conditions. From the DQ NMR measurements we are able to show that the c axes of the OCP and HAp unit cells are at opposite directions during the transformation. Furthermore, the data of the 31P{1H} cross-polarization NMR suggest that water molecules enter the hydration layers of OCP crystals via the hydrolysis reaction HPO42- + OH- = PO43- + H2O, which also
accounts for the deprotonation of the HPO42- ions during the transformation. Overall, our NMR
data provide hitherto the most detailed description of the OCP to HAp transformation mechanism at the molecular level.
Experimental
Sample Preparation and Characterization. Urea ( 99.5%) , sodium phosphate monobasic
dehydrate (H2NaPO4・2H2O) (99%) and calcium nitrate tetrahydrate (Ca(NO3)2・4H2O) (99%)
were used as received (Acros). A mixture of 10 mmol Ca(NO3)2 ・4H2O, 10 mmol H2NaPO4・
2H2O and 20 mmol urea were dissolved in 400 mL doubly distilled water and then sealed in a
polypropylene container. The aqueous solution was kept at 100°C for different periods. The precipitates thus obtained were filtered, washed and then dried at 60°C for one day. A series of samples were obtained at different reaction times, viz. 1.5 h, 3 h, 4 h, 5 h, 6 h, 7 h, 9 h, 12 h and 96 h. All the samples will henceforth be labeled based on their reaction times. X-Ray diffraction analysis was performed on a Philips X’Pert diffractometer, using Cu-Kα radiation (λ = 1.5418 Å). The Rietvald analyses were done by the software EXPGUI.44,45 The field emission SEM were taken on a JEOL-JSM-6700F field emission scanning electron microscope operated at 10 kV. The TEM and electron diffraction (ED) patterns were taken on Hitachi S-7100 and Philips FEI Tecnai 20 G2 instruments operating at 75 kV and 200 kV, respectively.
Solid-State NMR. All NMR experiments were carried out at 31P and 1H frequencies of 121.5
and 300.1 MHz, respectively, on a Bruker DSX300 NMR spectrometer equipped with a commercial 4-mm probe. All spectra were measured at room temperature. The sample was confined to the middle 1/3 of the rotor volume using Teflon spacers. The variation of magic-angle spinning (MAS) frequency was limited to ± 3 Hz using a commercial pneumatic control unit. Chemical shifts were externally referenced to 85% phosphoric acid and TMS for 31P and 1H, respectively. The 31P MAS spectra were measured at a spinrate of 10 kHz and with 70 kHz proton
24
decoupling. An exponential window function of 20 Hz line broadening was applied to each FID before the Fourier transformation.
The 31P{1H} CP heteronuclear correlation (HETCOR) spectra were measured at a spinrate of 10 kHz. During the contact time (2.5 ms) the 1H nutation frequency was set equal to 50 kHz and that of 31P was ramped through the Hartmann-Hahn matching sideband.46 Quadrature detection in the F1 dimension was achieved by the hypercomplex approach. Typically, for each t1 increment
32 transients were accumulated, and a total of 50 increments were done at steps of 100 µs. The 31P{1H} Lee-Goldburg CP (LG-CP) spectra were measured at a spinrate of 10 kHz. The flip angle of the pulse after the t1 evolution is adjusted so that the spin-temperature inversion can
be realized by phase alternating the first π/2 pulse. During the contact time the 1H nutation
frequency and the resonance offset were set equal to 50 and 35.35 kHz, respectively, to fulfill the Lee-Goldburg irradiation condition. The 31P DQ experiments were carried out under MAS spinning frequency of 10 kHz based on the so-called HSMAS-DQ technique.33,47 To prepare the initial spin system identically for each transient, a saturation comb was applied prior to the recovery delay (8 s). During the DQ excitation and reconversion periods, the 31P π/2 and π pulses were set to 5 and 30 µs long, respectively. The π pulse trains were phase cycled according to the XY-8 scheme.48 The DQ reconversion period was set equal to the excitation period. Proton decoupling was set to 85 kHz during the DQ excitation/reconversion periods. A more detailed description of the experiment was given elsewhere.33
Results and Analyses
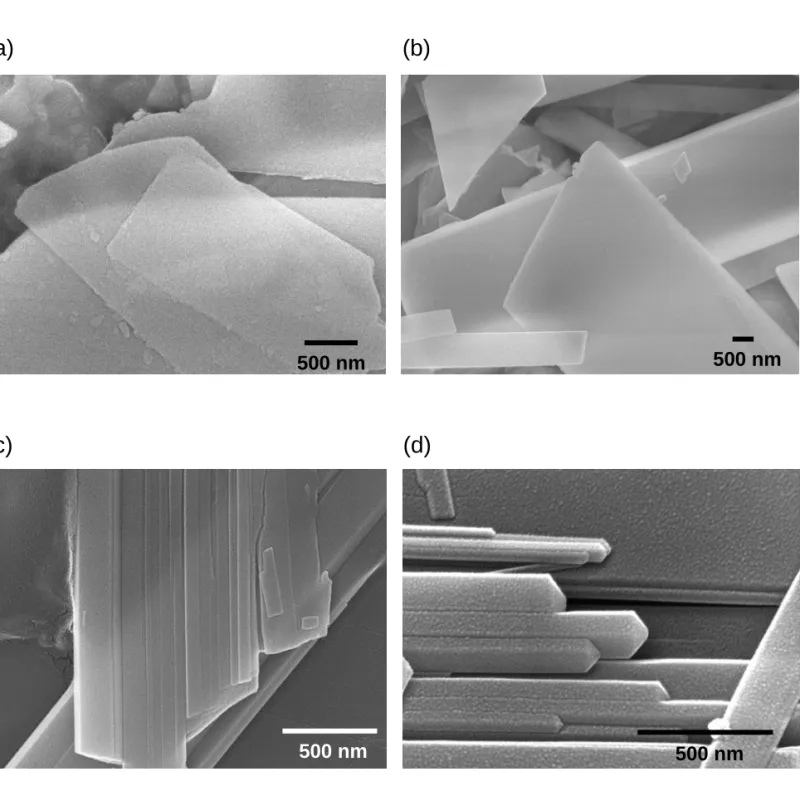
A. SEM. The pH values of the reaction mixture at different times are summarized in Table 1.
Referring to the SEM images of our sample series shown in Figure 1, the crystals of the 1.5-h sample are poorly faceted rectangular plates. The blade-like crystals of the 3-h sample is the characteristic morphology of OCP. As the pH value of the reaction mixture rose to 5.01 at which the 4-h sample was collected, notches become found on the rectangular OCP crystals. Formation of slits along the c axis is also observed in previous study.14,29 The 12-h sample was collected at pH of 6.69 and the crystals are mainly hexagonal rod-shaped.
B. TEM and ED. The 3-h, 6-h and 12-h samples were characterized by TEM and ED. The long
edge of the blade-like OCP crystal is found to be along the c axis. The selected-area electron diffraction (SAED) patterns of the 3-h and 12-h samples can be assigned to the reflections along the [110] zone axis of OCP and the [210] zone axis of HAp, respectively. Consequently, the SAED patterns of the two samples can be served as a reference for the analysis of the SAED pattern of the 6-hr sample. Figure 2(a) shows the TEM image of the 6-h sample. Consistent with what has been observed in the SEM image, the blade-like crystal splits along its long edge. Referring to Figure 2(b), the SAED pattern of the notch area can be indexed to the [210] zone axis of HAp as well as the [110] zone axis of OCP. Both the c axes of HAp and OCP in the 6-hr sample are parallel or anti-parallel with respect to the slits along the elongated side of the blade-like crystal. This alignment of the crystallographic c axes of OCP and HAp is an important structural constraint for the OCP to HAp transformation (vide infra).
25
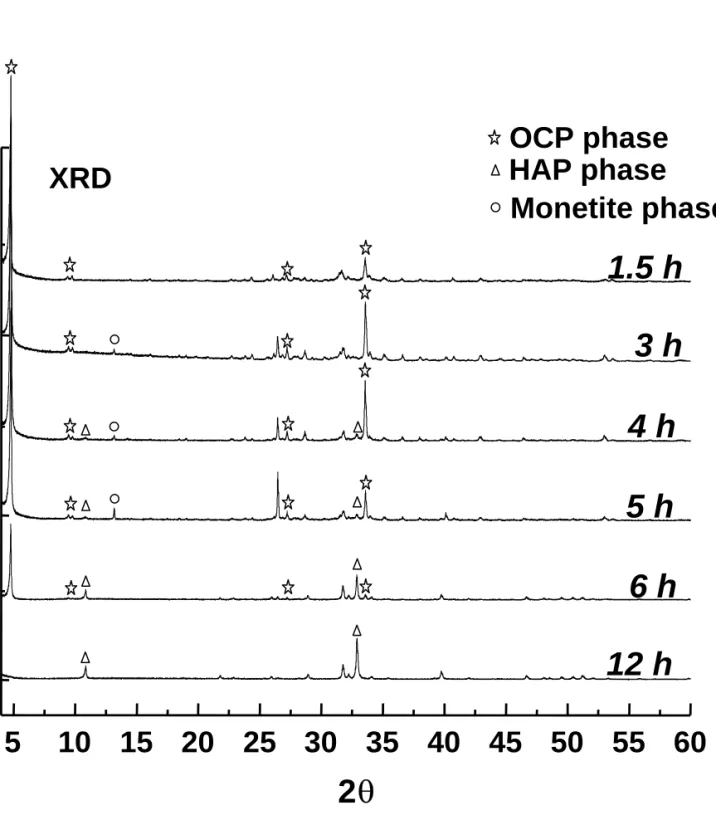
C. XRD. As an independent approach to identify the crystalline phases of our samples, the
XRD patterns were measured (Figure 3). Any reflections at 2θ = 4.9°, 10.8° and 13.1° can be considered as the characteristic peaks of OCP (JCPDS 44-0778), HAp (JCPDS 24-0033) and monetite (JCPDS 09-0080), respectively. For the 1.5-h sample, the absence of the reflections at 2θ = 10.8° and 13.1° indicates that the sample is pure OCP. For the 3-h sample, trace amount of monetite is present in addition to OCP. The crystalline phase of HAp becomes observable for the 4-h sample. For the samples with longer reaction time, the HAp crystalline phase becomes more prominent at the expense of OCP and monetite. Eventually, the 12-h sample is pure HAp. Note that the two characteristic reflections of brushite (CaHPO4⋅2H2O) at 2θ = 11.6° and 23.4° are not
found in our samples (JCPDS 11-0293). The variation in the lattice parameters was analyzed by Rietvald analysis. As summarized in Table 2, the lattice parameters of the 3-h and 5-h samples are approximately the same but both the a and b axes of the OCP lattice have significant increase in the 4-h sample.
D. Solid-State NMR. Figure 4 shows the 31P MAS spectra measured for our sample series,
together with the spectral assignment we made earlier.32 It is quite clear that the samples of reaction times from 1.5 h to 5 h contain mainly the OCP species. The crystallinity is rather poor for the 1.5-h sample because the corresponding signals have larger line widths than the 3-h sample. This observation is consistent with our SEM data, in which the crystals of the 1.5-h sample are found to be poorly faceted. Presumably, there are a lot of excess water molecules in the 1.5-h sample which cannot be accommodated in the OCP lattice. Judging from the NMR spectrum, the molecular structure of the 3-h sample is closest to that of pure OCP, in spite of the fact that trace amount of monetite is present in it. The 31P chemical shift data and the assignment of the 3-h sample are summarized in Table 3. As the reaction time proceeds to 6 h, a significant change in the signal pattern is observed, showing that the system has undergone a considerable change in the phosphorus environments. Note that the 6-h spectrum is not a superposition of the 3-h (OCP) and the 12-h (HAp) spectra. Therefore, re-precipitation is unlikely the predominant transformation mechanism. The structural transition is essentially completed after 12 h because the spectra of the 12-h and 96-h samples are identical. The spectrum of the 12-h sample shows a single peak positioned at 3.2 ppm and is readily assigned to the PO43- group of HAp.49 This series
of spectra demonstrate that the transformation of OCP to HAp can be effectively monitored by taking 31P as the probe nucleus.
31
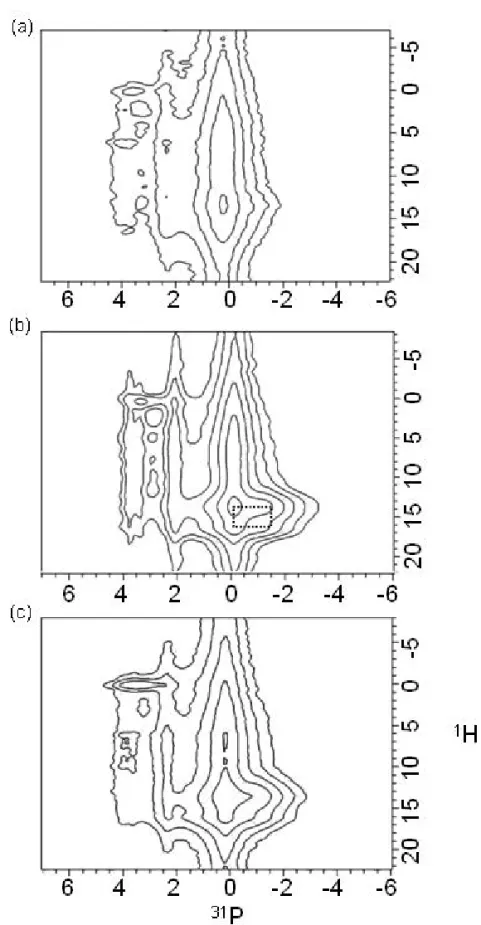
P{1H} Heteronuclear Correlation (HETCOR). To obtain a better spectral resolution we
measured the 31P{1H} HETCOR spectra for the sample series. Figure 5 shows the HETCOR spectra of the 1.5-h, 3-h and 5-h samples. Consider the spectrum of the 1.5-h sample, the 31P peak at -0.2 ppm (P5 and P6) is correlated to the 1H signals at 5.5 and 13.3 ppm, which have been assigned to the structural water and the acidic proton of the HPO42- ions.50 Note that a relatively
weak correlation peak can also be identified for the 1H signal at 0.2 ppm and the P2 signal (3.3 ppm). This correlation peak is a well-known marker for apatite-like structures.34,35,40,50 For the spectrum of the 3-h sample, an additional set of cross peaks denoted by a rectangle is observed, which is due to the HPO42- group of monetite.30,32,50 As the reaction time proceeds further, the
26
expense of the monetite and the OCP signals (see Figure S 1 of the Supporting Information). Overall, our HETCOR data is in complete agreement with the XRD results.
31
P{1H} Lee-Goldburg Cross Polarization. Recently, it has been shown that the LG
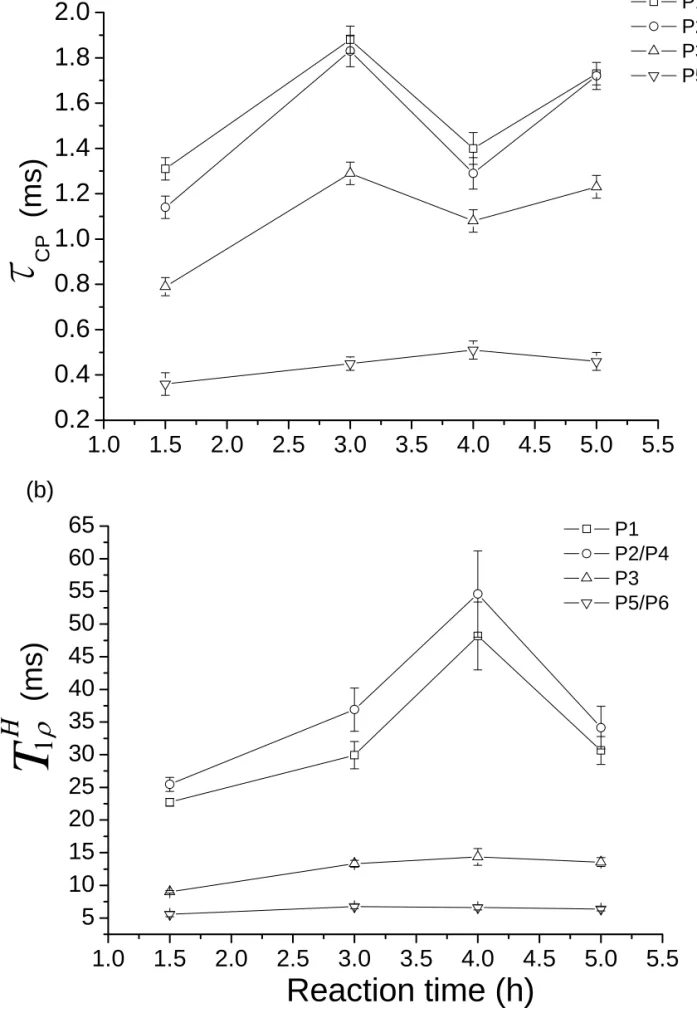
homonuclear decoupling technique can be combined with CP to achieve polarization transfer with efficient suppression of 1H-1H spin diffusion.41,42 Therefore, it is possible to investigate the hydration state of the individual phosphorus species by measuring the LG-CPMAS spectra with variable contact times. The intensities of the four resolved 31P signals (P1, P2/P4, P3, P5/P6) were fitted by the following equation as a function of contact time (τCP) and relaxation time (
H T1ρ ):
( )
{
(
)
}
(
H)
CP t T t I t I = 0 1−exp − τ exp− 1ρTypical fitting of the raw data was shown in Figure S 2 of the Supporting Information. The parameters τCP and
H
T1ρ obtained for our sample series were shown in Figure 6, which do not
show any strong correlation in the non-linear least-squares fittings. Consider the data of the 1.5-h sample, the relative τCP and
H
T1ρ values are consistent with the facts that (i) P5 and P6 are
HPO42- species; (ii) P3 is hydrogen bonded to one of the HPO42- groups; (iii) the distance
between P2 and its closest neighboring water molecule is 3.5 Å; (iv) P1 is rather isolated from all the water molecules (distance > 4.6 Å).25 For the 3-h sample, the
CP
τ and H
T1ρ values of the
PO43- species increase considerably. Together with the fact that the 31P signal line widths are
narrower for the 3-h sample, it can be surmised that the crystallinity of the 3-h sample improves when those excess water molecules are expelled from the structure. For the 4-h and 5-h samples, the τCP values of all the PO43- species decrease significantly and then increase again. An
opposite trend was observed for the H
T1ρ data. This interesting variation of the τCP and H
T1ρ
values of the PO43- species is possibly due to a change in the hydration level of the phosphate
ions. As the pH of the reaction mixture increases continuously due to the decomposition of urea, the equilibrium of the following reaction shifts to the right:
HPO42- + OH- = PO43- + H2O.
When the pH value reaches 5.01 at which we collect the 4-h sample, more water molecules will enter the hydration layer of the OCP structure, resulting in the formation of straight notches along the c-axis for the 4-h sample (Figure 1). Indeed, the Rietvald analysis of the XRD patterns show that both the a and b axes of the OCP unit cells increase considerably for the 4-h sample. Our interpretation is also in line with the 31P MAS spectrum of the 4-h sample, where the line widths of the P1 and P2/P4 signals are somewhat broadened due to an increase in structural disorder. Consequently, the water molecules in the 4-h sample will cause a decrease in the τCP value because we have more water molecules surrounding the PO43- species. On the other hand, T1Hρ is
sensitive to molecular motions in the frequency range around the effective LG irradiation field (c.a. 61 kHz).51 Therefore, as more water molecules enter the OCP hydration layer, the more
27
frequent collision among the water molecules, which should be much faster than the inverse of 61 kHz, will cause an increase in H
T1ρ . As the pH of the reaction mixture increases further, the
excessive water molecules in the hydration layer start to diffuse out of the OCP structure, resulting in an increase in τCP and a decrease in
H
T1ρ for the 5-h sample. Accordingly, the cell
dimensions of the 5-h sample become comparable to those of the 3-h sample (Table 2). Note that the variation in the CP dynamics of P3 is not as dramatic as those of P1, P2 and P4 because P3 is hydrogen bonded to the acidic proton of P6.25
31
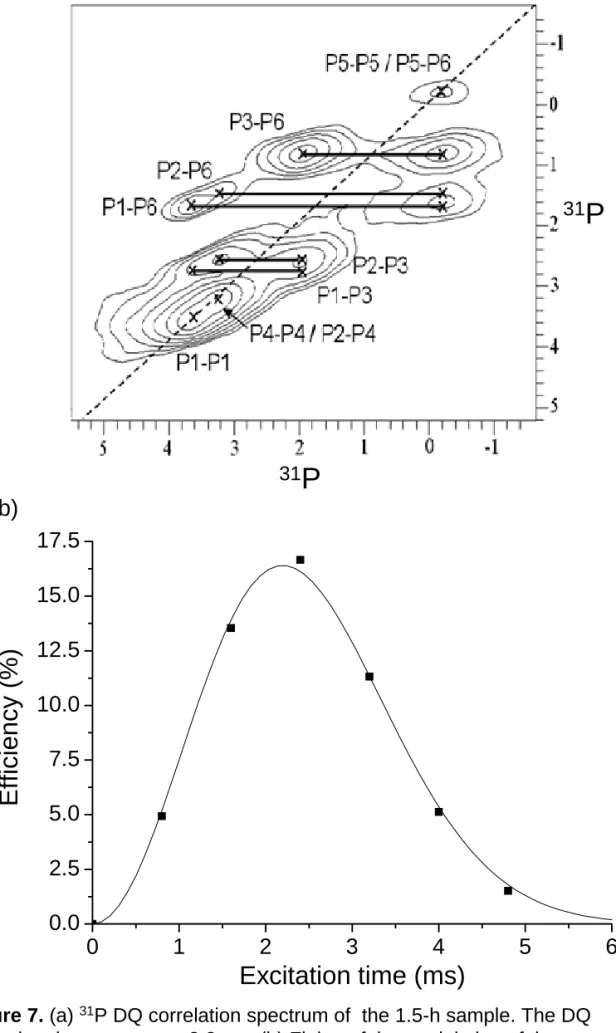
P-31P Double Quantum NMR. When two or more nuclear spins are in close proximity, they
become coupled through the homonuclear dipole-dipole interaction. The magnitude of such interaction is inversely proportional to the third power of the internuclear distance. The so-called DQ coherence is a concerted evolution of coupled spins. The two-dimensional 31P DQ spectrum of the 1.5-h sample is shown in Figure 7(a), where there are eight sets of auto- and cross-correlation peaks assigned to the OCP signals. Surprisingly, in the DQ spectra measured for the 3-h, 4-h and 5-h samples we do not observe any correlation peaks due to monetite (see Figure S 3 of the Supporting Information). Referring to Figure 7(a), by varying the DQ excitation and reconversion periods systematically, one can fit the intensities of the correlation peaks as a function of the excitation time based on the following equation40
( )
A{
B}
I exe exe exe
2 2 exp τ
τ
τ = −
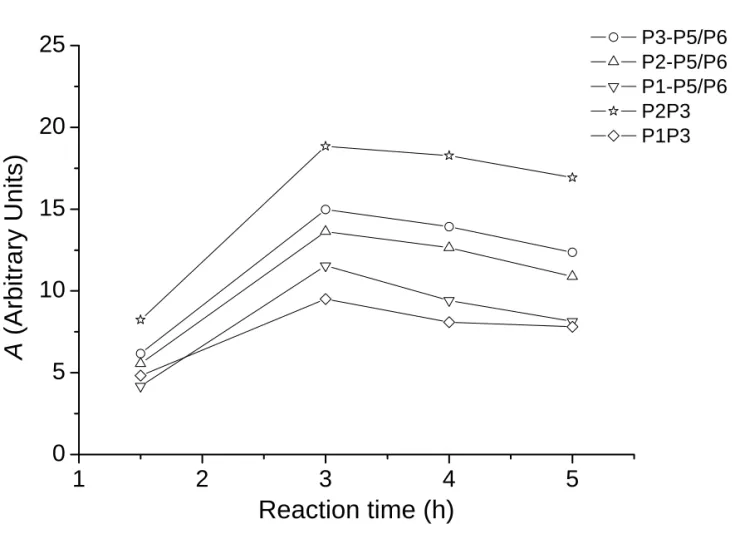
In the above equation the build up of the DQ signals is described by a parabolic function52,53 and the decay of the DQ signals is approximated by a Gaussian function.54 Figure 7(b) illustrates such a fit for the P3-P6 DQ signals of the 1.5-h sample, in which the signal intensities had been normalized with respect to the MAS signals measured under identical conditions (spinning frequency, saturation comb and relaxation delay).33 In principle, the parameter A can be used to determine the van Vleck’s second moment of the coupled spins, whose magnitude depends on both the number of interacting spins and the internuclear distances.55 However, the quantification of the second moment in the present study is not warranted due to the different efficacy of proton decoupling for different phosphorus species. Nevertheless, the variation of the parameter A should reflect the same variation in the second moment for a particular DQ signal, provided that the efficacy of the proton decoupling remains approximately the same. On the other hand, since the values of the parameter B are affected by both the 31P spin-spin relaxation times and the spatial arrangement of the interacting phosphorus species, it is difficult to interpret the data trend unequivocally.
Figure 8 summarizes the values of the parameter A extracted for the cross-correlation peaks of our sample series. As expected, the A values for the 1.5-h sample are attenuated significantly due to insufficient proton decoupling. For the 3-h sample, the following data trend is parallel to what we expected from the calculated van Vleck’s second moment:
3 2 P P
A − > AP3−P5/P6 > AP2−P5/P6 > AP1−P5/P6 > AP1 P− 3
(3.19) (1.84) (1.08) (0.46) (0.35)
where the bracketed data denote the corresponding second moments (× 106 rad2/s2) calculated
28
should be very similar for the 3-h and the 5-h samples. Therefore it is legitimate to calculate the percentage change of their A values corresponding to the same DQ coherence and compare the results with what we expected from our model for the OCP transformation (vide infra).
E. Computer Assisted Lattice Matching. It has been well established that the apatitic layer of
OCP is structurally very similar to HAp. Indeed, our TEM/ED results are consistent with the scenarios that the c axes of the OCP and HAp unit cells are parallel or anti-parallel to one another during the phase transformation. For the OCP to HAp transformation, we assume that the phosphorus sites of OCP will take the shortest pathways to migrate to the nearest phosphorus sites of HAp. We generate two unit-cell models, viz. the guest and the host. The guest model contains the Cartesian coordinates of 24 phosphorus atoms in four unit cells of HAp while the host model contains the coordinates of 96 phosphorus atoms in 2 × 2 × 2 unit cells of OCP. Initially, the crystallographic c axes of both models are aligned in the same direction. The coordinates of the guest lattice are then mapped onto the host lattice rotationally and translationally. The rotation is about the c axis at steps of one degree and the translations are along three orthogonal axes at steps of 0.5 Å. The mean-square deviations (χ2) between the OCP phosphorus sites of the apatite layer and the corresponding nearest HAp sites are calculated for each matching step. For the best matching with minimum χ2, the shortest distances between selected OCP sites are calculated after they have been mapped onto the corresponding HAp sites. In other words, we label all the phosphorous atoms in the HAp lattice by the name tags of the six non-equivalent phosphorus sites in OCP and then calculate the corresponding distances of, say, P2-P3. Based on the distance information the van Vleck’s second moments arising from P2-P3 are calculated using the following formula:55
(
+)
∑
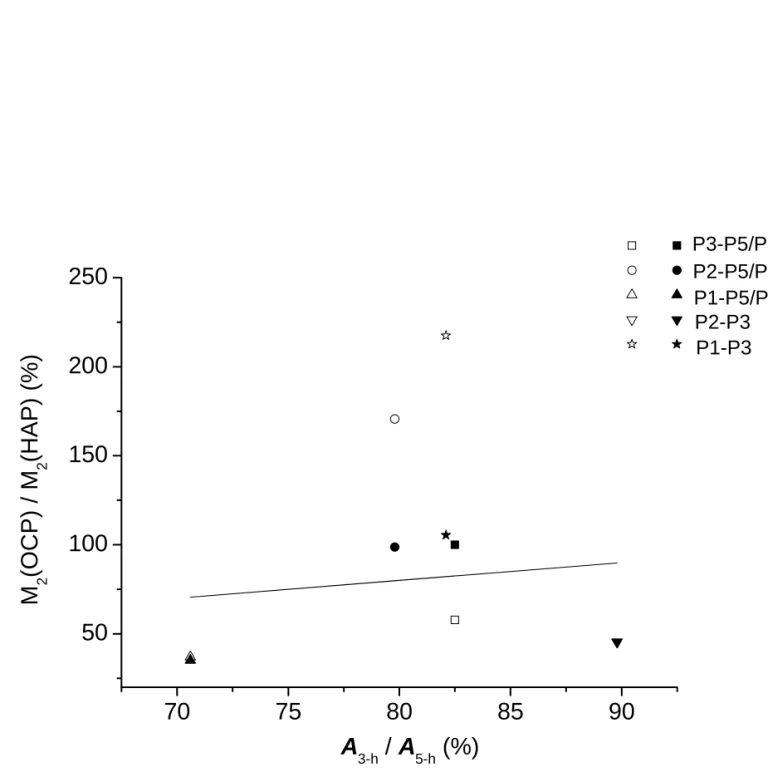
= j rj I I M2 4 2 1 16 5 3 = γThe ratio of the P2-P3 M2 values calculated for the matched HAP lattice and the OCP lattice are thus obtained. Similarly we obtained the ratios corresponding to the M2 values of P1-P3, P1-P5/P6 and so on. All the calculations were then repeated for opposite alignment of the crystallographic c axes of the guest and host models (see Table S1 of the Supporting Information). Provided that the phosphorus sites of OCP will take the shortest pathways to migrate to the nearest phosphorus sites of HAp, the ratios of the experimental A values of P2-P3 measured for the 3-h and 5-h samples should be very similar to that calculated in our lattice matching model. Figure 9 plots the calculated ratios versus the ratios of the experimental A values. Note that a perfect agreement between the calculated and experimental ratios is not expected because the OCP to HAp transformation is not yet completed for the 5-h sample. Overall, our DQ experimental data are more consistent with the scenario that the crystallographic c axes of OCP and HAp are in opposite direction during the transformation. In addition, the lattice matching results for the anti-parallel alignment of the c-axes show that during the structural transformation the b axis of OCP is parallel to the a or b axis of HAP, where the a and b axes of HAP are equivalent because of the hexagonal symmetry of the unit cells.
29
Double-Quantum NMR in Multiple-Spin Systems. DQ NMR spectroscopy under magic
angle spinning has been the major research area in the solid-state NMR community for many years. Since the pioneering work of Tycko,56 numerous pulse sequences designed for DQ NMR have been reported in the literature.57-60 Our previous work illustrates that the excitation of DQ coherence is inherently difficult in multiple-spin system due to the dephasing effect of other passive spins.33 It has also been shown that distance measurement by DQ NMR spectroscopy in homonuclear spin system is practical only if the two-spin approximation holds.61 Nevertheless, here we have demonstrated that it remains possible to employ DQ NMR spectroscopy to monitor the change of the spatial arrangement of interacting spins, provided that an adequate structural model is constructed to interpret the variation of the DQ signal intensities. In this work, our computer assisted lattice matching provides such a model in which the structural constraint obtained by SAED measurements is incorporated. We note in passing that Levitt and co-workers have successfully employed solid-state 29Si DQ dipolar recoupling NMR to help elucidate the crystal structures of siliceous zeolite model compounds by measuring distance-dependent dipolar interactions between naturally abundant 29Si nuclei in the zeolite frameworks, where the two-spin approximation clearly holds for two interacting 29Si nuclei.62,63
OCP to HAp transition. In an early study by Eanes and Meyer, the nature of the phase
changes occurring in spontaneously precipitated amorphous calcium phosphate (ACP) was studied under physiological condition.9 Based on the measured ion concentrations and Ca/P ratio, it was concluded that the ACP precipitate would first transform into an OCP-like phase which subsequently hydrolyzed into apatite. This result is consistent with the Ostwald-Lussac law of stages, which states that under conditions of sequential precipitation the initial phase formed is the one with the highest solubility followed by other crystalline phases in order of decreasing solubility.1 For our in-vitro system, we also observe the co-precipitation of monetite at 100ºC. In the thermodynamic aspect, the co-precipitation of monetite is not unexpected because the solubility product of brushite, the hydrated form of monetite, is very similar to that of OCP at pH around 4.71 to 5.12.64 The detection of co-precipitation of monetite by the HETCOR NMR technique is of great interest in the study of biomineralization because diffraction techniques are unlikely to distinguish between HAp, OCP or monetite when the crystallites are thinner than 10 nm as reported for bone.65 Based on the similarity of the calcium phosphate chains present in both the OCP and monetite structures, it has been speculated the formation of intracrystalline mixture of OCP and monetite by direct precipitation or by hydrolysis of OCP.65 From our NMR data, however, we have no direct evidence for the existence of such intracrystalline mixture. The absence of the monetite 31P signals in the DQ spectra of our 3-h, 4-h and 5-h samples could be explained by the argument that the amount of the monetite phase is too low to give any appreciable DQ signals.
Some years ago, Nelson and co-workers described the OCP to HAp transformation as a simple dehydration process.12 Here, we could refine this description further for our in-vitro system as follows. The OCP crystals obtained at 1.5 h contain a lot of structural waters, rendering the crystallinity rather poor. The amorphous character of the crystals reveals that the formation of OCP crystals is preceded by the precipitation of ACP. When the pH of the reaction mixture is
30
lower than 4.71, those water molecules in excess will be eventually driven out of the lattice, resulting in an improvement of the crystallinity. As the pH increases to around 5, water molecules will reenter the OCP lattice, presumably through the hydration layer of the OCP structure. This reversal in water flow direction is accompanied by a significant lengthening of the crystallographic a and b axes, causing an expansion of the OCP lattice. The “crowded” water molecules in the hydration layer then provide a collisional mechanism for the relocation of the HPO42- groups (P5 and P6) as shown in Figure 10. In spite of the 2.1 % mismatch between the
(100) crystal planes of OCP and HAp, the structural stress induced by the movement of P5 and P6 will cause the apatite layers in the blade-like OCP crystals splitted across the b axis. The HPO42- ions are subsequently deprotonated and the water molecules of the hydration layers are
released to stabilize the structure. Those apatite layers serve as nucleation centers for further crystal growth, leading to the formation of hexagonal HAp rods eventually, where the c axis of the newly formed HAp lattice is anti-parallel to that of the precursor OCP lattice.
Implication in Biomineralization. According to the crystallographic data and our assignment
of the 31P MAS spectrum of the 3-h sample, the peaks positioned at -0.2 (P5, P6), 2.0 (P3), 3.3 (P2, P4) and 3.7 (P1) ppm should have an intensity ratio of 2:1:2:1 but what has been measured for our OCP sample is 3:1:1:1 (Table 3). To rationalize the 31P NMR peak intensity ratio we have previously suggested that some of the PO43- groups at the P2 and P4 sites are involved in the
following transformation to become HPO42-ions:32
HPO42- + OH- = PO43- + H2O.
In our analysis of the 31P{1H} LG-CP data, the same mechanism can be applied to explain the intrusion of water molecules into the hydration layers and the deprotonation of the HPO42- ions.
We surmise that this hydrolysis reaction may also take an important role in the formation of biological apatites in bones or teeth.
Conclusion
In summary, we have established a very useful in-vitro system to obtain HAp nanorods with different morphologies by homogeneous precipitation of OCP crystals. Our data obtained by a series of physical techniques, with particular emphasis in solid-state NMR, provide a detailed description of the molecular mechanism of OCP to HAp transformation. For the first time it has been shown experimentally that OCP crystals transform to HAp topotaxially along their c axes with anti-parallel relationship, instead of the parallel relationship as presumed in the literature. Furthermore, we find that the hydrolysis reaction of the PO43- and HPO42- ions is the key
chemical reaction for OCP to HAp transformation. While the scope of this work is limited to the molecular mechanism of OCP to HAp transition, the solid-state NMR approach established here can be readily applied to the studies of bones and teeth.
31
Table 1. Summary of the pH values of the reaction mixture at different periods
Reaction Time (h) pH 0 4.35 1.5 4.50 3 4.71 4 5.01 5 5.12 6 5.87 12 6.69
Table 2. Summary of the lattice parameters obtained by Rietvald analysis.
Sample a [Å] b [Å] c [Å] cell volume [Å3]
1.5-h 19.7316(8)a 9.5615(3) 6.8508(2) 1224.96(7)
3-h 19.7049(9) 9.5525(4) 6.8447(2) 1222.59(8) 4-h 19.8456(38) 9.5941(17) 6.8445(9) 1232.03(32) 5-h 19.7017(10) 9.5490(5) 6.8471(2) 1222.57(9)
a The bracketed values are error estimations.
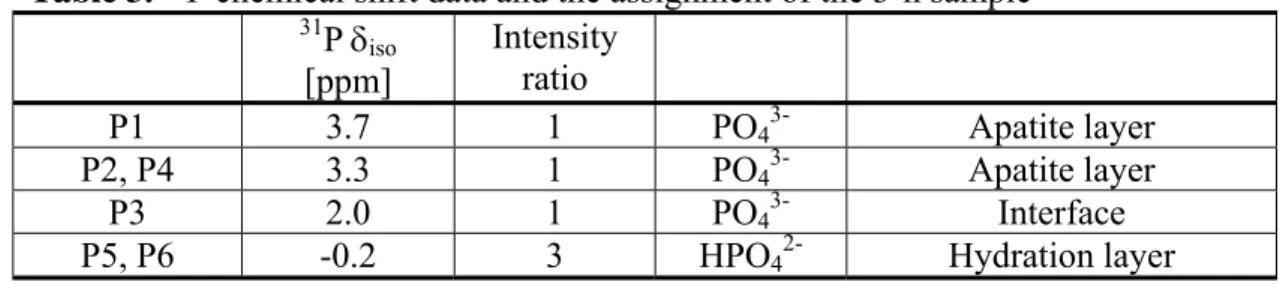
Table 3. 31P chemical shift data and the assignment of the 3-h sample
31P δ iso [ppm] Intensity ratio P1 3.7 1 PO43- Apatite layer P2, P4 3.3 1 PO43- Apatite layer P3 2.0 1 PO43- Interface
P5, P6 -0.2 3 HPO42- Hydration layer
REFERENCES
(1) Mann, S., Biomineralization - Principles and Concepts in Bioinorganic Materials
Chemistry. Oxford University Press: New York, 2001.
(2) Dorozhkin, S. V.; Epple, M., Angew. Chem. Int. Ed. 2002, 41, 3130. (3) Iijima, M.; Moradian-Oldak, J., J. Mater. Chem. 2004, 14, 2189. (4) Brown, W. E., Clin. Orthop. 1966, 44, 205.
(5) Iijima, M.; Nelson, D. G. A.; Pan, Y.; Kreinbrink, A. T.; Adachi, M.; Goto, T.; Moriwaki, Y., Calcif. Tissue Int. 1996, 59, 377.
(6) Bodier-Houlle, P.; Steuer, P.; Voegel, J. C.; Cuisinier, F. J. G., Acta Crystallogr. D 1998, 54, 1377.
(7) Aoba, T.; Komatsu, H.; Shimazu, Y.; Yagishita, H.; Taya, Y., Connect. Tissue Res. 1998,
39, 129.
(8) Nancollas, G. H.; Tomazic, B., J. Phys. Chem. 1974, 78, 2218. (9) Eanes, E. D.; Meyer, J. L., Calcif. Tissue Res. 1977, 23, 259. (10) Boskey, A. L.; Posner, A. S., J. Phys. Chem. 1976, 80, 40.
(11) Chickerur, N. S.; Tung, M. S.; Brown, W. E., Calcif. Tissue Int. 1980, 32, 55. (12) Nelson, D. G. A.; McLean, J. D., Calcif. Tissue Int. 1984, 36, 219.
(13) Eanes, E. D.; Posner, A. S., Mater. Res. Bull. 1970, 5, 377.
(14) Iijima, M.; Kamemizu, H.; Wakamatsu, N.; Goto, T.; Doi, Y.; Moriwaki, Y., J. Cryst.
Growth 1997, 181, 70.
(15) Kniep, R.; Busch, S., Angew. Chem.-Int. Edit. Engl. 1996, 35, 2624.
(16) Iijima, M.; Moriwaki, Y.; Yamaguchi, R.; Kuboki, Y., Connect. Tissue Res. 1997, 36, 73. (17) Schwarz, K.; Epple, M., Chem.-Eur. J. 1998, 4, 1898.
32
(18) Busch, S.; Dolhaine, H.; DuChesne, A.; Heinz, S.; Hochrein, O.; Laeri, F.; Podebrad, O.; Vietze, U.; Weiland, T.; Kniep, R., Eur. J. Inorg. Chem. 1999, 1643.
(19) Falini, G.; Gazzano, M.; Ripamonti, A., J. Mater. Chem. 2000, 10, 535.
(20) Iijima, M.; Moriwaki, Y.; Takagi, T.; Moradian-Oldak, J., J. Cryst. Growth 2001, 222, 615.
(21) Peters, F.; Epple, M., J. Chem. Soc.-Dalton Trans. 2001, 3585.
(22) Iijima, M.; Moriwaki, Y.; Wen, H. B.; Fincham, A. G.; Moradian-Oldak, J., J. Dent. Res.
2002, 81, 69.
(23) Brown, W. E., Nature (London) 1962, 196, 1048.
(24) Kay, M. I.; Young, R. A.; Posner, A. S., Nature (London) 1964, 204, 1050.
(25) Mathew, M.; Brown, W. E.; Schroeder, L. W.; Dickens, B., J. Crystallogr. Spectrosc. Res.
1988, 18, 235.
(26) Suvorova, E. I.; Madsen, H. E. L., J. Cryst. Growth 1999, 199, 677. (27) Iijima, M.; Tohda, H.; Moriwaki, Y., J. Cryst. Growth 1992, 116, 319.
(28) Fernandez, M. E.; Zorrilla-Cangas, C.; Garcia-Garcia, R.; Ascencio, J. A.; Reyes-Gasga, J.,
Acta Crystallogrc. 2003, B59, 175.
(29) Zhan, J.; Tseng, Y.-H.; Chan, J. C. C.; Mou, C.-Y., Advan. Func. Mater. 2005. (30) Rothwell, W. P.; Waugh, J. S.; Yesinowski, J. P., J. Am. Chem. Soc. 1980, 102, 2637. (31) Aue, W. P.; Roufosse, A. H.; Glimcher, M. J.; Griffin, R. G., Biochemistry 1984, 23, 6110. (32) Tseng, Y. H.; Zhan, J. H.; Lin, K. S. K.; Mou, C. Y.; Chan, J. C. C., Solid State Nucl.
Magn. Reson. 2004, 26, 99.
(33) Tseng, Y. H.; Mou, Y.; Mou, C. Y.; Chan, J. C. C., Solid State Nucl. Magn. Reson. 2005,
27, 266.
(34) Santos, R. A.; Wind, R. A.; Bronnimann, C. E., J. Magn. Reson. Ser. B 1994, 105, 183. (35) Kaflak-Hachulska, A.; Samoson, A.; Kolodziejski, W., Calcif. Tissue Int. 2003, 73, 476. (36) Cho, G. Y.; Wu, Y. T.; Ackerman, J. L., Science 2003, 300, 1123.
(37) Wu, Y.; Ackerman, J. L.; Strawich, E. S.; Rey, C.; Kim, H. M.; Glimcher, M. J., Calcif.
Tissue Int. 2003, 72, 610.
(38) Isobe, T.; Nakamura, S.; Nemoto, R.; Senna, M.; Sfihi, H., J. Phys. Chem. B 2002, 106, 5169.
(39) Chan, J. C. C.; Ohnsorge, R.; Meise-Gresch, K.; Eckert, H.; Holand, W.; Rheinberger, V.,
Chem. Mater. 2001, 13, 4198.
(40) Lin, K. S. K.; Tseng, Y. H.; Mou, Y.; Hsu, Y. C.; Yang, C. M.; Chan, J. C. C., Chem.
Mater. 2005, 17, 4493.
(41) van Rossum, B. J.; de Groot, C. P.; Ladizhansky, V.; Vega, S.; de Groot, H. J. M., J. Am.
Chem. Soc. 2000, 122, 3465.
(42) Ladizhansky, V.; Vega, S., J. Chem. Phys. 2000, 112, 7158.
(43) Ernst, R. R.; Bodenhausen, G.; Wokaun, A., Principles of Nuclear Magnetic Resonance in
One and Two Dimensions. Clarendon Press: Oxford, 1987.
(44) Larson, A. C.; von Dreele, R. B., Los Alamos National Laboratory Report LA-UR 2000, 86-748.
(45) Toby, B. H., J. Appl. Cryst. 2001, 34, 210.
(46) Metz, G.; Wu, X. L.; Smith, S. O., J. Magn. Reson. A 1994, 110, 219. (47) Oyler, N. A.; Tycko, R., J. Phys. Chem. B 2002, 106, 8382.
(48) Gullion, T.; Baker, D. B.; Conradi, M. S., J. Magn. Reson. 1990, 89, 479. (49) Tropp, J.; Blumenthal, N. C.; Waugh, J. S., J. Am. Chem. Soc. 1983, 105, 22. (50) Yesinowski, J. P.; Eckert, H., J. Am. Chem. Soc. 1987, 109, 6274.
(51) Freeman, R., Spin Choreography: Basic Steps in High Resolution NMR. Oxford University Press: New York, 1998.
(52) Bertmer, M.; Eckert, H., Solid State Nucl. Magn. Reson. 1999, 15, 139. (53) Gunne, J.; Eckert, H., Chem.-Eur. J. 1998, 4, 1762.
(54) Engelsberg, M.; Norberg, R. E., Phys. Rev. B 1972, 5, 3395.
(55) Abragam, A., Principles of Nuclear Magnetism. Clarendon Press: Oxford, 1961. (56) Tycko, R.; Dabbagh, G., Chem. Phys. Lett. 1990, 173, 461.
33
(57) Tycko, R., Annu. Rev. Phys. Chem. 2001, 52, 575.
(58) Baldus, M., Prog. Nucl. Magn. Reson. Spectrosc. 2002, 41, 1. (59) Luca, S.; Heise, H.; Baldus, M., Accounts Chem. Res. 2003, 36, 858. (60) Schnell, I., Prog. Nucl. Magn. Reson. Spectrosc. 2004, 45, 145. (61) Gunne, J., J. Magn. Reson. 2003, 165, 18.
(62) Brouwer, D. H.; Darton, R. J.; E., M. R.; Levitt, M. H., J. Am. Chem. Soc. 2005, 127, 10365.
(63) Brouwer, D. H.; Kristiansen, P. E.; Fyfe, C. A.; Levitt, M. H., J. Am. Chem. Soc. 2005, 127, 542.
(64) Heughebaert, J. C.; Nancollas, G. H., J. Phys. Chem. 1984, 88, 2478.
(65) Brown, W. E.; Smith, J. P.; Lehr, J. R.; Frazier, A. W., Nature (London) 1962, 196, 1050.
Supporting Information.
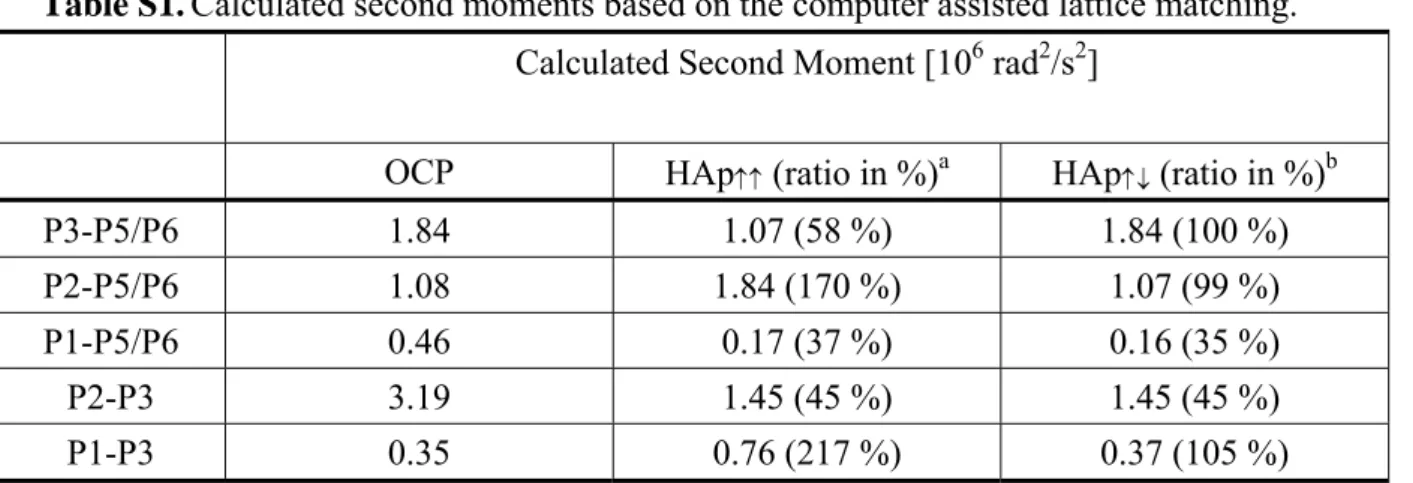
Table S1.Calculated second moments based on the computer assisted lattice matching.
Calculated Second Moment [106 rad2/s2]
OCP HAp↑↑ (ratio in %)a HAp↑↓ (ratio in %)b
P3-P5/P6 1.84 1.07 (58 %) 1.84 (100 %) P2-P5/P6 1.08 1.84 (170 %) 1.07 (99 %) P1-P5/P6 0.46 0.17 (37 %) 0.16 (35 %) P2-P3 3.19 1.45 (45 %) 1.45 (45 %) P1-P3 0.35 0.76 (217 %) 0.37 (105 %) a HAp
↑↑ denotes the HAp lattice matched to the OCP lattice with both c axes aligned in parallel
fashion. The ratio is obtained with respect to the second moments calculated for the OCP lattice.
b HAp
↑↓ denotes the HAp lattice matched to the OCP lattice with both c axes aligned in
(a)
(b)
500 nm 500 nm
(c)
(d)
500 nm 500 nm
Figure 1. SEM images of the calcium phosphate precipitate collected at different
reaction times. (a) 1.5 h; (b) 3 h; (c) 4 h; (d) 12 h.
34
(a)
200 nm
(b)
0 0 2 1 2 0[ 2 1 0 ]
c* of O
CP
Figure 2. (a) TEM images and (b) SAED pattern measured for the 6-h sample. The
SAED pattern was taken from the ellipsoidal region highlighted in (a).
Monetite phase
HAP phase
OCP phase
5
10
15
20
25
30
35
40
45
50
55
60
2
θ
1.5 h
3 h
4 h
5 h
6 h
12 h
XRD
Figure 3. XRD patterns measured for samples obtained at different reaction times.
12
1.5 h
3 h
4 h
5 h
6 h
9 h
12 h
96 h
ppm
P1
P2/P4
P5/P6
P3
10 8
6
4
2
0 -2 -4 -6 -8
Figure 4. 31P MAS spectra measured for our sample series at 10 kHz spinning frequency
and 7.05 Tesla.
Figure 5.31P{1H} HETCOR spectra measured for samples (a) 1.5-h; (b) 3-h; (c) 5-h.
1.0
1.5
2.0
2.5
3.0
3.5
4.0
4.5
5.0
5.5
0.2
0.4
0.6
0.8
1.0
1.2
1.4
1.6
1.8
2.0
P1 P2/P4 P3 P5/P6 CP(ms)
τ
1.0
1.5
2.0
2.5
3.0
3.5
4.0
4.5
5.0
5.5
5
10
15
20
25
30
35
40
45
50
55
60
65
Reaction time (h)
P1 P2/P4 P3 P5/P6H
T
ρ
1
(ms)
(b)
(a)
Figure 6. LG-CP parameters obtained for our sample series: (a) τCP ; (b) T1Hρ
39
0
1
2
3
4
5
6
0.0
2.5
5.0
7.5
10.0
12.5
15.0
17.5
Efficie
n
cy (
%
)
Excitation time (ms)
(b)
31P
31P
Figure 7. (a) 31P DQ correlation spectrum of the 1.5-h sample. The DQ
excitation time was set to 3.2 ms. (b) Fitting of the modulation of the normalized P3-P6 DQ signals (excitation efficiency) as a function of excitation time.
(a)
1
2
3
4
5
0
5
10
15
20
25
P3-P5/P6 P2-P5/P6 P1-P5/P6 P2P3 P1P3A
(Arb
itrary Uni
ts)
Reaction time (h)
Figure 8. Plot of the parameter A extracted for the cross-correlation peaks. The sizes of
the symbols are larger than the error bars.
70
75
80
85
90
50
100
150
200
250
P1-P3 P2-P3 P1-P5/P6 P2-P5/P6A
3-h/ A
5-h(%)
M
2(OCP) / M
2(HAP) (%)
P3-P5/P6Figure 9. Plot of the calculated ratios of the second moments of the OCP and the
matched HAp lattice versus the ratios of the experimental A values measured for the 3-h and 5-h samples. The filled and open symbols denote the calculated data for anti-parallel and parallel alignment of the crystallographic c axes of OCP and HAp, respectively. The solid line denotes perfect agreement.
Phosphate group in HAp
P1
P4
P4
P4
P4
P1
P1
P1
P2
P2
P2
P2
P6
P6
P3
P3
P5
P5
OCP unit cell
HAp unit cell
Hydration layer
Phosphate group in
OCP
Figure 10. Possible movement of P5 and P6 in an OCP crystal to generate HAp
structure is indicated by arrows. The structures are projected down the c axis.
Figure S1.31P{1H} HETCOR spectra measured for samples (a) 6-h; (b) 12-h.
0
2
4
6
8
10
12
A
rbitrary U
n
its
Contact time (ms)
Figure S2. Typical fitting of the raw data of 31P{1H} LG-CP variable contact time experiment.
Figure S3.31P DQ spectra of (a) monetite; (b) 4-h sample.
(b)
(a)
47
II-E.
C-13 Homonuclear Polarization Transfer in Biological Solids without
Proton Decoupling
52
II-F.
Frequency Selective Polarization Transfer Based on Multiple Chemical
Shift Precession
57
II-G.
Attachment of Peptide onto HAp Surface
The peptide fragment of salivary statherin chosen in our study has 15 residues. According to earlier study this fragment is responsible for the interaction of statherin and inorganic phosphate clusters to prevent the precipitation of calcium phosphate in saliva. Experimentally we employed solid-state peptide synthesizer (Rainin Instrument Company) to prepare our target peptide. Standard Fmoc chemistry was used to attach residues sequentially to preloaded resin. The deprotection procedure was done by 20% (v/v) piperidine in DMF and the activation reagent was PyBop. The solution 95% TFA, 2.5% TIS and 2.5% H2O was prepared for peptide cleavage. After
precipitating the cleavage product in cold MTBE, the crude material was obtained by centrifuge. Peptide purification was done by HPLC (Beckman Coulter System Gold) using a Vydac C18 reverse-phase column (218TP1022) at 50°C. As shown in the following figure, the solvent gradient (Solution A: 5% ACN in water; Solution B: 95% ACN in water) was shown as line segments:
The sample collected at 32 to 34 mins was lyophilized and characterized by ESI-MS. According to the deconvolution of the MS spectrum done by BIOMASS, the purity of the target peptide is higher than 90%.
58
A mixture of 20 mg purified peptide and 50 mg hydroxyapatite in 5 ml phosphate buffer was prepared and shaken vigorously for 5 minutes. The mixture was then incubated in an orbital
59
shaker (150 rpm) at 37°C. The sample and the supernatant were collected by centrifuge. After lyophilization and further washing, the solid UV spectra were measured. The peaks at 220 nm and 260 nm were adsorption bands due to peptide bonds and phenyl rings, respectively. Although the results are not conclusive, the weak adsorptions at 220 nm and 260 nm of the sample shows that it is a mixture of hydroxyapatite (HAp) and our target peptide (15mer). In addition, the FT-IR spectrum was measured for our sample:
From the FT-IR spectrum one can identify the adsorptions of 1028, 605 and 565 cm-1 to PO4
3-vibrational modes. Those around 1400-1430 cm-1 and 1560-1600 cm-1 can be assigned to the symmetric and asymmetric stretchings of carboxylate group, respectively. The adsorptions around 1485-1550 and 1590-1660 cm-1 are due to the symmetric and asymmetric stretchings of amino group, respectively. Therefore, the FT-IR data indicate that small amount of our target peptide has been attached to our HAp crystals. Ninhydrin test also proved that there are peptides attached to our sample surface. Similar results were obtained when we replace the synthetic HAp crystals by bioactive glasses soaked in simulated body fluid. While we have experimentally illustrated the concept of peptide attachment to bioactive glasses, the peptide amount at the current stage is still too limited to allow a thorough solid-state NMR characterization. Additional works are ongoing to increase the amount of the attached peptides.
60
III. Self Evaluation
In the past two years (Nov 2003 to Sept 2005), we had managed to prepare and characterize the target sol-gel glass systems, which were then soaked in simulated body fluid to induce the formation of HAP. The molecular mechanism of apatite formation on bioactive glass surface is studied using the techniques of XRD, EDX, SEM, FT-IR, and solid-state 31P NMR. Using the sol-gel method a bioactive glass system containing glass beads of 2 to 3 microns in size is prepared with the composition containing 30% CaO – 70% SiO2. Our experimental data support
the apatite formation mechanism proposed by Hench concerning the precipitation and crystallization of calcium phosphate. The phosphate ions initially deposited on the glass surface are largely in amorphous phase and have substantial amount of water molecules in the surrounding. As the soaking time in simulated body fluid increases, some of the water molecules diffuse out of the phosphate lattice, leading to the formation of a crystalline phase. Our data show that the structure of the crystalline phase is different from type B carbonate apatite but similar to hydroxyapatite.
In addition, considerable efforts were made to develop solid-state NMR strategy to study our model compounds, viz. octacalcium phosphate (OCP) and HAp. This part of the works, which is in collaboration with Professor C. Y. Mou, has proven to be very fruitful. The molecular mechanism of OCP to HAp transformation in vitro has been studied by several physical techniques, with particular emphasis on solid-state 31P homonuclear double-quantum (DQ) NMR spectroscopy. Together with computer assisted lattice matching, our NMR data reveal that OCP crystals transform to HAp topotaxially along their c axes with anti-parallel relationship, instead of the parallel relationship as presumed in the literature. Furthermore, the data of the 31P{1H} cross-polarization NMR suggest that water molecules enter the hydration layers of OCP crystals via the hydrolysis reaction HPO42- + OH- = PO43- + H2O, which also accounts for the
deprotonation of the HPO42- ions during the transformation.
We have also made a considerable progress in the development of new solid-state nuclear magnetic resonance (SSNMR) technique for the determination of backbone torsion angle ψ of polypeptides. In particular, we have resolved two important issues. Firstly, we have achieved a good 13C-13C polarization transfer efficiency in a uniformly labeled non-crystalline polypeptide, demonstrating the applicability of our approach to the studies of real biological systems. Secondly, we show that a simultaneous high power 1H decoupling is NOT necessary for J-coupling mediated 13C-13C polarization transfer. We believe that this no-decoupling approach is quite general and can be immediately incorporated into most existing sequences. Altogether, we
61
anticipate that J-coupling mediated polarization transfer can find fruitful applications in many structural problems involving non-crystalline solids and systems with significant dynamics.
Concerning the synthesis of our target peptide, we have initiated a collaboration with Dr. Steve S. F. Yu at the Chemistry Institute of Academia Sinica. The laboratory of Dr. Yu is well-equipped for peptide synthesis. As expected, it is relatively straightforward to prepare and purify our target peptide DpSpSEEKFLRRIGRFG. However, it proves to be very difficult to attach enough amount of the target peptide to HAp crystal surface for solid-state NMR study. The main difficulty is that the zeta-potential of HAp crystal surface is of negatively charged and therefore the conventional protocol of mixing the peptide solution and HAp crystal in buffer solution is not effective. Nevertheless, we have developed a new strategy to enhance the peptide attachment. This work will provide a roadmap for the future development of the idea described in this project.
Overall, this pilot project has proven the applicability of solid-state NMR spectroscopy to the investigation of the molecular mechanism of biomineralization. Although the major objective, characterization of the conformation of peptides attached on bioactive glass surface, has not yet accomplished, we have completed most of our specific aims. Upon the completion of this project, which is the very first NSC funded project of the principal investigator, the results have been resulted in six full papers (five published and one submitted). Additional experiments are still underway to study the glass-peptide interaction. Furthermore, this project has seeded many collaboration works and the NMR methodology developed in this project has provided a very solid foundation to further our study on teeth and bones
62
Appendix
Thanks to the traveling allowance provided in this project, I have attended the following international conference in solid-state NMR spectroscopy:
The 4th Alpine conference on Solid-State NMR, Charmonix, France. September 11-14, 2005
The aim of the conference is to provide an international forum for high-level discussions to physicists, chemists, biologists and the other scientists with both an academic or industrial background, interested in the latest developments in solid-state NMR. The meeting focuses on the state of the art and theoretical and methodological developments, as well as on recent applications of solid-state NMR in fields as diverse as: organic and inorganic chemistry, catalysis, structural biology, materials science and polymer science.
Although I was not an invited speaker of the conference but I was encouraged by the organizer to give an oral presentation of my work. The “invitation” email is reproduced below:
Dear Jerry,
I am sending you this on behalf of the scientific committee for the 2005 Alpine solid-state NMR conference (http://www.alpine-conference.org/).
We hope very much that you can attend the conference and will shortly register and submit an abstract before the deadline (May 31). On the basis of the work we know about we expect to offer you a contributed talk at the conference.
The organizing committee will send out invitations after all the abstracts have come in.
Please be aware, however, that the conference does not usually pay expenses for contributing speakers. If you are eligible, you may be able to apply for a student stipend (details on the web site).
best wishes,
and I hope to see you in Chamonix, malcolm -- ********************************************************** Malcolm Levitt School of Chemistry University of Southampton Southampton SO17 1BJ England. tel. +44 23 8059 6753 fax: +44 23 8059 3781 mobile: +44 77 6652 2964 email: [email protected] website: http://www.mhl.soton.ac.uk *************************************************************