Performance evaluation of a cache-coherent multi-processor
by iterative mean value analysis
Chien-Yuan Huang I, Shi-Chung Chang
*,Chern-Lin Chen
Department of Electrical Engineering, National Taiwan University, Taipei, Taiwan, ROCReceived January 1993; revised November 1993
Abstract
An iterative mean value analysis (MVA) algorithm is developed in this paper for a class of queueing networks (QNs) with forking (MVAF). The algorithmic development is motivated by the performance evaluation of a Multicube multiprocessor system and its cache coherent protocol proposed by Goodman and Woest, 1988. We model the system as a multichain, multiclass, mixed QN with forking phenomena. The MVAF algorithm that we propose approximates a forking by independent flows at each iteration and iteratively applies MVA to the approximate QNs without forking. We prove that MVAF converges to the exact performance measures for the QN with forking. Comparisons among performance evaluations by MVAF, simulation and the mean value performance analysis by Leutennegger and Vernon, 1988, demonstrate both the validity and effectiveness of MVAF.
Keywords: Performance evaluation; Multiprocessor; Cache coherence protocol; Queueing network model; Forking; Mean value analysis; Fixed-point iteration; Simulation
1. Introduction
The design of a high performance multiprocessor system is very complex and requires integration of various hardware and software technologies [ll]. Designer’s intuitions and experiences alone are not sufficient for designing such a complex system. To achieve a high performance/cost ratio system, namely, the competitiveness in the market, mathematical modeling for performance prediction and evaluation has become indispensable in the design process [ 1,121.
* Corresponding author.
’ Currently a Ph.D. candidate of Department of Electrical Engineering, Pennsylvania State University. 0166-5316/95/$09.50 0 1995 Elsevier Science B.V. All rights reserved
32 C.-Y. Huang et al. /Performance Evaluation 23 (1995) 31-52
Mathematical models for computer systems range from relatively simple ones whose solution may be obtained analytically (e.g., product form queueing networks and the Mean Value Analysis), to very complex ones that are not analytically tractable and simulation is usually adopted to evaluate them (e.g., Timed Stochastic Petri Net) [1,12]. These models may each be useful at different stages of design. The former are usually fast in computation and provide insights for the first-cut design while the latter are time consuming but generate results closer to the reality.
In the earlier phases of developing a multiprocessor computer system, timeliness of decisions and a good grasp of key system characteristics are more important than accuracy of decisions to shorten the design cycle and to achieve the success of a design. For this purpose, what design engineers need are rapid modeling and performance prediction/evaluation tools that provide timely evaluations and help narrow down options for the later design phases. Such needs have therefore posed challenges to the development of advanced modeling, analysis and perfor- mance evaluation methodologies for designing a large-scale and complex multiprocessor computer system.
There have been many results in the literature on performance evaluation of multiprocessor systems with cache coherence protocols. Archibald and Baer presented a simulation model to compare various decentralized protocols [3]. A generalized Petri net technique was adopted in [lo]. The computational complexity of the technique, however, makes it unsuitable for the application to large-scale systems. There are many analytical queueing network models and their corresponding approximate mean value analysis (MVA) proposed [8,12,13] for evaluating cache coherence protocols for a global-bus multiprocessor system [20].
Vernon et al. [14,19] developed a Mean Value Performance Analysis (MVPA). Their analysis is founded on system designer’s good understanding of the computer system and their very basic skill on probabilistic modeling. Once a model is constructed, the analysis amounts to solving nonlinear equations in variables of mean performance measures. This approach has been applied to analyzing a Multicube architecture with a cache coherent protocol [8], which is more complex than the global-bus multiprocessor described in [10,20]. Though simple and intuitive, this approach has some disadvantages in effectiveness for performance evaluation due to modelling simplifications.
In this paper, we also adopt the two-dimensional Multicube architecture proposed in [8] as a study system, develop a queueing network-based performance evaluation approach for it, and compare our approach with MVPA. The 2-D Multicube architecture employs a snooping cache system over a grid of buses. It has a cache coherence protocol to maintain data consistency among snooping caches of different processor modules. While providing a view of a single shared memory to the programmer, it imposes no notion of geographical locality. The 2-D Multicube is therefore regarded as a potentially general purpose multiprocessor which supports a wide range of applications.
A mixed queueing network (QN) model is first constructed for this 2-D Multicube system, where processors, buses and shared memories are modeled as servers while data block transactions among processors are modeled as the customers. The snooping cache coherence protocol determines the routing and class changes of customers in the network. In this QN model, there are finite buffers and forking phenomena during data transactions. Among the existing numerical algorithms for queueing network performance evaluation, mean value
analysis (MVA) algorithm is an exact solution technique for the product form queueing networks [12,17]. However, the QN/model of the 2-D Multicube does not have a product form due to (1) finite buffers which may causes blocking and (2) the existence of forking phenomena.
Exploiting problem features, we first assume that the effect of finite buffers to system performance can be neglected. We then develop an iterative MVA algorithm for a QN with forking (MVAF). In each iteration of the MVAF, a forking is approximated by two indepen- dent flows of open class and closed class of customers; the MVA algorithm for multichain, multiclass, mixed QNs is then applied to this approximated QN. The MVAF is essentially a Jacobi type of algorithm for finding the fixed point of the arrival rates of open-class customers in the QN model. We also prove that MVAF is a contraction mapping and converges to a unique solution, which is in commensurate with the results of [15].
The MVAF algorithm is validated by comparing its performance evaluation results with simulation results for the QN models of small scale (2 X 2 and 3 X 3) 2-D Multicube systems. Results from MVAF and simulation are very close, e.g., less than 5% difference in the measure of mean processor utilization. It seems that the larger the system, the smaller the difference. Performance evaluation results by using MVPA on the same sets of problems are similar in general trends but tend to be over optimistic, especially under high workload situations. MVAF is further applied to performance evaluation of large-scale systems and is compared to MVPA. Similar comparison conclusions are obtained except that the magnitude of differences may go up to 40%. Such differences are due to the superior modeling and analysis of our QN and MVA-based approach. The computation times for MVAF and MVPA are about in the same order. Though our approach requires some background on QN, we believe that the techniques developed in this paper are not only effective for performance evaluation of the 2-D Multicube system but also have a good potential for further extensions and applications.
The remainder of this paper is organized as follows. Section 2 briefly describes the architecture and the cache coherence protocol of the 2-D Multicube. Its mixed queueing network model is constructed in Section 3. Section 4 develops the MVAF algorithm with convergence analysis given in Section 5. Section 6 then provides some validations of the MVAF by simulation. Performance analysis of the 2-D Multicube using both MVAF and MVPA are also compared. Conclusions are finally given in Section 7.
2. A 2-D Multicube architecture and protocol
In this section, we briefly summarize, for our modeling and performance evaluation purpose, the architecture of the 2-D Multicube and its cache-coherent protocol proposed by [8]. 2.1. System architecture
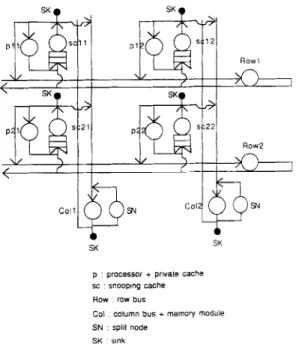
The 2-D Multicube architecture employs a snooping cache system over a grid of buses as shown in Fig. 1. Each processor is connected to a multi-level cache. The first-level cache, referred to as the processor cache, is a high performance cache designed with the traditional goal of minimizing memory latency of data accessing by the processor. A second-level cache, referred to as the snooping cache, is a large cache with a minimum of 64K DRAM designed to
34 C.-Y. Huang et al. /Performance Evaluation 23 (1995) 31-52 Snooping cache t Snooping cache t Snooping cache t
Fig. 1. The Z-D Multicube computer architecture.
minimize bus traffic between the local and shared memories [7]. Consistency between the two cache levels is maintained by using a write-through strategy to assure that the processor cache is always a strict subset of the data in the snooping cache. Every data block in the system has a copy kept by one of the shared memory modules, which is considered its home memory module. The controller of each snooping cache also monitors a row bus and a column bus in order to maintain data consistency among snooping caches and shared memories. The intercon- nection topology may be viewed as a collection of conventional single-bus multiprocessors connected by an orthogonal set of buses which transparently extends the snooping cache protocol to higher dimensions.
2.2. The cache coherence protocol
The 2-D Multicube architecture allows a cache-coherent protocol for which most bus requests can be satisfied with no more than twice the number of bus operations required for a single-bus multiprocessor. There are three states of a data block in a memory according to [8]: modified, shared and invalid.
(1) modified: blocks th a were written by a processor, but have not been read or written by t any other processors,
(2) shared: a cache block that does not exist in any cache in state modified,
(3) invalid: a cache block that has at least one of its copies in the system modified by any other processor.
Note that if
a
block is in state modified, no other caches have such a copy. Each snooping cache controller maintains a modified block table (MBT) that contains addresses of all cache blocks that are in state modified in any one of the caches along the same column as the snooping cache. Main memory contains the current values of all shared cache blocks.A cache miss happens when the data in the snooping cache can not support the processing of the processor in the same module. There are two types of cache misses: a read miss happens when a processor only reads the requested data while a write miss occurs when a processor intends to modify the requested data.
Under the cache-coherent protocol, four types of cache block transactions may be initiated by a snooping cache controller associated with a cache miss: READ, READ-MOD, WRITE-BACK and INVALIDATION, which are described as follows.
READ transactions
Suppose that a controller, say controller A in Fig. 1, issues to its row bus a READ request for a block not in the caches of processor A. If the requested block is in a shared state, a controller located at the intersection of the row bus and the column connecting to the home module of the requested block accepts the request, say controller B in this case. If B has the requested block in its cache, it sends the data to A; else it requests the column bus and passes the request to the home memory (M2). The memory controller of M2 then responds by sending the requested data to the requesting controller if the block is in a valid state. Otherwise, the memory controller takes no actions.
If the requested block is in a modified state, then one controller (e.g., Cl located at the intersection of the requesting row and the column along which a cache keeps the requested block will accept the request after looking into its MBT. Controller C then relays the request to its column bus. All controllers on the column delete the block address from their MBT and the controller of the snooping cache that has the data block (D) fetches the data, changes its state from modified to shared and returns the data to A through the reverse route. Along this returning path to A, a controller on its home column (B) will also pick up a copy of the data block, and send it to the home memory (M2) with its state changed to “shared”.
READ_MOD transactions
A controller, say A, issues a READ-MOD request to its row bus when a write miss occurs. If the requested block is “modified”, the transaction procedure is the same as that for the READ transaction except that the return path is D-E-A. When controller E forwards the block to A in a modified state, all controllers along the same column add the block address to their MBTs.
If the requested block is “shared”, the steps are that after the READ-MOD request is forwarded to it home memory (A-B-M2), M2 returns the requested data through its column bus and an appropriate row bus to A, and initiates an invalidation transaction concurrently to ensure that other copies of the block in the system are purged. After the reception at the requesting controller, a column bus operation is performed (by controller A) to update each MBT along the same column with the address of the newly acquired data block.
WRITE -BACK transactions
A WRITE-BACK transaction occurs during the returning procedure of a READ transac- tion for a modified data block. When the required data block is transmitting on the row bus of
36 C.-Y. Huang et al. /Performance Evaluation 23 (1995) 31-52
the requesting controller, the controller at the intersection of the block’s home column and the row will also pick up the data, and relay it to its home memory. The data block is then written back to the memory and changed to a “shared” state.
INVALIDATION transactions
An invalidation request is sent along with the requested data block in its returning path for a READ-MOD transaction of a “shared” data block. The invalidation request is broadcasted to all controllers by controllers along the returning path so that other copies of the data are purged.
3. A queueing network simulation model
To evaluate the performance of the 2-D multicube architecture and its protocol, a queueing network-based simulation environment is first established. A queueing network consists of different classes of customers, servers, buffers, interconnection of servers/buffers and service discipline at each server. In modeling the 2-D multicube system, servers correspond to hardware resources, buffers correspond to memory storages and customers correspond to data block transactions.
Now consider a processor module, where the processor and its first-level cache are busy with processing except when a cache miss occurs at the processor module. In that occasion, the processor generates a request for data block transaction which goes through the snooping cache controller to the interconnection bus. As uniprogramming is assumed at each processor, the processor then holds until the requested data is acquired. So we model the processor and the first-level cache as a processor server with no buffer, where the departure of a customer corresponds to the generation of a cache miss request and the server stays idle until the customer returns. The snooping cache and controller of the processor module not only handle transactions from and to their corresponding processor module but also relay transactions among other processor modules through buses. We therefore model the controller as a
snooping cache server and the cache as an infinite buffer associated with it since the snooping cache is relatively large.
A data block transaction may involve the access of a few row and column buses. If a bus is being accessed by a transaction and there is another transaction requesting the bus at the same time, the requesting transaction waits in its current snooping cache server (i.e., it is blocked) until the bus is free. When a transaction accesses a main memory module through its home column bus, it ties up both the memory module and the bus. We therefore model a column bus and its associated memory module into a coZumn bus server and model a row bus as a row bus server, where all bus servers are of no buffer spaces.
Data transaction requests due to cache misses at a processor are modeled as closed-class customers in our QN model. This is based on the fact that a processor server generates one transaction request at a time and holds until the request is fulfilled to resume its processing. As there are four types of transactions and there are also various routing requirements among transactions, we further define classes of customers and the interconnection among servers according to the cache coherence protocol.
i SK
Fig. 2. The mixed queueing network model.
The class of a customer may be changed upon its departure from a server when there are alternative routes, with the lzew class Label specifying the next server to visit and the service type to receive. A customer may split into a number of new customers after certain type of services, for instance, the broadcasting of invalidation signals due to READ-MOD transactions, write-back operations due to READ transactions, etc. A split function is built into the corresponding servers. As the customers originated from invalidation and write-back transac- tions do not go back to their generation server, sink nodes are created to absorb them after the completion of their required services. Such customers are naturally modeled as open-class customers and the model for the 2-D Multicube is therefore a mixed queueing network which consists of multiple closed classes of customers and open classes of customers as shown in Fig. 2.
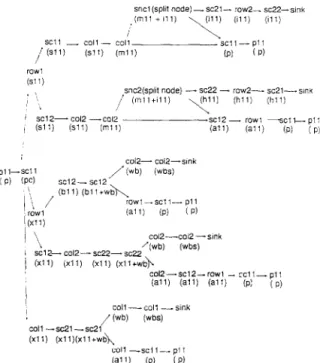
Figure 3 gives an example illustrating the various paths of a customer generated by a processor module in a 2-D Multicube system. Assume that a program (or a task) is being executed in processor pll and is modeled as a closed-class customer p. When there happens a cache miss, the customer -goes to sell snooping controller server and changes class from p to pc. Because we use the probabilistic workload model, each alternative routing is associated with a probabilistic distribution. If this cache miss requests a shared block, it broadcasts the requested cache block address on the row1 bus and becomes a class sll customer. Suppose that the snooping cache controller sc12 detects the request and forwards it to one of the memory modules along co12 bus to access the data. The customer class changes from sll to ml1 during memory accessing. After accessing, the customer is probabilistically routed to two possible routes: one for a READ only request and one for a READ _MOD request. For the latter, the invalidation customers are spawned to do the invalidations in sc21 and sc22 and go to the sink
38 C.-Y. Huang et al. /Performance Evaluation 23 (1995) 31-52 sncl(spM node)-sc21- rowl- x22--s,nk ,(mll +~ll) (111) SC1 ,- Pli (PI ( P) ‘, )
,snd(spllt node) -x22 - rowZ- x21--sink ! (m”+“i) yl’ (hll) (hll) 1 sc12- co12 --co12
/ WI) (Sli) (ml,) x12- (all) low, -c,k.p,: (all) (P) I PI
coi2- coi2--s,nk PII--SC11 (Pi (PC) / Wb) (wbs) 1:: i ;b”: :,,::1’,&, row, - SC1 1- PI 1 I ;z; @ifI (PI ( P) ‘\ ‘x,2---COI2---Sl”k “Wb) Wbs) / SClZ- x12- x22- SC72 j (Xl?) Cdl) (x11) (xll+wb\ c012-sc12-r0w1 - xlI_pll @‘I) (al’) (all) (P: ( P)
COll- co,, - 51”k cot1 -scu-SC21 ,’ Wb) Wbs) (x11) (xli)(xll+wb~ COll -SC, I- p11 (aJ1) (P) i P)
Fig. 3. Example of paths for a customer generated by a processor module.
after the invalidation; the requested block is returned to processor pll following the reverse path direction of the request. Other cumbersome details in constructing Fig. 3 are omitted.
4. Mean value analysis
As there exist (1) finite buffers and (2) forking phenomena, the QN model developed in Section 3 is not a product form QN. Existing mean value analysis (MVA) algorithms [12,17] cannot be directly applied to it for a quick performance evaluation. Approximate MVA algorithms for queueing networks with finite buffers, are limited to single-chain queueing networks [2,6]. Since the snooping cache of each processor module is assumed to be quite large, we expect only low to medium bus load due to cache miss. It in turn implies that there may be only minor blocking caused by bus and memory contentions at processor and snooping cache servers. We therefore neglect the blocking effect and approximate the QN by one with infinite buffers.
The difficulty remains to be overcome is then the forking phenomena. Observe that some open-class customers and a closed-class customer are generated after each forking in the QN, that all the open classes are generated by forking and that the generation rate of an open class depends on the throughput of its associated closed-class customer at the forking server. Such observations suggest a variations of the QN model where each open class of customers is generated by an external source node (rather than from forking) in an average rate equal to the
forking server’s throughput. This variation facilitates the development of an iterative MVA algorithm for the QN model with forking.
The idea is that by first assuming independence between the open-class sources and the throughput of the closed-class at a forking server, open-class customers and closed-class customers in the approximate QN are decoupled. Under the exponential distribution assump- tion, the approximate QN then becomes a multi-chain, multi-class, product-form mixed QN. Given a set of open-class arrival rates, we can easily extend the existing MVA algorithms to it and compute the throughputs of closed-class customers at all forking servers. The mean arrival rates of open-class customers are then updated by the average throughputs of their associated closed classes respectively. This procedure iterates until the average rates of open-class arrivals converge.
To formalize the development of the MVA algorithm for the forking QN model (MVAF), let us first define some notations.
Notations:
4
J KN,
Nnr
n ‘r,j, k ‘rjk > > * ‘rjk L:,;,k Q jTX,
C. 0Ls
%
er
6= number of chains in the QN,
= number of service centers in the QN, = number of customer classes in the QN,
= maximum population of chain r, r = 1,.
.
.
,
R,,
=W,, N,,...,N,J
=
population index of chain r, r = 1,. . . ,R,,
= h,,
n,,...JQ,
=
mean number of visits to server j by a class-k customer of chain r, = mean service time of a class-k, chain-r customer at server j,= inflated mean service time of a closed, class-k, chain-r customer at server j, = mean response time of a class-k chain-r customer at server j,
= arrival rate of an open class-k chainr customer at server j,
= dummy arrival rate of an open class-k chain-r customer at server j, = mean queue size of server j,
= total throughput of chain Y, = the set of closed-class customers, = the set of open-class customers, = mean utilization of server j,
= mean utilization of open class customers at server j,
= a unit vector of dimension
R,
with the rth element being 1, = a convergence threshold.As a mixed product form QN is evaluated in each iteration, we extend the existing MVA algorithm for mixed QN [12] to our multi-chain and multi-class case. It is quite intuitive that the mean utilization of a server by open-class customers is
q,O =
5
c
'r,j,kx
'r,j,kx
'r,j,k forj=l,...,J. (4.1)40 C.-Y. Huang et al. /Performance Evaluation 23 (1995) 31-52
The mean capacity of a server left for processing closed-class customers is 1 - q,O. So, the closed-class customers are equivalently going through a closed QN with an inflated mean service time
c ‘r,j,k ‘r,j,k =
1 - q,o
for r= 1 ,..., R,, j=l,..., Jand kEC. (4.2)
The mixed QN problem is now reduced to a closed QN problem.
Three key equations constitute the backbone of MVA for a closed QN, which relate among performance measures such as mean queue length, mean response time and throughput of each server.
R,,j,k(n)=T,,j,kX[l+Qj(~-e,)] for r=l,..., R,, j=l,..., J, kEC, P-3)
Txr
=
c
c'r,j,*"; Rr,j,k(n)’
j
k(44
Q,(n) =
C ?
Txr
’
‘r,j,k ’ Rr,j,k* k=C r=l (4.5) Equation (4.3) is obtained from the arrival instant distribution theorem [18] and Eqs. (4.4) and (4.5) are based on Little’s Law of queueing theory.Since the arrival rates of open-class customers should actually be equal to the throughputs of their respectively associated closed-class customers at the forking servers, the open-class arrival rates are updated for the next iteration by
h,jk=TX,Xv,j,k > 3 for r=l,..., R,, j=l,..., J,and kE0.
The complete iterative algorithm is summarized as follows.
(4.6) MVAJT algorithm Step 1. Step 2. MAIN for nR . . .
Initialize the mean queue length of servers Qj<O> = 0, for j = 1,. . . , J;
Loop over number of customers LOOPS = 0 ,***, NRC9 or II, = O,.. ., N,; step 3. Step 4. Step 5. Step 6. Step 7.
Initialize arrival rates of open-class customers hr,j,k = 0, for r = 1,. . . , R,, j = 1,. . . , J, and k E 0.
Calculate the inflated mean service time of closed-class customers according to Eqs. (4.1) and (4.2)
Calculate mean response times of closed-class customers by using Eq. (4.3) Calculate the mean throughput of each chain according to Eq. (4.4)
Store the newly calculated open-class arrival rates
Step 8. Check the convergence
If I Lr,j,k - hr,j,k I < 6, for r = 1,. . . , R,, j = 1,. . . , J, and k E 0, then the algo- rithm converges for population distribution n, go to Step 10.
Step 9. Update arrival rates of open-class customers
Ar,j,k = Lr,j,k, for r = 1,. . . , R,, j = 1,. . . , J, and k E 0.
Go to Step 4.
Step 10. Compute the queue length of each server
Qj<n> = Ck E cc:: ,Txr X vr,j,k X Rr,j,k> for j = I,. . . , J.
End of MAIN LOOPS.
Step 11. Calculate server utilizations
u;. = &&TX, x vr,j,k x 7,,j,k, for j = 1,. . . , J. Step 12. OUTPUT and STOP.
Remark. The computational complexity of each iteration from Step 4 to Step 9 is dominated by
R, X J X K. Since the number of chains, the number of server nodes and the number of classes all grow proportionally to the number of processors in the system, i.e., N2, O(N6> is a simple estimate of upper bound to the computational complexity of Steps 4-9.
5. Convergence analysis
The MVAF algorithm developed in the previous section is essentially a Jacobi type of fixed point iteration algorithm. Let mapping Ai represent the algorithm of step i, i = 4,. . . ,9 in the MVAF algorithm and define
A=A,~A,~A,~A,~A,~A,, (5.1)
where Ai+,oAi(.)~Aj+l(Ai(.)) for i=4,.. .,8. The iterative procedure of MVAF under a given population distribution n of closed-class customers can be abstracted as
A’+‘=A(A’), i=O, 1, 2 ,..., with h”=O, (5.2)
where A is a vector consisting of all the open-class arrival rates Ar,j,k, for r = 1,. . . , R,., j= 1,. . . , J, and k E 0.
This section shows that MVAF converges to a unique fixed point by proving that A of (5.1) is a contraction mapping [4].
Definition. A mapping A: [w” -+ Iw” is monotonically decreasing if A(w) <A(u) for any pair of u, w E R” with u < W.
A sufficient condition for a continuously differentiable mapping to be monotonically decreas- ing is given in Lemma 1.
Lemma I. Let [a, ~]ER, a<b, D=[a, bin, xiEDfori=l ,..., n, andX=[x, ,...,
~~1. Aho
let
fi:D + [a, b] for i = 1,. . . , n, fi E C1 and a mapping A:D + D, where A(X) = [f&X), . . . , f,(X)]. If dfi(X)/dx, < 0 for 1 I i, j I n and VX E D, then A is monotonically decreasing.42 C.-Y. Huang et al. /Performance Evaluation 23 (1995) 31-52 The proof of Lemma 1 is described in the Appendix.
The following theorem then gives a set of conditions under which a continuous and monotonically decreasing mapping is a contraction mapping with a unique fixed point.
Theorem 1. Let D c R" be a closed set. A mapping A: D --) D is monotonically decreasing and continuous. Suppose A(O) =z and O<A(z) <z. Let H={x]O<x<z} CD, and xi+’ =A(x’) with x0 = 0, i = 0,. . . ,m. Then A is a contraction mapping and the sequence {xi} converges to a unique x * E H.
Interested readers may refer to the Appendix for the details of the proof. Finally, Theorem 2 concludes the convergence of algorithm A.
Theorem 2 (Convergence of the MVAF algorithm). Algorithm A as defined in (5.1) for one iteration of WAF under a given closed-class population distribution n is a continuously differen- tiable contraction mapping that Ai+’ =A(A?, i = 0, 1, 2,. . . , It,. . . , with ho = 0, converges to a unique fixed point h* E [O,A,,], where h,, is the vector of maximum arrival rates of open-class customers.
Proof. The mapping A = A, 0 A, 0 A, 0 A, 0 A, 0 A, is continuously differentiable due to the facts that Aj E C’, j = 4,. . . , 9 and that a composite mapping of mappings in C’ is also in C’. Let Ai,,j,k be a component of A’. Then
dAi+l d Ai;j;k
-= dAi
I dAir,,i’,k,
1
’where r, r’ E (1,. . . , I?,], j, j’ E 11,. . . , J}, k, k’ E 0. By chain rule, we have
dA, dA, dA, dA, dA, dA,
----
=dA,XdA,XdA,XdA,XdA,X dAir,,jt,k,
=
- ‘r,j,kO X X
[l +
Qj(n-
e,>]
Xrr
j kx 7r’j’ k0 ;; - q,;;2<O, for kOE0 and kEC.
So, A is monotonically decreasing in [0, A,,] according to Lemma 1.
Now let A0 = 0 (no open-class customers arriving) and A1 =A,, =A(O). Note that upper bounds for throughputs of closed-class customers at each server under a given population distribution n can be obtained by assuming no open-class customers in the queueing network, which in turn yields upper bounds for A since open-class customer arrival rates should actually be equal to their associated closed-class customer throughputs. Let H = [0, Amax]. As A’ =A,_,
A is monotonically decreasing in [0, A,,], and A2 =A(h) <A,, =A’, it is clear that A satisfies all the conditions in Theorem 1, is a contraction mapping and (A’) converges to a unique fixed point A* EH. q
6. Performance evaluation 6.1. Validation of WAF
To validate the MVAF algorithm for performance evaluation of the QN model developed in Section 3, a simulation environment is developed for the QN model using the Q’ [16] simulation package. In the simulation environment, an N X N system is assumed where a modified data block requested by one processor due to a cache miss is possessed by one of the other (N2 - 1) processors with a uniform probability distribution and so is a shared block by one of the N main memory modules. It is also assumed that row bus and column bus speeds are equal, the time unit is one bus cycle, and bus access times are deterministic depending on whether the access is an address request or a cache block transfer. Although the bus access time of a cache block is determined by both the block size and bus bandwidth, these two parameters are reduced to a single parameter, the cache block transfer time in our model.
Key input parameters of our simulation model are listed as follows:
t, = mean processing time at a processor,
ps (p,) = probability that a cache miss request is for a shared (modified) data block,
P read_mod (Pread) = probability that the cache miss is a write (read) brequest,
tA,r (tA,J = time for transmitting the block address on a row (column) bus,
t,,, (to ,> = time for transmitting the data on a row (column) bus,
t WB,c =‘time for transmitting a data block to the main memory module through a column bus,
= time for transmitting an invalidation signal on a row bus, 2;,, = main memory latency,
d cache = cache memory latency,
N = number of processors per row (or column).
Baseline parameter values used in our simulation are tA,r = t,,, = 2 cycles, t,,, = 1 cycle, tD,, = tD,c = the number of cycles of the quoted cache block size, t,,,, = tD,c, and dcache = d,,,
= 15 bus cycles. Given a cache miss rate, a memory reference frequency and a bus cycle time, the average processing time of a processor server t, can then be calculated as
t, = l/(bus cycle time x memory reference frequency x cache miss rate). (6.1) Mean processor and bus utilizations are the performance measures considered, since the design of a parallel computer is desirable to fully exploit the power of its processors. It is assumed that each processor is constantly busy processing tasks except when waiting for data due to memory latency or communication. The mean processor utilization UP is defined as
UP = mean processing time
44 C.-Y. Huang et al. /Performance Evaluation 23 (1995) 31-52
‘p ( * : simulation x : MVPA o : MVAF )
.s 0.35 4 0.3 5 1
In5
2 n.2- 8 0.15 “.I ttp ( * : simulation x : MVPA o : MVAF )
1
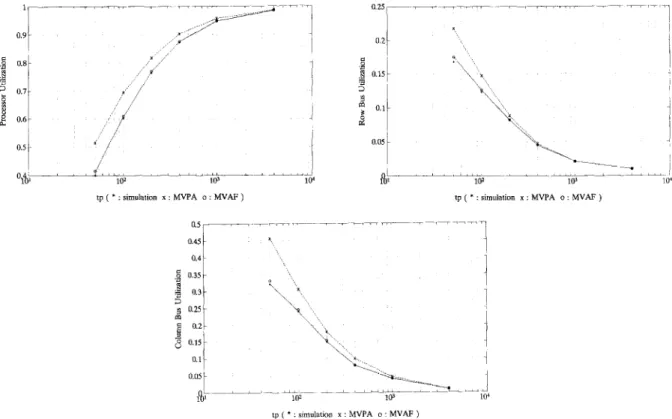
Fig. 4. (a) Mean processor utilization versus mean processing time; (b) Row bus utilization versus mean processing time; (c) Column bus utilization versus mean processing time for N = 2 and cache block size = 16 under even load distribution.
Similarly the bus utilization can be defined as u, =
mean data transmission time
mean data transmission time + mean bus holding time where b is a bus index and a bus is held during a memory access.
The validation is performed on a 2 x 2 and a 3 X 3 2-D Multicube system models with the baseline parameters. Both the Q’ simulation and the MVAF algorithm are run on a SUN/Spare-IPC workstation. It takes in average 2-3 hours of CPU time for one simulation run and less than 0.1 s for getting a MVAF solution.
61.1. Homogeneous workload scenario
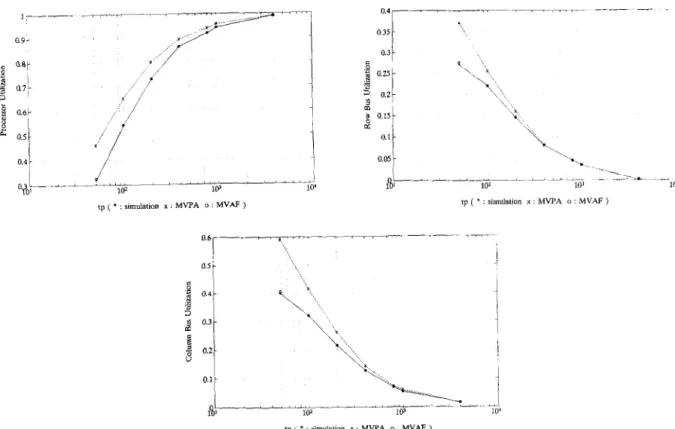
In this scenario, routing probabilities and the mean processing time distributions are the same among processor modules. Figures 4(a)-(c) give the processor utilization, row and column bus utilization versus the mean processing time t, in a 2 X 2 Multicube respectively. The variation of t, reflects the variation of bus communication load; the shorter the t,, the higher the load. Figures 5(a)-(c) are for a 3 X 3 Multicube. Very good agreement between the MVAF and simulation results are observed from all these figures, where the maximum relative difference that happens in the high load range (short tp> is less than 5% for the 2 X 2 case, and
tp ( * : simulation x : MVPA o : MVAF 1
tp ( * : simulation x : MVPA D MVAF )
Fig. 5. (a) Mean processor utilization versus mean processing time; (b) Row bus utilization versus mean processing time; (c) Column bus utilization versus mean processing time for N = 3 and cache block size = 64 under even load distribution.
there is almost no difference between the two for the 3 X 3 case. Intuitively, blocking occurs more significantly at short tp, i.e., high communication load. We therefore conjecture that the minor overestimate of utilization at the high load range is caused by the infinite buffer (or non-blocking) assumption of MVAF.
Performance measures obtained by using the Mean Value Performance Analysis (MVPA) algorithm of [19] are also plotted in Figs. 4 and 5. It is obvious that the MVPA overestimates the utilizations; the shorter the t,, the higher the overestimation; the overestimation is more severe in the 3 X 3 case than in the 2 X 2 case. The cause of such difference will be discussed in the next subsection.
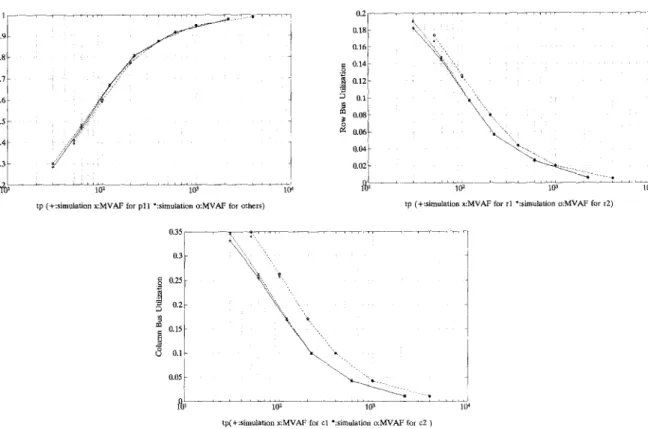
6.1.2. Heterogeneous workload scenario
Inter-cache miss time tp for processor pll in the 2 X 2 2-D multicube system is set 40%
shorter than that of the other three processors, i.e., pll has a higher cache miss rate. Figures @a)-(c) again demonstrate excellent agreements between results of the MVAF algorithm and the simulation. The minor differences also occur at the high load range as in (a). The MVPA
C.-Y. Huang et al. / Performance Evaluation 23 (1995) 31-52
IO;-- ---S l(r
tp (+:simulation x:iUVAF for pll ':simulation a:MVAF for others)
0.3 g 0.25
I
kj
0.J
my
B 0.15 8 0.1 t 0.16 I 0.14 g 0.12 5 0.1 1 D 0.08 B 0.06 Itp (+:simulation x:MVAF for rl ':simulation o:MVAF for r2)
Fig. 6. (a) Mean processor utilization versus mean processing time; (b) Row bus utilization versus mean processing time; (c) Column bus utilization versus mean processing time for N = 2 and cache block size = 16 under uneven load distribution.
algorithm cannot be applied to cases of heterogeneous load and is therefore not compared with.
Simulations of larger scale systems would provide further validations of the MVAF algo- rithm. However, the construction of routing path and transaction paths and simulating a large-scale system are very time consuming. As we have shown the method of doing so and the excellent validation results for small-scale systems, we claim that the validity of the MVAF algorithm for evaluating the performance of the QN model of a 2-D Multicube system has been preliminary justified.
6.2. Performance evaluation by WAF
The MVAF algorithm is now applied to evaluate the performance of large-scale 2-D Multicube system. The same set of problems as those of [14] are studied, with parameter values adopted in Subsection 6.1 as the baseline parameters. Study issues include the effect of system scale, cache miss rate and cache block size on processor and bus utilizations. Results are then compared with those obtained by the MVPA algorithm in [14].
0.9
0.8
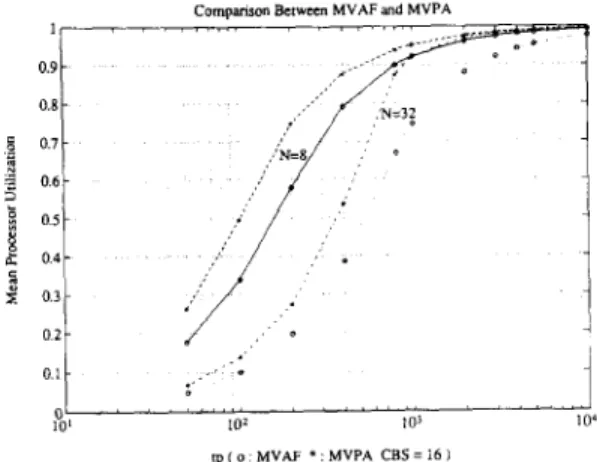
Fig. 7. Mean processor utilization for cache block size = 16.
6.2. I. Processor utilization
Figures 7 and 8 illustrate how the mean processor utilization is varied with respect to system size (N) for the cases of data block size 16 and 64 respectively. Mean processor utilization decreases as N increases because for the 2-D Multicube architecture, the number of buses increases linearly with N while the number of processor modules and the total system workload increase quadratically. The load per processor under which an 8 X 8 Multicube can sustain a utilization over 90% is about two times of that for a 32 X 32 system and utilization degradation due to scale increase turns out to be graceful. Such an observation holds for both MVAF and MVPA results. Although MVAF and MVPA show similar trends in their results, MVPA generates much more optimistic utilizations that does MVAF (may be up to 30% difference). The difference reduces as data block size grows larger.
Figure 9 shows that a smaller block size gives a more graceful degradation in mean processor utilization. Note that in the one hand, the larger the cache block size, the more communication
tp( a:M”AF l :t”lw* cElS=64)
48 C.-Y. Huang et al. /Performance Evaluation 23 (199.5) 31-52
OIL
PO' IO' IO' 104
'p proccsslng me c fori-4 = 32 j
The effect of block size for a 32 x 32 2-D Multicube.
time needed in one transmission and the higher probabilities of bus contention for a given cache miss rate; on the other hand, due to the property of the locality of reference [ll], the cache miss rate may increase if the block size is smaller. There is therefore a trade-off to determine the optimal block size for the system. Comparing the processor utilization curves of the same system size in Figs. 7 and 8, we also observe that the trend of degradation predicted by MVPA is more sensitive to the block size than that predicted by MVAF.
6.2.2.
Bus
utilizationsBus utilizations with respect to different performance factors are expected to have a reverse trend as compared to that of processor utilization because the utilization of buses intuitively implies the idleness of some processors. Figures 10(a)-(d) indeed confirm this expectation. In a 2-D Multicube system with a homogeneous workload, the cache coherent protocol basically distribute the bandwidth demands equally to row and column buses with the exceptions of invalidation and write back transactions. The amount of invalidation traffic on the row buses versus write-back traffic on the column buses determines which type of buses is more heavily utilized.
Figures 10(a)-(d) give the row and column bus utilizations for systems with block sizes of 16 and 64, respectively. Figures 10(a) and (b) show that for a cache block size of 16, the row bus is much more utilized than the column bus when cache miss rate is above one per 1000 cycles. Figure 10(c) and (d) show that for a block size of 64, the column bus is now more heavily utilized than the row bus. This phenomenon can be explained by the fact that although an invalidation request generates concurrent traffic to all row buses, it requires a shorter time on each row bus than transmitting a data block on a column bus (i.e., t,, < tws,,). When the block size is large enough, the utilization of one column bus due to a write-back request becomes higher than the total row bus utilization caused by an invalidation signal.
Both MVAF and MVPA results reflect the above features, but there are significant differences (up to 40% in Fig. 10(b)) of predicted utilizations in the high load range. Such differences are mainly due to the difference in modeling. In MVPA, a bus is not concurrently held when accessing a memory or a cache module and may serve other requests. In MVAF, a
$1 IV 10) 10"
rpp(0~M"AF f MVPACBS=64~ cp(0 MYAF - MVPA CBS=641
Fig. 10. (a) Row bus utilization for cache block size = 16; (b) Column bus utilization for cache block size = 16; (c)
Row bus utilization for cache block size = 64; (d) Column bus utilization for cache block size = 64.
bus is tied up (but considered idle) till the completion of a memory or a cache access. The former therefore has a higher utilization than the latter, especially in the high load range.
7. Conclusions
In this paper we conducted the performance evaluation of a 2-D Multicube, cache coherent multiprocessor architecture. A multiclass, multichain queueing network (QN) model was first constructed for the multiprocessor, which had salient features of blocking and forking. Simula- tion results showed that the blocking effect was relatively minor and was neglected in our later study. To handle a QN with forking phenomena, we developed an iterative mean value analysis algorithm (MVAF), which first approximates a forking by the generation of an open-class customer and a closed-class customer and the Mean Value Analysis (MVA) is applied to the resultant mixed QN. The MVAF then iteratively applies both the approximation and the MVA till convergence. We proved that the MVAF is a contraction mapping and converges to the solution of the original QN with forking. Comparing the performance evaluation results by
50 C.-Y. Huang et al. /Performance Evaluation 23 (1995) 31-52
MVAF for small-scale multicube multiprocessors to those by simulation, we observed less than 5% of differences in average processor and bus utilizations and the larger the system, the smaller the differences. We also compared MVAF with the mean value performance analysis (MVPA) on large-scale 2-D Multicube systems. Results indicated that the two approaches required the same order of computation times, generated performance measures of similar trends, but the difference in magnitude went up to 40%. Though our approach required some knowledge about QN as compared to MVPA, we believe that it is not only superior for evaluating the 2-D Multicube multiprocessor, but also has a good potential for further extensions and applications.
Acknowledgement
This work was supported in part by the National Science Council of Republic of China under Grant NSC-80-0404-E-002-12 and by the Electronics Research & Service Organization of Industrial Technology Research Institute.
Appendix
Proof of Lemma 1. Define 6xi = [0, . . . , axi,. . . ,O] and SX = [6x,, . . . , 6.~~1, where 6xi > 0 for i=l , . . . , n. Since af,(X)/ax, < 0 for all X E D,
fj(X+ 6x,) <fj(X) for all X+6xi and XED, (AJ)
which implies that all the fis are monotonically decreasing in each coordinate. Let X0 =X and X, =X + C~=iSxj E D, for k = 1,. . . , n. As a result of (A.l),
fj(Xk)>fj(Xk+l) for k=O,...,n-1, i.e.,
fj(X) >fi(X+ 8X) f or any 6X> 0 such that X+ SXED. So, fj< X> is monotonically ‘decreasing, vj.
It then easily follows that
tfdn-
7
fn<X>]
> [f#+
q, * - .Y
fnW+
SW1
orA(X)>A(X+aX) for all aX>Oand X+~XED, So A(X) is monotonically decreasing in D. q
Proof of Theorem 1. We need only show that the mapping
H, i.e.,
I( A(#+’ ) -A(x’) II < II x’+l -xi 11, i r 0.
A strictly contracts in the closed set (A-2)
The existence and uniqueness of the fixed point then follows from Proposition 1.1 of [4, pp. 182-1831. We now show that (A.21 holds by mathematical induction:
(1) i=o. s in c e x0 = 0 E H, x1 =t E H, 0 <A(z) <z and x2 =A(z) E H by assumption,
IIA(x’)-A(x0)lI =
IIA(z)-zll
< Ilz-011 =
()x1-x011.
(2) i = 1. As 0 = ’ x < x2 <x1 and A is monotonically decreasing, A(.$) =x2 <A(X2) =x3 <A(xO) =x1 =z,
So, x3 E H and ]I &x2> -A(x’) (1 = II x3 -x2 II < II x2 -x1
II.
(3) Assume that (A.2) holds for 1 I i I n,O<X’-~IX’<X’-~<Z if i isodd, 0 <x’-~ In’<?-l <z if i is even.
(4) i = n + 1. From (A.3) and the monotonically decreasing property of A,
0 <A(x”-~) =Y-l <A(x”) =xn+’ <A(x”-‘) =x” <z if it is odd, 0 <A(n”-l) = xn <A(x”) =xnil <A(x”-~) =xnpl <z if II is even, i.e.,
0 <x(n+l)-l <y+1 <x(n+w2 <z if it + 1 is odd,
0 <X(n+1)-2 <X”+l <x(n+l)-r <z if n+l iseven. For both (A.4a) and (A.4b), we have x”+l E H and
)I A(x”) 74(x”-‘) ]I = ]I X”+l -xXn (I < II x” -xn-I
II.
(fw
(A.4a) (A.4b)
By mathematical induction, we conclude from (1) through (4), that (A.2) holds for all k 2 1, strictly contradicts on H and has a unique fixed point.
References
[l] M. Ajmone Marsan, G. Balbo and G. Conte, Performance Models of Multiprocessor Systems, MIT Press, Cambridge, Mass. (1986).
[2] I.F. Akyildiz, Mean value analysis for blocking queueing networks, IEEE Trans. Softw. Eng. 14 (4) (1988) 418-427.
[3] J. Archibald and J.L. Baer, Cache coherence protocols: evaluation using a multiprocessor simulation model, ACM Trans. Comput. Systems 4 (1986).
[4] D.P. Bertsekas and J.N. Tsitsiklis, Parallel and Dzktributed Computation, Prentice-Hall, Englewood Cliffs, N.J. (19891.
[5] K.M. Chandy, J.H. Howard Jr. and D.F. Towsley, Product form and local balance in queueing networks, J. ACM 24 (1977) 250-263.
[6] D.S. Chang and C.S. Tsou, An approximate algorithm for closed queueing networks of flexible manufacturing system, Proc. 1st Znt. Conf on Automation Technology, Taipei, July 1990, pp. 153-164.
[7] J.R. Goodman, Coherency for multiprocessor virtual address caches, Proc. 2nd Znt. Conf on Architectural Support for Programming Language and Operation Systems (ASPLOSZZ), October 1987, pp. 72-81.
[8] J.R. Goodman and P.J. Woest, The Wisconsin multicube: a new large-scale cache coherent multiprocessor, Proc. 15th Znt. Conf Computer Architecture, 1988, pp. 422-431.
52 [91 WI illI WI 1131 [141 WI Ml t171 1181
C.-Y, Huang et al. /Performance Evaluation 23 (1995) 31-52
P. Heidelberg and K.S. Trivedi, Queueing network models for parallel processing with asynchronous tasks, IEEE Trans. Comput. 31 (lll(1982) 1099-1109.
M.A. Holiday and M.K. Vernon, Performance estimates for multiprocessor memory and bus interference, IEEE Trans. Comput. 36 (1987) 76-85.
K. Hwang and F.A. Briggs, Computer Architecture and Parallel Processing, McGraw-Hill, New York (1984). S.S. Lavenberg (Ed.), Computer Performance Modeling Handbook, Academic Press, Orlando, Fla. (1983). E.D. Lazowska et al., Quantitative System Performance - Computer System Analysis Using Queueing Network Models, Prentice-Hall, Englewood Cliffs, N.J. (1984).
S.T. Leutenegger and M.K. Vernon, A mean value performance analysis of a new multiprocessor architecture, Proc. Conf on Measurement and Modeling of Computer Systems, ACM SIGMETRICS May 1988, pp. 167-176. K.R. Pattipati, M.M. Kostreva and J.L. Teele, Approximate mean value analysis algorithms for queueing networks: existence, uniqueness, and convergence results, .I. ACM 37 (3) (1990) 643-673.
The Q+ User’s Manuals, AT & T Bell Labs., Homdel, N.J.
M. Reiser and S.S. Lavenberg, Mean-value analysis of closed multichain queueing networks, J. ACM 27 (1980) 313-322.
K.C. Sevick and I. Mitrani, The distribution of queueing network states at input and output instants, J. ACM 28 (2) (1981) 358-371.
[19] M.K. Vernon, R. Jog and G.S. Sohi, Performance analysis of hierarchical cache-coherent multiprocessor, Perform. Eual. 9 (1989) 287-302.
[20] Q. Yang, L. Bhuyan and B.C. Liu, Analysis and comparison of cache coherence protocols for a packet-switched multiprocessor, IEEE Trans. Comput. 38 (8) (1989) 1143-1153.
Chien-Yuan Huang received the B.S. degree in mechanical engineering in 1989 and the M.S. degree in electrical engineering in 1991 both from National Taiwan University.Since 1993, he has been working towards the Ph.D. degree in the Department at Electrical Engineering at the Pennsylvania State University. His major areas of interest are computer communication networks, parallel systems, and computer vision.
Shi-Chung Chang received his B.S.E.E. degree from National Taiwan University, Taiwan,
Republic of China, in 1979, and his M.S. and Ph.D. degrees in electrical and systems engineering from the University of Connecticut, Storm, in 1983 and 1986 respectively.
From 1979 to 1981 he served as an Ensign in the Chinese Navy, Taiwan. He worked as a technical intern at the Pacific Gas and Electric Co., San Francisco, in the summer of 1985. During 1987, he was a member of the Technical Staff, decision systems section, ALPHATECH, Inc., Burlington, MA. He is currently with the Electrical Engineering Department of National Taiwan University. His research interests include optimization theory and algorithms, opera- tion scheduling and control of large-scale systems, parallel computing, high speed networks and distributed decision making.
Dr. Chang is a member of Eta Kappa Nu and Phi Kappa Phi.
Chern-Lin Chen was born in 1962 in Taipei, Taiwan. He received his B.S. and Ph.D. degrees in Electrical Engineering from the National Taiwan University in 1984 and 1987, respectively. Since then, he has been with the Department of Electrical Engineering at this university.His current research interests lie in the areas of analysis, design and application of power electronics converters and computer applications in power system engineering.