Transport of a liquid water and methanol mixture through carbon
nanotubes under a chemical potential gradient
Jie Zheng and Erin M. Lennon
Department of Chemical Engineering, University of Washington, Seattle, Washington 98195
Heng-Kwong Tsao
Department of Chemical and Materials Engineering, National Central University, Chung-li, Taiwan 320, Republic of China
Yu-Jane Sheng
Department of Chemical Engineering, National Taiwan University, Taipei, Taiwan 106, Republic of China
Shaoyi Jianga兲
Department of Chemical Engineering, University of Washington, Seattle, Washington 98195
共Received 27 January 2005; accepted 22 March 2005; published online 31 May 2005兲
In this work, we report a dual-control-volume grand canonical molecular dynamics simulation study of the transport of a water and methanol mixture under a fixed concentration gradient through nanotubes of various diameters and surface chemistries. Methanol and water are selected as fluid molecules since water represents a strongly polar molecule while methanol is intermediate between nonpolar and strongly polar molecules. Carboxyl acid共–COOH兲 groups are anchored onto the inner wall of a carbon nanotube to alter the hydrophobic surface into a hydrophilic one. Results show that the transport of the mixture through hydrophilic tubes is faster than through hydrophobic nanotubes although the diffusion of the mixture is slower inside hydrophilic than hydrophobic pores due to a hydrogen network. Thus, the transport of the liquid mixture through the nanotubes is controlled by the pore entrance effect for which hydrogen bonding plays an important role. © 2005 American Institute of Physics.关DOI: 10.1063/1.1908619兴
I. INTRODUCTION
Transport of fluids through nanoporous materials is cur-rently a subject of great interest with many applications, such as molecule sieving,1 gas storage,2 molecular detection,3,4 and membrane separation.5,6It is also important to the pro-cesses in biological transmembrane channels,7,8 such as gramicidin A and aquaporin共Ach兲. These biological channels are crucial to the transport of water molecules, ions, and other solutes across cells. These membrane channels vary in pore size and surface hydrophobicity. For example, the pore of the gramicidin A is formed by hydrophilic amino acids with a pore diameter of ⬃4 Å while the pore of the Ach channel is formed by hydrophobic side chains with a pore diameter of ⬃12 Å. At present, little is known about the mechanism of selective ion/water diffusion through these biological pores. The single-walled nanotube共SWNT兲 can be used as a simple model to mimic biological ion channels since it has a uniform pore size and its surface chemistry can be altered. Several experimental studies9–11 show that the interior of nanotubes can be wetted and filled by liquids12,13 whose surface tension is less than about 200 mN/ m, such as water 共⬃72 mN/m兲 and most organic solvents 共⬍72 mN/m兲. Beckstein and co-workers14,15
also found that a closed hydrophobic pore can be switched to an open state for water permeation by introducing the hydrophilic
charac-ter of the pore. However, it is still very challenging to per-form experimental studies of the transport behavior of fluids through and within individual nanotube.
Molecular simulations are well suited to study the trans-port of fluids through nanopores. Allen and co-workers16 found from their molecular dynamics simulations that ion diffusion along the pore axis exhibits a general increase with channel radius in hydrophobic channels, but remains fairly low in hydrophilic channels. Hummer and co-workers17 found that small changes in the nanotube-water interactions 共⬃0.05 kcal/mol兲 can lead to large changes in water behav-ior between empty and filled states. This finding could be related to the gating mechanisms 共close and open states兲 in biological ion channels. Kalra et al.18 performed long MD simulations共⬃180 ns兲 to study the osmotic transport of wa-ter through nanotube membranes. It was concluded that the transport of water molecules was almost frictionless and governed by single-file diffusion mode, resulting from the formation of hydrogen-bond networks in nanotubes. How-ever, none of the previous simulation studies of the transport of liquids through pores were performed under a fixed con-centration gradient. Such a gradient is encountered in bio-logical membrane channels where the fluid on either side of the membrane has a different concentration. It is desirable to understand how the transport of various fluids will be af-fected by pore geometry and surface chemistry under such conditions.
In this work, we study the transport of liquid mixtures
a兲Author to whom correspondence should be addressed.
through hydrophobic SWNTs or hydrophilic SWNTs an-chored by –COOH groups under a fixed concentration gra-dient using dual-control-volume grand canonical molecular dynamics 共DCV-GCMD兲 simulations. The DCV-GCMD simulation technique19–21has been developed to study trans-port diffusion under a fixed concentration gradient. In DCV-GCMD simulations, adsorption/desorption, diffusion, and pore entrance effects can all be taken into account. How-ever, to our knowledge, past DCV-GCMD simulations19–21 dealt exclusively with simple gases or gaseous mixtures through zeolites or other microporous materials. In this work, water and methanol are selected as model fluid mol-ecules because water represents a strongly polar molecule while methanol is intermediate between nonpolar and strongly polar molecules. The interior of a SWNT can be modified by anchoring –COOH groups on the surface, changing the functionality of the carbon surface from hydro-phobic to hydrophilic. In our previous DCV-GCMD simulations,22 we examined the transport of pure water and methanol through both hydrophobic and hydrophilic slit pores with a pore size of 23 Å under a gradient. This work extends the previous one in two aspects:共a兲 hydrophobic and hydrophilic SWNTs of a cylindrical shape with smaller pore sizes are used to increase fluid confinement and 共b兲 fluid mixtures are used to study the competitive transport of dif-ferent fluids through difdif-ferent pores. The goal of this work is to provide a fundamental understanding of how fluid-fluid and fluid-surface interactions will affect the transport of a liquid mixture through a micropore.
II. MODELS AND SIMULATION METHODOLOGY A. Model systems
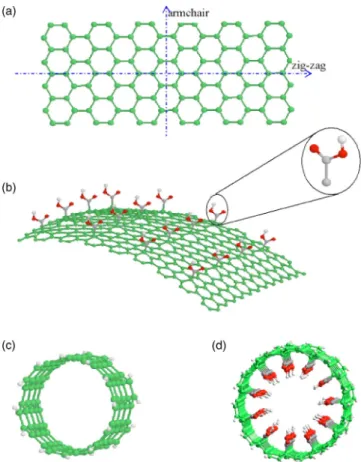
A single-walled carbon nanotube can be viewed as a graphite sheet that is rolled up into a cylinder. As shown in Fig. 1, either the zig-zag 共n,0兲 nanotube along x axis or the armchair共n,n兲 nanotube along y axis can be formed, where the index共n,m兲 indicates the helical structure of a nanotube. It was shown that the zig-zag or armchair structure of a nanotube has no effect on the diffusion behavior of molecu-lar mixtures.23,24 In this study, we construct the armchair 共n,n兲 nanotube with an index n=6–10 corresponding to an inner diameter of 6.79, 8.15, 10.83, 12.15, or 13.57 Å. Un-altered SWNTs are hydrophobic.25 To prepare a hydrophilic nanotube, carboxyl acid groups共–COOH兲 are first anchored on a flat graphite sheet with even spacing. The site density of –COOH groups on the surface is 1.59 / nm2. Then, the graphite sheet with –COOH groups is rolled up and energy is minimized using the steepest descent method. These hydro-philic armchair nanotubes have the inner diameters of 7.33, 8.40, 10.81, 12.22, and 13.41 Å, respectively, which exclude the length of –COOH groups. Kyotani et al.26 proposed a template technique to chemically modify the inner wall of a carbon nanotube into a hydrophilic surface by HNO3 oxida-tion. The length of all SWNTs is 30.0 Å. The two ends of the SWNTs are open and H terminated. The universal force field was applied to describe the SWNTs. The carbon nanotubes used in this work are first optimized using molecular me-chanics and then kept rigid during the simulations.
A binary mixture of water and methanol is examined in this study. We use the simple point charge 共SPC兲 model of Berendsen et al.27 to describe water-water interactions. The SPC model gives reasonable structural and thermodynamic properties, such as liquid density, heat of vaporization, and diffusion constant as compared with experimental data.27For methanol, a number of simple models have been previously proposed. The models proposed by Jorgensen et al.28and by Haughney et al.29have been widely used for liquid simula-tions. Both models give results for a range of properties that are in good agreement with the available experimental val-ues. In our simulations, each methanol molecule is described by the model for optimized potentials for liquid simulations 共OPLS兲 proposed by Jorgensen et al.28
because Jorgensen’s model can reproduce both gas-phase dimmer properties and liquid density at ambient temperature and pressure. In the OPLS model, three interaction sites are positioned on the oxygen 共O兲 nuclei, hydroxyl proton 共H兲, and united methyl 共CH3兲 group centered on the carbon 共C兲, respectively.
Fluid-nanotube and fluid-fluid interactions are given by the sum of the long-range Coulombic and short-range van der Waals共VDW兲 terms,
Uf f=
兺
i n兺
nj再
qiqj 40rij+ 4ij冋
冉
ij rij冊
12 −冉
ij rij冊
6册
冎
. 共1兲 where rijis the separation distance between the atoms i and j , qi is the partial charge of atom i ,ij is the atom collision FIG. 1. 共a兲 A hexagonal graphite sheet to create a zig-zag or armchair nanotube by rolling up along x or y axis;共b兲 A graphite sheet with active –COOH groups;共c兲 A armchair SWNT with a diameter of 8.15 Å; 共d兲 A hydrophilic SWNT decorated with –COOH groups having an inner diameter of 8.40 Å.diameter, andijis the well depth. The Lennard-Jones 共LJ兲 parameters are calculated using the Lorentz–Berthelot com-bining rule, whereij=共i+j兲/2 and ij=
冑
ij. Table I lists the LJ parameters and partial charges used in this study.B. Simulation methodology
In this work, the DCV-GCMD technique is employed to study the transport of molecules from liquid phase to vacuum under a fixed chemical potential gradient. The DCV-GCMD technique19–22 is a combination of grand canonical Monte Carlo 共GCMC兲 and molecular dynamics simulations. The simulation system of 8.6⫻2.4⫻2.4 nm3is divided into two control volumes共CV1 and CV2兲, two buffer boxes 共B1 and B2兲, and a flow region, as shown in Fig. 2. The CV1 and CV2 contain bulk fluids at high and low chemical potentials, respectively. The simulation box is confined by two hard walls, located at each end of the box in the x direction. The SWNT is placed in the middle of the simulation box共i.e., the flow region兲. A typical DCV-GCMD simulation is performed following the procedure below.
Initial condition. The initial configuration of the water-methanol mixture 共64mol%–36mol%兲 was first generated and equilibrated by a separate GCMC simulation in the bulk with dimensions of 2.4⫻2.4⫻2.4 nm3. Then, the preequili-brated box of the fluid mixture is placed in the CV1. The use of vacuum in the sink共CV2兲 eliminates the need to specify the final product composition of a mixture. The buffer boxes
of B1 and B2 are left empty at the beginning of simulations so that entrance 共or exit兲 effects can be investigated.
GCMC phase. During GCMC 共VT兲 simulations, the chemical potential of each component in the CV1 is main-tained constant by carrying out a sufficient number of GCMC trials so that the source共CV1兲 contains a liquid mix-ture with a fixed composition共64mol%–36mol%兲 while the sink 共CV2兲 is kept under a vacuum. In GCMC simulations, there are four types of trials, i.e., move共translation and ro-tation兲, insertion, deletion, and swap using the Metropolis algorithm. For a translation or rotation movement, a trial configuration is generated by randomly choosing one mol-ecule in the CV1 and giving it either a uniform random dis-placement or a rotation about a random axis. The displace-ment of each move is adjusted to ensure an acceptance ratio of ⬃50%. For an insertion trial, the position and orientation of an individual molecule are chosen at random and the ecule is then inserted. The velocity of the new created mol-ecule is assigned with a Maxwell–Bolzmann distribution at 300 K. For a destruction trial, a chosen molecule is removed from the system. In a binary mixture system, the swap tech-nique 共i.e., changing the identity of two species兲 has been shown to increase the speed of convergence and reduce fluc-tuations in particle number once equilibrium is reached.
MD phase. After a set number of GCMC steps in the control volumes, the canonical ensemble共NVT兲 MD simula-tion is performed to move all liquid molecules 共water and methanol兲 in the entire simulation box. Since bond vibrations are very fast, any covalent bonds involving hydrogen atoms in water and methanol are kept rigid using the RATTLE algorithm with a geometric tolerance of 0.0001. Newtonian equations of motion are integrated using the velocity Verlet algorithm with a time step of 1.0 fs. The system is coupled to a bath at a temperature of 300 K using the velocity scaling algorithm.
The liquid mixture flows from the CV1共liquid reservoir兲 to the buffer zone, before entering the SWNT and finally the CV2 共vacuum sink兲. As the MD simulation progresses the number of particles in the CV1 decreases. The chemical po-tential of each component in the control volumes changes accordingly. Thus, GCMC simulations are periodically per-formed in each control volume until the chemical potential is restored to its prescribed value. In this work, an optimum value for nGCMC/ nMD 共the ratio of stochastic to dynamic steps兲 of 100–150 is used to yield the correct concentration of the water and methanol mixture and keep a minimum computing time. The periodic boundary conditions and mini-mum image conventions are only applied to the y and z directions for fluid molecules in the control volumes and the TABLE I. The LJ parameters and partial charges for water, methanol,
–COOH group, and nanotube.
Site 共nm兲 共kJ/mol兲 q共e兲
H2O O 0.316 56 0.1554 −0.82 H 0.0 0.0 0.41 CH3OH CH3 0.3775 0.8661 0.265 O 0.3070 0.7113 −0.7 H 0.0 0.0 0.435 –COOH Ca 0.34 0.2328 0.08 C 0.375 0.4393 0.55 vO 0.296 0.8786 −0.50 O 0.30 0.7133 −0.58 H 0.0 0.0 0.45 Nanotube C 0.34 0.2328 0.0 a
Anchored carbon on the nanotube.
FIG. 2. Schematic representation of a DCV-GCMD simulation cell. MD simulations are performed for the entire system while GCMC simulations are performed in between MD simulations to maintain the chemical potentials of both control volumes.
buffer boxes. The nonbonded interactions are described by the cut-shifted potential at a cutoff of 1.0 nm for short-range VDW interactions and 1.2 nm for long-range Coulombic in-teractions. All simulations are run for 3–5 ns to reach steady state. The properties reported are collected during the last 1 ns unless specified otherwise.
III. RESULTS AND DISCUSSION
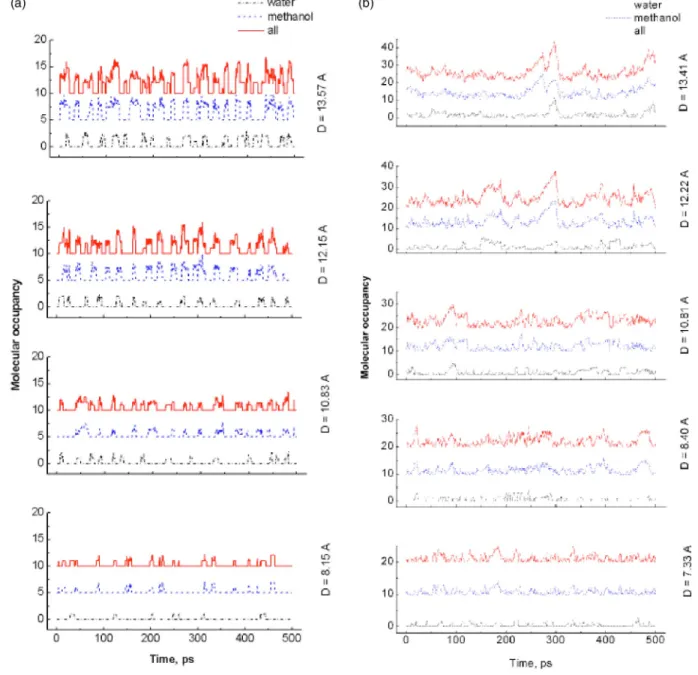
Figure 3 shows the occupancy profile of water and methanol molecules as a function of time for both hydropho-bic and hydrophilic SWNTs at several pore sizes. The num-ber of water and methanol molecules inside the nanotube is graphed for the last 500 ps of each simulation. For the hy-drophobic SWNTs, the occupancy of water and methanol molecules increases with the size of the nanotubes. The smallest共6,6兲 SWNT shows that neither water nor methanol
can enter the nanotube. For other hydrophobic nanotubes with diameters⬎6.79 Å, the occupancy of water and metha-nol molecules oscillates between empty and partially filled states. The water and methanol mixture flows through the hydrophobic nanotubes in a pulselike fashion. Similar oscil-lating behavior was also observed by others in both experiments30 and simulations.14,17 Unlike the hydrophobic SWNTs, the occupancy profiles in Fig. 3共b兲 show that the water and methanol mixture diffuses through the hydrophilic nanotubes in a continuous fashion. The number of adsorbed water and methanol molecules in the hydrophilic nanotubes increases with their size. Beckstein and co-workers14,15 found that a closed hydrophobic pore can be switched to an open state for water permeation by introducing the hydro-philic character of the pore. It should be noted that, for the narrowest hydrophilic nanotube with similar diameter to the FIG. 3. Occupancy profiles of water and methanol molecules inside a hydrophobic共a兲 or hydrophilic 共b兲 nanotube as a function of time. For hydrophobic nanotubes, the curves of methanol molecules and total molecules are shifted by 5 and 10, respectively. For hydrophilic nanotubes, the curves of methanol molecules and total molecules are shifted by 10 and 20, respectively.
hydrophobic共6,6兲 tube, both water and methanol molecules can enter the pore while this phenomena is not observed for the hydrophobic共6,6兲 tube.
To examine the effect of confinement on the molecular motion of liquid water and methanol inside the nanotubes, we calculated the flux by measuring the net movement of each component crossing a given plane in the steady state. Invariance of the fluxes with time indicates that the system reaches steady state. The flux can be expressed as
Ji=
NiLR− NiRL nsteps⌬t Ayz
, 共2兲
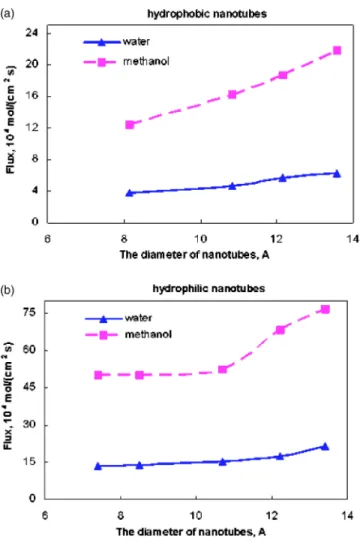
where NiLRand NiRLare the number of the fluid molecules of component i moving from the left to the right and vice versa, respectively; nstepsis the number of MD steps; Ayzis the area of the yz plane; and⌬t is the MD time step of 1 fs. Figure 4 shows the fluxes of water and methanol as a function of time for SWNTs with different pore diameters. Simulation results show that the fluxes of water and methanol increase with increasing the diameter of the nanotube. The fluxes of water and methanol are significantly higher in the hydrophilic nanotubes than in the hydrophobic nanotubes.
Transport of fluid molecules through a nanotube is com-posed of two consecutive steps: 共a兲 entering the nanotube from the bulk 共i.e., pore entrance effect兲 and 共b兲 flowing
through the nanotube 共i.e., adsorption/desorption and diffu-sion inside the pore兲. The compilation of these two steps results in a net flux. In the first step, the entry of fluid mol-ecules into a nanotube can be described as follows. For a hydrophobic nanotube, the first molecule initially enters an empty nanotube from the bulk when driven by a concentra-tion gradient and thermal fluctuaconcentra-tions. Subsequently, more molecules in the bulk are dragged into the tube by forming a continuous chain with those inside the pore through hydro-gen bonding,31 as shown in Fig. 5. Similar single-file ar-rangements of liquid molecules were also observed in other simulation studies of water confined in hydrophobic nanotubes.18,32,33 When fluid molecules enter a nanopore, some hydrogen bonds present in the bulk phase could be lost due to confinement. Hummer et al.17 recently reported that water molecules could enter a hydrophobic nanotube from the bulk, although it was expected that the hydrophobic pore had the tendency to discourage the passage of water mol-ecules due to its water-repellent properties and its limited interior space. They found that water molecules entering a hydrophobic nanotube from the bulk lose two out of four hydrogen bonds, but a fraction of lost energy was recovered through attractive water-nanotube VDW interactions. For hy-drophilic pores, as compared with hydrophobic nanotubes, the energy expense of breaking the network of hydrogen bonds in the bulk of fluids can be greatly compensated by attractive interactions between fluid molecules and –COOH groups near the entrance of the hydrophilic nanotubes. Thus, more water and methanol molecules are able to enter and wet the hydrophilic SWNTs 共Fig. 3兲. In the second step, the adsorption/desorption and diffusion of fluid molecules inside a nanotube are governed by fluid-fluid and fluid-surface in-teractions inside the pore, particularly for the hydrogen bonding in the systems studied here. In Table II, the average number of hydrogen bonds 共HB兲 per molecule 具nHB典 is re-ported in each nanotube for methanol and water calculated according to a geometrical definition. A hydrogen bond ex-ists if the donor-acceptor distance is less than 0.35 nm and the hydrogen donor-acceptor angle is smaller than 60°. As can be seen in Table II,具nHB典 of both water and methanol is higher in the hydrophilic nanotubes than in the hydrophobic nanotubes. The formation of a hydrogen-bond network among fluid molecules and between fluid molecules and the surface –COOH groups can greatly suppress the mobility of fluid molecules inside the hydrophilic nanotubes. It should be pointed out that the number of hydrogen bonds strongly FIG. 4. Fluxes of water and methanol molecules as a function of the
diam-eters of a hydrophobic共a兲 or hydrophilic 共b兲 nanotube. The lines are drawn to guide eyes.
FIG. 5. Snapshot of a hydrophobic共10,10兲 nanotube containing water and methanol molecules. Hydrogen bonds are marked by dashed lines with their distances. The color scheme is oxygen in red, hydrogen in white, and united CH3in blue.
depends on the diameter of a nanotube. For the hydrophobic nanotubes, the liquid mixture does not form a complete hydrogen-bond network due to a limited number of adsorbed molecules inside the pore. For the hydrophilic tubes, the av-erage number of hydrogen bonds for both water and metha-nol increases with a decrease in the diameter of the nano-tubes. Fluid molecules are more likely to form hydrogen bonds with either themselves or with the hydrophilic sur-faces inside the smaller nanotubes due to geometrical con-finement. However, the density of the fluid mixture is still quite low inside the nanotubes as compared to that in the bulk. To further examine the effect of hydrogen bonding on molecular mobility, we performed additional MD simula-tions of a single molecule in both hydrophobic and hydro-philic nanotubes. Simulation results show that the self-diffusion coefficients of both water and methanol molecules in the hydrophilic nanotubes共10−7cm2/ s兲 are two orders of magnitude smaller than in the hydrophobic nanotubes 共10−5 cm2/ s兲. Hydrogen bonds slow down molecular motion. The transport of fluids inside hydrophobic nanotubes is faster than inside hydrophilic nanotubes. Allen and co-workers16 also found from their molecular dynamics simulations that ion diffusion along the pore axis exhibits a general increase with channel radius in hydrophobic channels, but remains fairly low in hydrophilic channels. Thus, for a hydrophobic nanotube, it is difficult for water and methanol molecules to enter the pore, but they will quickly diffuse through it once inside the pore. On the contrary, for a hydrophilic nanotube, water and methanol molecules easily enter the pore but have a difficult time flowing through it. The net effect is that fluid transport through hydrophilic nanotubes is faster than through hydrophobic ones. This indicates that fluid transport across the pore is controlled by the entrance effects. How-ever, if the nanotube has a larger diameter and is sufficiently long, then the pore entrance effect will weaken with respect to the effect due to fluid adsorption/desorption and diffusion inside the pore.
For the transport of the liquid mixture, it is interesting to note the selectivity of the pores for the methanol or water mixtures. The separation efficiency for component j over component i to transport through a pore can be described by
Si/j= Jj/Ji xj/xi
, 共3兲
where Jj/ Jiis a ratio of flux of component j to component i, and xj/ xi is a ratio of the molar fraction of component j to that of component i. Table III shows that the separation
effi-ciency Smethanol/water is ⬃6.0 and 6.5 for hydrophobic and hydrophilic nanotubes, respectively. For the transport of a liquid mixture through a pore, each component has different entrance effects and behaviors inside the pore. For example, for the methanol and water mixture, water is a strong hydrogen-bonded polar molecule while methanol is interme-diate between nonpolar and strongly polar molecules. In the bulk phase, liquid water and methanol have an average num-ber of hydrogen bonds of 3.57 and 2.0, respectively.34Thus, methanol molecules are easier to enter the mouth of a nano-tube than water molecules for both hydrophobic and hydro-philic pores due to smaller loss in energy because of confine-ment. Methanol is transported faster inside the hydrophobic pore than the hydrophilic pore due to weaker methanol-surface hydrogen bonding. Similar selectivity can also be achieved by means of conventional VLE operation.35 The vapor pressures of water and methanol at room temperature are 3.1691 and 16.851 kPa, respectively. Their activity coef-ficients calculated from the Wilson equation are 1.072 for water and 1.188 for methanol, respectively. Based on vapor-liquid equilibrium calculations,
ymethanol/ywater xmethanol/xwater= Pmethanol0 ␥methanol Pwater0 ␥water =16.851⫻ 1.188 3.1691⫻ 1.072= 5.89.
However, by adjusting operating conditions 共e.g., tempera-ture and feed composition兲 or pore parameters 共e.g., pore size and surface property兲, the selective separation of water and alcohol mixtures can be achieved. Further studies are needed to address this issue.
TABLE II. The average number of hydrogen bonds per molecule具nHB典 in both hydrophobic and hydrophilic
nanotubes.
Hydrophobic nanotube Hydrophilic nanotube
Diameter共Å兲 Water Methanol Diameter共Å兲 Water Methanol
6.79 / / 7.33 2.85 2.13
8.15 0 0 8.40 2.96 1.80
10.83 0 0 10.81 1.74 1.20
12.15 0.8 0.5 12.22 1.40 0.75
13.57 1.0 0.4 13.41 1.32 0.71
TABLE III. Selectivity of methanol over water in both hydrophobic and hydrophilic nanotubes.
Hydrophobic nanotubes Hydrophilic nanotubes Diameter 共Å兲 Selectivity 共Smethanol/water兲 Diameter 共Å兲 Selectivity 共Smethanol/water兲 6.79 / 7.33 6.62 8.15 5.79 8.40 6.48 10.83 6.17 10.81 6.10 12.15 5.84 12.22 6.92 13.57 6.16 13.41 6.40
IV. CONCLUSIONS
In this work, DCV-GCMD simulations were performed to study the transport of a liquid mixture of water and metha-nol through hydrophobic and hydrophilic nanotubes of vary-ing diameters under a chemical potential gradient. For the hydrophobic nanotubes, water and methanol molecules are difficult to enter the pore, but will quickly diffuse through the pore once they enter the pore. On the contrary, for the hydrophilic nanotubes, water and methanol molecules easily enter the pore, but difficult to flow through the pores. The net effect is that fluid transport through hydrophilic tubes is faster than through hydrophobic ones. Results indicate that fluid transport across the pores is controlled by the pore entrance effects. It is observed that the water and methanol mixture flows through the hydrophobic nanotubes in a pulse fashion while through the hydrophilic nanotubes in a con-tinuous fashion. It appears that similar selectivity can also be achieved by means of conventional VLE operation. How-ever, it is expected that the pores can provide more desirable selectivity when appropriate conditions are adopted.
ACKNOWLEDGMENTS
The authors thank Professor Bruce A. Finlayson for helpful discussions. They gratefully acknowledge the Na-tional Science Foundation共Grant No. CTS-0092699兲 for fi-nancial support. This work was also supported by a graduate research award to J.Z. from the Center for Nanotechnology at the University of Washington.
1
L. Sun and R. M. Crooks, J. Am. Chem. Soc. 122, 12340共2000兲.
2
C. Liu, Y. Fan, H. T. Cong, H. M. Cheng, and M. S. Dreselhaus, Science 286, 1127共1999兲.
3
M. Zheng, A. Jagota, E. D. Semke, B. A. Diner, R. S. Mclean, S. R. Lustig, R. E. Richardson, and N. G. Tassi, Nature共London兲 2, 338 共2003兲.
4
D. W. Deamer and M. Akeson, Trends Biotechnol. 18, 147共2000兲.
5
P. M. Ajayan and S. Iijima, Nature共London兲 361, 333 共1993兲.
6
P. M. Ajayan, O. Stephan, P. Redlich, and C. Colliex, Nature共London兲 375, 564共1995兲.
7
B. Roux and M. Karplus, Annu. Rev. Biophys. Biomol. Struct. 23, 731 共1994兲.
8
D. Fu, A. Libson, L. J. W. Miercke, C. Weitzman, P. Nollert, J. Krucinski, and R. M. Stroud, Science 290, 481共2000兲.
9
S. A. Miller, V. Y. Young, and C. R. Martin, J. Am. Chem. Soc. 123, 12335共2001兲.
10
L. Sun and R. M. Crooks, J. Electrochem. Soc. 122, 12340共2000兲.
11
J. Li, C. Papadopoulos, and J. Xu, Nature共London兲 402, 253 共1999兲.
12
E. Dujardin, T. W. Ebbesen, H. Hiura, and K. Tanigaki, Science 265, 1850 共1994兲.
13
T. W. Ebbesen, J. Phys. Chem. Solids 57, 951共1996兲.
14
O. Beckstein and M. S. P. Sansom, Proc. Natl. Acad. Sci. U.S.A. 100, 7063共2003兲.
15
O. Beckstein, P. C. Biggin, and M. S. P. Sansom, J. Phys. Chem. B 105, 12902共2001兲.
16
T. W. Allen, S. Kuyucak, and S. H. Chung, J. Chem. Phys. 111, 7985 共1999兲.
17
G. Hummer, J. C. Rasaiah, and J. P. Noworyta, Nature共London兲 8, 188 共2001兲.
18
A. Kalra, S. Garde, and G. Hummer, Proc. Natl. Acad. Sci. U.S.A. 100, 10175共2003兲.
19
G. S. Heffelfinger and F. van Swol, J. Chem. Phys. 100, 7548共1994兲; G. S. Heffelfinger and D. M. Ford, Mol. Phys. 94, 659共1998兲; D. M. Ford and G. S. Heffelfinger, ibid. 94, 673 共1998兲; P. Thompson and G. S. Heffelfinger, J. Chem. Phys. 109, 6406共1998兲; P. I. Pohl and G. S. Hef-felfinger, J. Membr. Sci. 155, 1共1999兲.
20
J. M. D. MacElroy, J. Chem. Phys. 101, 5274共1994兲; J. M. D. MacElroy and M. J. Boyle, Chem. Eng. J. 74, 85共1999兲.
21
R. F. Cracknell and D. Nicholson, J. Chem. Soc., Faraday Trans. 90, 1487 共1994兲; R. F. Cracknell, D. Nicholson, and N. Quirke, Phys. Rev. Lett. 74, 2463共1995兲.
22
Q. Zhang, J. Zheng, A. Shevade, L. Zhang, S. H. Gehrke, G. S. Heffelfin-ger, and S. Jiang, J. Chem. Phys. 117, 808共2002兲.
23
Z. Mao and S. B. Sinnott, J. Phys. Chem. B 105, 6916共2001兲.
24
A. I. Skoulidas, D. M. Ackerman J. K. Johnson, and D. S. Sholl, Phys. Rev. Lett. 89, 185901共2002兲.
25
E. A. Müller, L. F. Rull, L. F. Vega, and K. E. Gubbins, J. Phys. Chem. 100, 1189共1996兲.
26
T. Kyotani, S. Nakazaki, W. Xu, and A. Tomita, Carbon 39, 771共2001兲.
27
H. J. C. Berendsen, J. P. M. Postma, W. F. von Gunsteren, and J. Hermans,
Intermolecular Forces共Reidel, Dordrecht, 1981兲.
28
W. L. Jorgensen, J. M. Briggs, and M. L. Conteras, J. Phys. Chem. 94, 1683共1990兲.
29
M. Haughney, M. Ferrario, and I. R. McDonald, Mol. Phys. 58, 849 共1986兲.
30
I. Brovchenko, A. Geiger, A. Oleinikova, and D. Paschek, Eur. Phys. J. E 12, 69共2003兲.
31
A. Waghe, J. C. Rasaiah, and G. Hummer, J. Chem. Phys. 117, 10789 共2002兲.
32
J. Marti and M. C. Gordillo, Phys. Rev. E 64, 021504共2001兲.
33
D. J. Mann and M. D. Hall, Phys. Rev. Lett. 90, 195503共2003兲.
34
A. V. Shevade, S. Jiang, and K. E. Gubbins, J. Chem. Phys. 113, 6933 共2000兲.
35