Size dependence of the electronic structures and electron-phonon coupling in ZnO
quantum dots
S. C. Ray, Y. Low, H. M. Tsai, C. W. Pao, J. W. Chiou, S. C. Yang, F. Z. Chien, W. F. Pong, M.-H. Tsai, K. F. Lin , H. M. Cheng, W. F. Hsieh, and J. F. Lee
Citation: Applied Physics Letters 91, 262101 (2007); doi: 10.1063/1.2824396
View online: http://dx.doi.org/10.1063/1.2824396
View Table of Contents: http://scitation.aip.org/content/aip/journal/apl/91/26?ver=pdfcov Published by the AIP Publishing
Articles you may be interested in
Anomalous optical processes in photoluminescence from ultrasmall quantum dots of ZnO J. Vac. Sci. Technol. A 29, 03A120 (2011); 10.1116/1.3578344
Photoluminescence and photoabsorption blueshift of nanostructured ZnO: Skin-depth quantum trapping and electron-phonon coupling
Appl. Phys. Lett. 95, 031906 (2009); 10.1063/1.3184566
Band gap engineering and spatial confinement of optical phonon in ZnO quantum dots Appl. Phys. Lett. 88, 263117 (2006); 10.1063/1.2218775
Size dependence of photoluminescence and resonant Raman scattering from ZnO quantum dots Appl. Phys. Lett. 88, 261909 (2006); 10.1063/1.2217925
Behind the weak excitonic emission of ZnO quantum dots: ZnO/Zn(OH ) 2 core-shell structure Appl. Phys. Lett. 80, 210 (2002); 10.1063/1.1432763
This article is copyrighted as indicated in the article. Reuse of AIP content is subject to the terms at: http://scitation.aip.org/termsconditions. Downloaded to IP: 140.113.38.11 On: Thu, 01 May 2014 00:00:45
Size dependence of the electronic structures and electron-phonon coupling
in ZnO quantum dots
S. C. Ray, Y. Low, H. M. Tsai, C. W. Pao, J. W. Chiou,a兲 S. C. Yang, F. Z. Chien, and W. F. Pongb兲
Department of Physics, Tamkang University, Tamsui 251, Taiwan
M.-H. Tsai
Department of Physics, National Sun Yat-Sen University, Kaohsiung 804, Taiwan
K. F. Lin, H. M. Cheng, and W. F. Hsieh
Department of Photonics and Institutes of Electro-Optical Engineering, National Chiao Tung University, Hsinchu 300, Taiwan
J. F. Lee
National Synchrotron Radiation Research Center, Hsinchu 300, Taiwan
共Received 21 October 2007; accepted 21 November 2007; published online 26 December 2007兲 The electronic structures and optical properties of various sizes of ZnO quantum dots共QDs兲 were studied using x-ray absorption, photoluminescence, and Raman spectroscopy. The increase in the intensity ratio of the second-order Raman spectra of longitudinal optical mode and its fundamental mode, which is related to the strength of the electron-phonon coupling共EPC兲, is found to increase with the size of QD. The trend of EPC also correlates with the increase of the intensity ratio of the O 2p 共I兲 and 2p 共I兲 orbital features in the O K-edge x-ray absorption near-edge structure 共XANES兲 as the size of QD increases. The EPC and XANES results suggest that the crystal orientations of ZnO QDs are approximately aligned with the c axis parallel with the polarization of x-ray photons. © 2007 American Institute of Physics. 关DOI:10.1063/1.2824396兴
Electron-phonon coupling 共EPC兲 in nanomaterials has attracted much attention in the past years because great in-terest exists to elucidate its fundamental physics and poten-tial applications.1–3The increase of the strength of EPC with the size of the nanostructures substantially influences the electrical and optical properties of these materials. Recently, Cheng et al. and Lin et al. investigated the size dependence of the optical properties and EPC of ZnO quantum dots 共QDs兲 using photoluminescence 共PL兲 and Raman spectroscopy.4–6However, the dependence of the strength of EPC on the size of the nanomaterials is still not well understood.1–6 In contrast, the anomalous blueshift of the luminescence emission spectra of ZnO nanorods/nanowires with the decrease of their diameters, which are far beyond the quantum confinement regime, has been understood to be caused by the surface effect associated with the increased surface-to-volume ratio.7 The calculation from first prin-ciples may further provide a theoretical basis for understand-ing the observed shift in the emission spectra of nanomaterials.8 The nanostructures of ZnO are inherently asymmetric, so that their orientations strongly affect their x-ray absorption and optical properties.9 Despite many phe-nomenological studies, the origin of the shift in phonon fquency and carrier recombination in ZnO nanomaterials re-main the subjects of much debates.10,11This work focuses on the understanding of the relationship between the electronic structures revealed by the x-ray absorption near-edge struc-ture共XANES兲, the extended x-ray absorption fine structure
共EXAFS兲, and the observed ultraviolet 共UV兲-PL and reso-nant Raman spectroscopy spectra, in particular the peak shift in the spectra and size-dependent EPC in ZnO QDs.
Zn L3-, Zn K-, and O K-edge XANES and Zn K-edge
EXAFS spectra were obtained at the National Synchrotron Radiation Research Center in Hsinchu, Taiwan. The room-temperature UV-PL and resonant Raman spectroscopy were performed using a He–Cd laser with a wavelength of 325 nm. ZnO QDs were synthesized using the sol-gel method and their mean sizes were tuned by controlling the concentration of zinc precursor, as described elsewhere.4–6 Three ZnO QD samples with diameters of ⬃6, 12, and 20 nm were determined by transmission electron microscopy 共TEM兲. In Fig.1, the upper inset shows TEM images of the
a兲Permanent address: Department of Applied Physics, National University of Kaohsiung, Taiwan.
b兲Author to whom correspondence should be addressed. On leave at: Ad-vanced Light Source, Lawrence Berkeley National Laboratory, Berekeley, California. Electronic mail: [email protected].
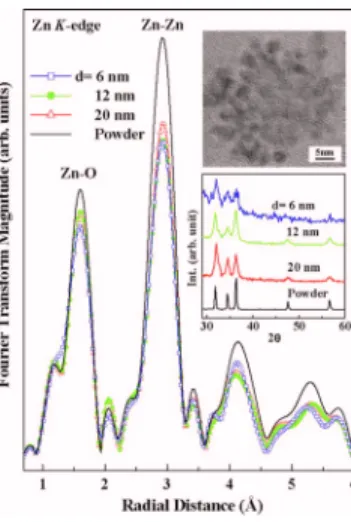
FIG. 1. 共Color online兲 Magnitude of FT of EXAFS k3data at the Zn
K-edge of all ZnO QDs and powder. TEM image of 6 nm QDs共upper inset兲
and the XRD spectra共lower inset兲 of ZnO QDs and powder.
APPLIED PHYSICS LETTERS 91, 262101共2007兲
0003-6951/2007/91共26兲/262101/3/$23.00 91, 262101-1 © 2007 American Institute of Physics
This article is copyrighted as indicated in the article. Reuse of AIP content is subject to the terms at: http://scitation.aip.org/termsconditions. Downloaded to IP: 140.113.38.11 On: Thu, 01 May 2014 00:00:45
6 nm QDs and the lower inset shows x-ray diffraction 共XRD兲 spectra of all QDs and the ZnO powder. TEM reveals that QDs are essentially small spheroids/ellipsoids and XRD indicates the presence of a hexagonal共wurtzite兲 structure in QDs such as the ZnO powder. Figure 1 also displays the Fourier transform 共FT兲 of Zn K-edge EXAFS k3 data of ZnO QDs and powder. It reveals that the general line shape and the radial distribution of the FT spectra of QDs are al-most identical to those of the powder, which demonstrates that the local atomic structures of Zn atoms in ZnO QDs and powder are similar. Notably, the intensities of the first two main peaks in the FT spectra, corresponding to the nearest-neighbor 共NN兲 Zn–O and next-nearest-neighbor 共NNN兲 Zn–Zn bond lengths,12decrease with the decrease of the size of QD and are remarkably smaller than those of the powder. The FT spectra are further analyzed by a combination of the multiple-scattering EXAFS computer program FEFF code13 and the nonlinear least-squares-fitting computer program
FEFFIT. In NN Zn–O and NNN Zn–Zn coordination shells,
the coordination numbers 共4 and 12兲 and bond lengths 共1.98±0.01 and 3.24±0.02 Å兲 were almost identical for all ZnO QDs and powder. However, the Debye-Waller factors of the NN Zn–O coordination shell increased in the order of ⬃4.7⫻10−3 Å2 for powder, 5.7⫻10−3 for 20 and 12 nm
QDs, and 6.3⫻10−3Å2for 6 nm QD, and those of the NNN
Zn–Zn coordination shell increased in the order of ⬃8.4 ⫻10−3Å2 for powder, 1.0⫻10−2 for 20 nm QD, and 1.1
⫻10−2Å2 for 12 and 6 nm QDs. The trend suggests an
in-crease of the structural disorder around Zn sites, which is probably due to the increase of the number of dangling bonds/surface states as the size of QD decreases.
Figure 2共a兲 shows Zn L3-edge XANES spectra of ZnO
QDs and powder. Features A1 共⬃1014 eV兲, B1
共⬃1019 eV兲, and C1共⬃1023 eV兲 in Fig.2共a兲are associated
with the transition of Zn 2p electrons to unoccupied Zn 4sd states.14,15The inset at the bottom of Fig.2共a兲is a magnified view of the near-edge features after the background has been subtracted using a best-fitted Gaussian curve indicated by the dotted line. The overall intensities of features A1– C1
de-crease as the size of QD dede-creases, indicating that the num-ber of unoccupied Zn 4sd states near the conduction-band minimum is reduced as the size of QD decreases. In contrast,
the number of Zn 4p unoccupied states increases and de-creases, respectively, for features B2 and A2 as the size of
QD decreases, as shown in the inset at the top of Fig.2共a兲. The absorption edge is also observed to be shifted slightly to the higher energy side in both Zn K- and L3-edge XANES spectra as the size of QD decreases from 20 to 6 nm. As the size of ZnO QD decreases, the QD becomes nearly spherical.16 The intensities of features B2 and A2 are
en-hanced and suppressed, respectively, which may correspond to the shift of unoccupied Zn 4p states in region A2to higher energy region B2 due to the increase of the band gap. This
finding is consistent with the results of an earlier work of diameter-dependent ZnO nanorods.15 Figure 2共b兲 presents UV-PL spectra of ZnO QDs and powder and the inset dis-plays relative positions of these PL spectra of QDs, revealing the shift of the PL-maximum from ⬃3.26 eV 共20 nm兲 to 3.33 eV 共6 nm兲. However, the shifts of PL peaks of nanomaterials can principally be attributed to excitonic transitions, surface effects, quantum confinement effect, surface impurities/defects, and bulk defects such as oxygen vacancies.16,17In the present case, the quantum con-finement effect and bulk defects may not be the cause, be-cause the sizes共6–20 nm兲 are larger than the exciton Bohr radius共1–2 nm兲 共Ref.16兲 and green luminescence is absent
in ZnO QDs PL spectra. Thus, the change of the excitonic transition due to the variation of electronic density of states and surface effects are primarily responsible for the shifts of the PL peak and the Zn L3- and K-edge XANES features
toward higher energy as the size of QD decreases.
Figure 3共a兲 displays the O K-edge XANES spectra of ZnO QDs and powder. The O K-edge spectra reveal that the intensities of features A3– E3of QDs are similar to those of
the reference powder. Features A3– E3 are associated with
electron excitations from O 1s to O 2pand 2pstates.14,15 Angle-dependent XANES measurements and theoretical cal-culations have identified that features A3 共⬃535.2 eV兲 and B3共⬃537.6 eV兲 primarily correspond to the excitation of an
O 1s electron to 2pand 2porbitals,9respectively. The 2p bonds lie along the c axis, while the 2pbonds lie approxi-mately perpendicular to the c axis of QDs. The overall inten-sities of features A3 and B3 increase as the size of ZnO QD
decreases, which may reflect the increase of the unoccupied dangling bond/surface states due to the increase of the
FIG. 2.共Color online兲 共a兲 Zn L3-edge XANES spectra of all ZnO QDs and powder. Lower inset displays magnified Zn L3-edge features following back-ground subtraction and the upper inset displays the Zn K-edge XANES spectra.共b兲 Room-temperature UV-PL spectra of all ZnO QDs. Inset shows the shifts of the PL spectra.
FIG. 3.共Color online兲 共a兲 O K-edge XANES spectra of all ZnO QDs and powder. Inset displays magnified O K-edge features following background subtraction.共b兲 Resonant Raman scattering spectra of all ZnO QDs and bulk ZnO共Ref.18兲.
262101-2 Ray et al. Appl. Phys. Lett. 91, 262101共2007兲
This article is copyrighted as indicated in the article. Reuse of AIP content is subject to the terms at: http://scitation.aip.org/termsconditions. Downloaded to IP: 140.113.38.11 On: Thu, 01 May 2014 00:00:45
surface-to-volume ratio. Figure 3共b兲 presents the resonant Raman spectra of ZnO QDs and the reference bulk ZnO共the reference spectrum is taken from another study18兲. This fig-ure revealed that both first-order共at ⬃577 cm−1兲 and second
order共overtone at ⬃1150 cm−1兲 longitudinal optical phonon modes共denoted as 1LO and 2LO兲 are enhanced as QDs are downsized to 6 nm, because both modes are superposition of the LO phonon mode in which Zn and O atoms moves in the same direction in a unit cell. The enhancement of the LO phonon mode suggests an n-phonon-process contribution to the Raman cross section,5 which occurs when incoming or scattered photon matches the energy difference of two elec-tronic states. However, regardless of the enhancement, the ratio of the intensities of the second- and first-order Raman scattering cross sections of the LO mode, denoted as 2LO/ 1LO, was argued to be related to the strength of EPC.3–5
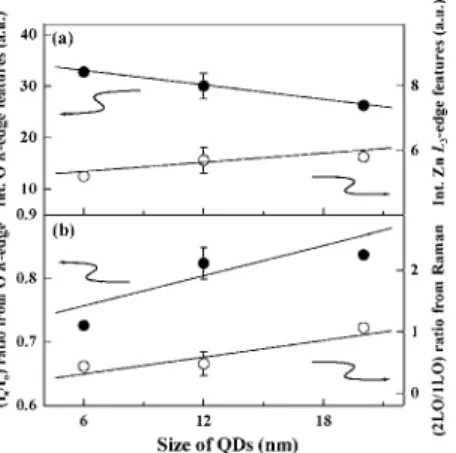
Figure 4共a兲plots the integrated intensities of the O K-and Zn L3-edge XANES features between 524– 549 and 1010– 1027 eV, which represent the numbers of O 2p and Zn 4sd unoccupied states, respectively, and vary inversely with the size of QD. The decrease of the number of Zn 4sd unoccupied states as the size of QD decreases suggests a reduction of Zn 4sd-O 2p antibonding coupling as QDs be-come smaller. In contrast, the overall intensity of the O
K-edge XANES features increases as the size of QD
de-creases. The diameter-dependent ZnO nanorods exhibit a similar trend.15 Figure4共b兲 plots the 2LO/1LO intensity ra-tio, which increases from 0.44 to 1.07 with the increase of the ZnO QD size from 6 to 20 nm. The LO Raman scatter-ing cross section is contributed principally from both the deformation and Fröhlich potentials, which involves a long-range interaction with the oscillating macroscopic electric field associated with the LO phonons.19 The increase of the 2LO/1LO intensity ratio with the increase of the QD size, as presented in Fig. 4共b兲, is mainly related to the Fröhlich interactions.3–5More recently, Hsu et al. have proposed that the strength of EPC and the exciton Bohr radius are reduced due to the less polar nature of smaller sized QDs.20 This behavior of EPC correlates with the increase of the O 2p 共I兲/2p共I兲 orbital intensity ratio in the O K-edge XANES
spectra as the size of QD increases, as also shown in Fig.
4共b兲. The enhancement of the Raman scattering cross section was argued to be due to a strong internal electric field given
rise by piezoelectric and polarization effects of the ionic ZnO QDs in the wurtzite structure.2The I/I ratio increases be-cause the highly directional 2porbitals lie along the c axis of QDs. Note that the x-ray absorption dipole transition probability is proportional to the absolute square of the di-pole transition matrix 具⌿f兩E·r兩⌿i典 between the initial state
⌿i共O 1s兲 and the final state ⌿f共O 2p兲, where E is the x-ray
electric polarization vector E and r is the position vector operator. The magnitude of this matrix element is largest when the directional ⌿f共O 2p兲 orbital is parallel with E.
For the 6 nm QDs with a more or less spherical shape and a larger surface-to-volume ratio, the distortion and rearrange-ment of Zn–O bonds near the surface cause alignrearrange-ment be-tween O 2p orbitals and E to become poor and conse-quently a reduction of the overall dipole transition probability. As the size of QD increases the dots become more like c axis oriented rods rather than spheres. In con-junction with the reduction of the ratio of the distorted sur-face region to bulklike interior region, the alignment between O 2p orbitals and E is improved with the increase of the QD size, so does the dipole transition probability. Thus, the O 1s→2p transition is enhanced. The radiative de-excitation of O 2p states are much less efficient, since the directional O 2porbitals are approximately perpendicular to the c axis. The results of Raman scattering are very similar to those of x-ray absorption of ZnO QDs when the x-ray elec-tric polarization vector is parallel to the c axis.
1H. D. Sun, T. Makino, N. T. Tuan, Y. Segawa, M. Kawasaki, A. Ohtomo, K. Tamura, and H. Koinuma, Appl. Phys. Lett. 78, 2464共2001兲. 2S. Kalliakos, X. B. Zhang, T. Taliercio, P. Lefebvre, B. Gil, N. Grandjean,
B. Damilano, and J. Massies, Appl. Phys. Lett. 80, 428共2002兲. 3R. P. Wang, G. Xu, and P. Jin, Phys. Rev. B 69, 113303共2004兲. 4H. M. Cheng, K. F. Lin, H. C. Hsu, C. J. Lin, L. J. Lin, and W. F. Hsieh,
J. Phys. Chem. B 109, 18385共2005兲.
5H. M. Cheng, K. F. Lin, H. C. Hsu, and W. F. Hsieh, Appl. Phys. Lett. 88, 261909共2006兲.
6K. F. Lin, H. M. Cheng, H. C. Hsu, and W. F. Hsieh, Appl. Phys. Lett. 88, 263117共2006兲.
7C. W. Chen, K. H. Chen, C. H. Shen, A. Ganguly, L. C. Chen, J. J. Wu, H. I. Wen, and W. F. Pong, Appl. Phys. Lett. 88, 241905共2006兲.
8M.-H. Tsai, Z. F. Jhang, J. Y. Jiang, Y. H. Tang, and L. W. Tu, Appl. Phys. Lett. 89, 203101共2006兲.
9R. A. Rosenberg, G. K. Shenoy, L.-C. Tien, D. Norton, S. Pearton, X. H. Sun, and T. K. Sham, Appl. Phys. Lett. 89, 093118共2006兲.
10V. A. Fonoberov, K. A. Alim, A. A. Balandin, F. Xiu, and J. Liu, Phys. Rev. B 73, 165317共2006兲.
11B. Kumar, H. Gong, S. Y. Chow, S. Tripathy, and Y. Hua, Appl. Phys. Lett. 89, 071922共2006兲.
12S.-W. Han, H.-J. Yoo, S. J. An, J. Yoo, and G.-C. Yi, Appl. Phys. Lett. 86, 021917共2005兲.
13A. L. Ankudinov, B. Ravel, J. J. Rehr, and S. D. Conradson, Phys. Rev. B 58, 7565共1998兲.
14J. W. Chiou, J. C. Jan, H. M. Tsai, C. W. Bao, W. F. Pong, M.-H. Tsai, I.-H. Hong, R. Klauser, J. F. Lee, J. J. Wu, and S. C. Liu, Appl. Phys. Lett.
84, 3462共2004兲.
15J. W. Chiou, K. P. Krishna Kumar, J. C. Jan, H. M. Tsai, C. W. Bao, W. F. Pong, F. Z. Chien, M.-H. Tsai, I.-H. Hong, R. Klauser, J. F. Lee, J. J. Wu, and S. C. Liu, Appl. Phys. Lett. 85, 3220共2004兲.
16V. A. Fonoberov and A. A. Balandin, J. Nanoelectron. Optoelectron. 1, 19 共2006兲.
17L. Guo, S. Yang, C. Yang, P. Yu, J. Wang, W. Ge, and G. K. L. Wong, Appl. Phys. Lett. 76, 2901共2000兲.
18J. F. Scott, Phys. Rev. B 2, 1209共1970兲.
19R. H. Callender, S. S. Sussman, M. Selders, and R. K. Chang, Phys. Rev. B 7, 3788共1973兲.
20W. T. Hsu, K. F. Lin, and W. F. Hsieh, Appl. Phys. Lett. 91, 181913 共2007兲.
FIG. 4.共a兲 Integrated intensities of O K-edge 共filled circles兲 and Zn L3-edge 共open circles兲 XANES features. 共b兲 The intensity ratio between the second-and first-order Raman scattering cross sections 2LO/1LO共open circles兲 and the intensity ratio between the O 2pand 2porbital features I/I共filled circles兲.
262101-3 Ray et al. Appl. Phys. Lett. 91, 262101共2007兲
This article is copyrighted as indicated in the article. Reuse of AIP content is subject to the terms at: http://scitation.aip.org/termsconditions. Downloaded to IP: 140.113.38.11 On: Thu, 01 May 2014 00:00:45