I
國 立 交 通 大 學
機 械 工 程 學 系
碩 士 論 文
Plasma Assisted Catalytic System for Ethanol Steam Reforming-
Comparison of Different Catalysts
利用滑動電弧的電漿輔助觸媒進行自熱反應重組乙醇的研究:
不同觸媒的比較
研究生:沈育安
指導教授:吳宗信 博士
II
利用滑動電弧的電漿輔助觸媒進行自熱反應重組乙醇的研究:
不同觸媒的比較
Plasma Assisted Catalytic System for Ethanol Steam Reforming-
Comparison of Different Catalysts
學生: 沈育安 指導教授: 吳宗信 博士
Student:Yu-An Shen
Advisor:Dr. Jong-Shinn Wu
國立交通大學
機械工程學系
碩士論文
A Thesis
Submitted to Department of Mechanical Engineering
National Chiao Tung University
In Partial Fulfillment of the Requirements
For the Degree of
Master of Science
In
Mechanical Engineering
July 2012
Hsinchu, Taiwan
二零一二年七月
I
利用滑動電弧的電漿輔助觸媒進行自熱反應重組乙醇的研究:
不同觸媒的比較
學生: 沈育安 指導教授: 吳宗信 博士
國立交通大學機械工程學系
摘要
本實驗探討利用滑動電弧的電漿輔助觸媒經過自熱反應的方式重組乙醇存並進行 產生氫氣之研究。而滑動電弧的電漿可以由一個能夠產生 20kHz 的電源供應器來提供所 需的功率。其中,在電漿輔助觸媒生產氫氣的過程搭配兩種不同種類的觸媒,分別是貴 重金 Rh 的觸媒和非貴重金屬 Ni0.35Mg2.65FeO4.5的觸媒,藉由這兩者去比較滑動電弧搭 配觸媒各有怎樣的效果。首先在探討貴重金屬中,藉由成分為 5 wt% Rh/CeO2/Al2O3的 觸媒,並在空氣流量 0.5-2.0 SLM 中,使乙醇水氣重組。在觸媒重組的實驗結果中,當 氣體流量為 1.0 SLM 時,氣體轉換率達到 100%,氫氣選擇比也達到最高的 115%,但流 量為較低的 0.5slm 和較高的 1.5slm 時,氫氣選擇比分別為 95%和 70%的選擇比。加入 電漿輔助觸媒後,可以明顯地看到在 1.0 SLM 及 1.5 SLM 時,氫氣選擇比分別為 113% 和 111%。由此結果可以看出,PAC 的系統在較高流量時,仍然可以藉由目前設備達到 較好的氫氣選擇比。然而當流量在達到更高的 2.0 SLM 時,氫氣的選擇比急速的下降至 70%上下並且和觸媒的氫氣選擇比幾乎一樣,可能的原因是,電漿處理氣體的停留時間II 下降,使得大部分的氣體僅藉由觸媒反應產生重組。 而在非貴重金屬的探討中,使用成分為 10 wt% Ni0.35Mg2.65FeO4.5/Al2O3的觸媒使酒 精重組並產生氫氣。而結果顯示出,當空氣流量在 1 SLM,觸媒溫度為 400 ℃時,觸媒 可產生出最高的氫氣選擇比大約 55%,還有的乙醇轉換效率接近 100%,並且隨著溫度 下降而下降。在經過電漿輔助後,氫氣選擇比可以來到約 75%。但即使氫氣選擇比有提 升,但是乙醇的轉換效率卻大幅下降至 73 %並且氫氣選擇比仍然遠低於搭配貴重金屬 的選擇比。而最有可能的原因是,Ni0.35Mg2.65FeO4.5 本生身「水氣轉換氫氣」的這項反 應式是幾乎不會發生的,對於氫氣的選擇比以及乙醇轉換效率會大幅下降有很好的解 釋。而上述所解釋的現象和氣體成分詳細的分析皆可透過經由氣體層析儀得知。
III
Plasma Assisted Catalytic System for Ethanol Steam Reforming-
Comparison of Different Catalysts
Student:Yu-An Shen
Advisor:Dr. Jong-Shinn Wu
Department of Mechanical Engineering
National Chiao Tung University
Abstract
In this study, the preheated ethanol steam flow is reformed using a gliding-arc
plasma-assisted catalyst (PAC) system with a power frequency of 20 kHz. Among the PAC
reforming, the noble catalyst Rh and non-noble catalyst Ni0.35Mg2.65FeO4.5 respectively is
used to compare PAC with catalyst alone reforming by generating the hydrogen selectivity
and conversion rate via different experimental parameters. In Rh catalyst alone reforming
at the range of air flow rates of 0.5-2.0 SLM, the results show that a 100% conversion rate
and a maximum of 115% hydrogen selectivity could be obtained at a C/O ratio of 0.7 with
an air flow rate of 1.0 SLM. However, hydrogen selectivity decreases rapidly to 95% and
70% at lower (0.5 SLM) and higher (1.5 SLM) air flow rates, respectively. With the
addition of a gliding arc prior to the catalyst, hydrogen selectivity reaches 113% and 111%
at air flow rates of 1.0 and 1.5 SLM, respectively, with a plasma absorption power of
approximately 200 W. This shows that very high hydrogen selectivity (>110%) can be
IV
However, at a 2.0 SLM air flow rate, the hydrogen selectivity of PAC drops down to 70%
and is almost the same as that for reforming with the catalyst alone. The above
observations correlate strongly with the residence time of the gas flow in plasma with the
catalyst. In the Ni0.35Mg2.65FeO4.5 catalyst reforming at the range of catalyst temperatures
of 200-400℃, the highest hydrogen selectivity (~55%) and conversion rate are close the 100% at temperature 400 ℃ and drop down rapidly with decreasing the temperature. However, the PAC with Ni0.35Mg2.65FeO4.5 catalyst can improve the selectivity of catalyst
alone reforming to 75% at the temperature 400℃. Even though the selectivity could be raised, the conversion drop down to 73% and hydrogen selectivity is much lower than
PAC with Rh catalyst. The reason maybe the plasma generates a lot of H2O but the
catalyst is inefficient at water-gas-shift (WGS) chemical reaction equation, as estimated
V
誌 謝
首先非常誠摯的感謝親愛的指導教授吳宗信博士,在教授細心的指導下,使我在電漿領域的研 究上,有著相當的了解並完成這篇論文,過程中不時的討論並指點我正確的方向,使我能在碩士班 兩年中對於做研究方法和做研究精神有著很大的躍進,而老師對學問的嚴謹和做事情的方態度更是 成為晚輩學習的典範。本論文的完成另外得要感謝口委交大的陳慶耀教授、劉耀先教授及台大的廖 國基教授,因為有你們的建議及意見,使得本論文能夠更完整而嚴謹。在實驗所需的資金方面,感 謝國科會淨煤計畫 (NSC 101-3113-P-009 -002) 和教育部特色計畫給予很大的協助以及交通大 學在人才的培養方面給予很大的支持 兩年來的學習,在研究室裡共同的生活點滴,學術上的討論、做研究的精神、對於社會的認識 以及對於團隊的合作,都要感謝眾位學長姐、同學、學弟妹的指教。其中包括電漿實驗組的宜偉哥、 志東、志華、駿平和國淳,特別是駿平在我實驗上的幫助尤其之多,讓我猶記在心;在模擬組方面, 包括了燦哥、蘇正勤學長、凱文哥、邱沅明學長、昆模哥、古必哥、孟華和雅茹學姐、子豪哥及冠 融哥,其中在網格給予我相當大協助的古必哥,在自控方面的冠融哥,特別感謝他們的協助;感謝 我們的助理王姊和劉小姐給予我很多的幫忙;已經畢業的偉能哥、綠豆學長及柏村哥,其中特別感 謝將我訓練得很好的偉能哥;還要謝謝同學阿康和魏世昕互相的學習和幫助。很榮幸能和以上這麼 多優秀的人共事過。 最後謝謝遠在高雄的家人,謝謝他們對於我在課業上給予最大的支持和力量,也很感謝他們能 體會我因為距離、時間、金錢和課業,所以無法常常回去和他們想處。未來希望自己的所學,能為 社會盡一份力。 最後將此文我最親愛的雙親VI
Table of Contents
摘要 ...I Abstract ... III 誌 謝 ... V Table of Contents ... VI List of Tables ... VIII List of Figure ... IX Nomenclature ... XIIChapter 1 Introduction ... 1
1.1BACKGROUND AND MOTIVATION ... 1
1.1.1 Hydrogen Energy Production ... 1
1.1.2 Overview of Reforming Technologies ... 3
1.1.3 Plasma Reforming Technologies ... 6
1.1.5 Hydrocarbon Reforming Fuel ... 8
1.1.6 Literature Survey ... 9
1.2SPECIFIC OBJECTIVES OF THIS THESIS ... 11
Chapter 2 Theoretical Method ... 13
2.1THEORETICAL ANALYSIS ... 13
2.1.1 The Physical Phenomenon of Gliding-Arc ... 13
2.1.2 Chemical Reaction Paths of Ethanol Reforming ... 14
2.1.3 Definition of Several Performance Parameters ... 15
Chapter 3 Experimental Methods ... 17
3.1OVERVIEW OF EXPERIMENTAL SETUP ... 17
3.2EXPERIMENTAL FACILITIES ... 18
3.2.1 Plasma Reactor ... 18
3.2.2 AC Power Supply and Pulse Generator ... 18
3.2.3 Fuel Feeding and Heating System ... 19
3.2.4 Catalyst Preparation... 20
3.2.4.1 Rh/CeO2/Al2O3 ...20
3.2.4.2 Ni0.35Mg2.65FeO4.5/Al2O3 ...21
VII
3.4EXPERIMENTAL PROCEDURES ... 22
3.4.1 Catalytic Reforming ... 22
3.4.2 Plasma Reforming ... 22
3.4.3 Plasma Assisted Catalytic Reforming ... 22
3.5TEST CONDITIONS ... 23
Chapter 4 Characterization of Gliding Arc Plasma ... 24
4.1VISUALIZATION ... 24
4.2ELECREICAL PROPERTIES ... 24
Chapter 5 Results and Discussion ... 25
5.1REFORMING WITH GLIDING ARC PLASMA ... 25
5.1.1 Effect of C/O ratio... 25
5.1.2 Effect of Gas Flow Rate ... 25
5.2CATALYST REFORMING ... 26
5.2.1 Rh ... 27
5.2.2 Ni0.35Mg2.65FeO4.5/Al2O3 ... 28
5.3PLASMA ASSISTED CATALYST (PAC)REFORMING ... 28
5.3.1 PAC reforming with Rh catalyst ... 29
5.3.2 PAC reforming with Ni0.35Mg2.65FeO4.5 Catalyst ... 30
Chapter 6 Conclusion and Future Work ... 31
6.1CONCLUSION ... 31
6.2RECOMMENDATIONS FOR FUTURE WORK ... 33
References ... 34
Appendix A. Discussion of Gliding Arc in Tornado (GAT) ... 42
Appendix B. Discussion of Magnetic Gliding Arc Discharge (MGAD) ... 44
VIII
List of Tables
Table 1.1: Properties of ethanol steam reforming with different noble metal catalysts. ... 46
Table 1.2: Properties of ethanol steam reforming with different non-noble metal catalysts. ... 47
Table 1.3: Summary of important features, experiments and parameters for plasma alone reforming. ... 48
Table 1.4: Summary of important features, experiments and parameters for PAC. ... 49
Table 1.4: Summary of plasma power input type. ... 50
Table 3.1: Test Condition of gliding arc, catalyst(Rh/CeO2/Al2O3), PAC with gliding arc reforming ... 51
Table 3.2: Test Conditions of catalyst (Ni0.35Mg2.65FeO4.5), PAC with gliding reforming ... 51
Table 5.1: The composition after the plasma reactor at a C/O ratio of 0.7 at different air flow rates. ... 52
Table Appendix A. 1: The parameters for simulation of gliding arc in tornado. ... 53
Table Appendix B. 1: The parameters for simulation of magnetic gliding arc discharge ... 54
IX
List of Figure
Figure 1.1: Sketch of the typical test arrangement for ethanol reformer (left) and the SOFC (right) at
CGET of NCTU. ... 56
Figure 1.2: The basic reaction of ethanol steam reforming [Vizcaino et al., 2007]. ... 56
Fig. 1.3: Comparisons of yields for non-thermal (new plasmatron) and thermal (old plasmatron) plasmas [G. Petipas, et al., 2007]. ... 57
Fig. 1.4: The comparison between different plasma reactors [G. Petipas, et al., 2007]. ... 57
Figure 1.5: An energy diagram indicating the standard enthalpy (△H°) and free energy changes (△G°) in kJ/mol for the reactions in a renewable energy cycle operating between CO2 and biomass [L. D. Schmidt, et al., 2004]. ... 58
Figure 1.6: Typical arrangement of instrumentation for PAC system [Y. C. Yang et al., 2009]. ... 58
Figure 2.1: Schematic of gliding arc reactor. [A. Fridman et al., 2002]. ... 59
Figure 2.2: (a) voltage waveform of gliding arc prduction; (b) current waveform of gliding arc production [Antonius I. et al., 2006]. ... 60
Figure 3.1: The experimental arrangement of PAC system. ... 60
Figure 3.2: Gas Chromatograph. ... 61
Figure 3.3: The self-designed gliding arc reactor. ... 62
Figure 3.4: PVM500 plasma driver ... 62
Figure 3.5: The MFC and liquid pump... 63
Figure 3.6: The fuel Injections ... 63
Figure 3.7: The furnaces for heating system ... 64
Figure 3.8: The Rh catalyst setup procedure. ... 64
Figure 3.9: The Ni0.35Mg2.65FeO4.5catalyst setup procedure ... 65
Figure 3.9: High-voltage probe. ... 65
Figure 3.10: Rogowski coil and Oscilloscope. ... 66
Figure 4.1: The visualization of gliding arc discharge. The parameters: air flow rate is 1..5 SLM; The plasma power from power supply is 223 W with 20 kHz ... 67
X
Figure 4.3: The elecreical properties- I-V wave form. ... 69 Figure 5.1: The conversion rate, SH2 and SCO2 versus the C/O ratio with plasma alone. ... 70
Figure 5.2: The conversion rate, SH2 and SCO2 as functions of the air flow rate with plasma alone at a C/O
ratio of 0.7. ... 71 Figure 5.3: SH2, SH2O and SCH4 as functions of the air flow rate with plasma alone at a C/O ratio of 0.7. .... 72
Figure 5.4: SCO2, SCO and SCH4 as functions of the air flow rate with plasma alone at a C/O ratio of 0.7. ... 73
Figure 5.5: The conversion rate, hydrogen selectivity and carbon dioxide selectivity as functions of the air flow rate with catalyst alone. ... 74 Figure 5.6: The conversion rate, hydrogen selectivity and carbon dioxide selectivity as functions of the catalyst temperature with catalyst alone. (Ni0.35Mg2.65FeO4.5) ... 75
Figure 5.7: The conversion rate, hydrogen and carbon dioxide selectivity as a function air flow rate for the cases of PAC with Rh catalyst. ... 76 Figure 5.8: The comparison of conversion rate between catalyst reforming and PAC reforming using Ni0.35Mg2.65FeO4.5 catalyst. ... 77
Figure 5.9: The comparison of hydrogen selectivity between catalyst reforming and PAC reforming using Ni0.35Mg2.65FeO4.5 catalyst. ... 78
Figure Appendix A. 1: GAT system in a cylindrical (a) a cross-sectional view (b) Top view of swirl
generator [Alexander Fridman, 2009]. ... 79 Figure Appendix A. 2: The vector in air flow rate (a). The injection of vector in 0° injected angle (b). The injection of vector in 30° injected angle ... 80 Figure Appendix A. 3: The simulate model in GAT system. ... 81 Figure Appendix B. 1: Composition of MGAD system (1) inner electrode (power cathode) (2) outer anodic electrode (ground) (3) wire attached to inner electrode (4) magnet (5) the arc motion between two
electrodes [S.P. Gangoli, et al., 2010]. ... 82 Figure Appendix B. 3: The simulate model in MGAD system. Diameter of injection is 2mm; diameter of outlet is 4mm; diameter and length of model is 30mm and 100mm, respectively; and Gap between
electrodes is 2mm; ... 83 Figure Appendix B. 3: The simulation of MGAD reactor. Flow velocity of z axial direction at the plasma region. ... 84 Figure Appendix B. 1: The interior structure of reduction furance. ... 85 Figure Appendix B. 2: The apperance constructure of reduction furance. ... 86
XI
Figure Appendix B. 3: 10 wt % Ni0.35Mg2.65FeO4.5/Al2O3 after hydrogen reduction at the hydrogen flow
XII
Nomenclature
P Input Power V Measuring Voltage I Measuring Current SH2 Selectivity of HydrogenSCO2 Selectivity of Carbon Dioxide
1
Chapter 1
Introduction
1.1 Background and Motivation
1.1.1 Hydrogen Energy Production
In recent years, environmental pollution caused by burning fossil fuels and the
depletion of fossil fuels have become serious problems that threaten the future of human
civilization. Therefore, there is an urgent need to develop clean energy alternatives.
Hydrogen energy possesses the highest energy content per unit weight (, i.e. 120.7 kJ/g)
and is considered to be one of the most environmentally friendly energy carriers.
Hydrogen can be used either directly, in a direct hydrogen combustion engine [C. M.
White, 2006; J. W. Heffel, 2003; S. O. Aknsul, 2004], or in other chemical processing
units, such as high-temperature solid oxide fuel cells (SOFC) [S. Park, 2000; De
Seungdoo, 2000; F. Zhao, 2005] and low-temperature proton exchange membrane fuel
cells (PEMFC) [A. C. Dupuis, 2011; V. Mehta, 2003; J. Kim, 1995]. In the SOFC system,
CO can also be used as a fuel because the system is operated at a high temperature
(700-900 C), which can easily break the strong carbon-oxygen bond. Thus, efficient production of hydrogen and CO is one of the key technologies in green energy
2
High-temperature Solid Oxide Fuel cell (SOFC) has become a potential alternative
to hydrocarbon fuel based electricity source, especially for decentralized power system,
mainly due to its high thermal efficiency as compared to traditional combustion engines.
In addition, carbon monoxide (CO) is a reactive gas in SOFC because of high
temperature and comparably lower bonding energy of CO, while it is considered a very
poisonous species for low-temperature proton exchange membrane FC (PEM-FC).
Ethanol (heating value of 28.865 (kJ/kg)) is a green energy which can be produced
unlimitedly from corns easily at low cost. Thus, the Center for Green Energy Technology
(CGET) of NCTU has started to devote to developing an integrated SOFC system using
ethanol as the fuel since 2008 (see Figure 1.1 for the typical test configuration).
Ethanol represents one kind of “carbon-neutral” species since it could be produced
from plants which convert sunlight and carbon dioxide through photo-synthesis reaction,
and releases equal amount of carbon dioxide back to the atmosphere in the later reactive
processes which generate energy. Thus, by using ethanol as the fuel source, the net amount
of CO2 in atmosphere remains the same and does not impact deteriorating global warming
[G. A. Deluga, 2004]. This leads to the idea of using ethanol as the source in producing
hydrogen, as is presented in this paper.
There are many methods of hydrogen production by reforming ethanol. They include
3
arc is found to be the most efficient one for hydrogen production [G. Petitpasa, 2007]. In
general, the catalyst has a better efficiency of hydrogen production than the plasma alone.
Application of plasma technologies on reforming of hydrocarbon fuels to generate H2 has
gradually attracted attention recently because of the following advantages of plasma.
These include fast ignition, the compatibility for a broad range of hydrocarbons, and the
high energetic density. However, by using plasma for reforming, H2 selectivity is generally
lower than that by using traditional catalytic reforming process [Barbara Pietruszka, 2004].
But by combining plasma and catalyst, one can possibly boost the hydrogen production
[Nongnuch Rueangjitt, 2011; Yu Chao, 2008].
1.1.2 Overview of Reforming Technologies
Hydrogen production from ethanol steam reforming which is an endothermic
reaction. It requires much heat to maintain the system temperature for thermal
equilibrium. Thus, traditional method to produce hydrogen needs power to generate heat
and needs space to provide heat generator to process endothermic steam reforming.
Moreover, the reaction from ethanol to hydrogen needs catalyst to assist reaction
pathways perform. Followed are introduction to traditional reforming technologies.
There are many reaction pathways which include a number of dehydrogenation and
4
On one hand, the traditional method derived acetaldehyde from dehydrogenation of
ethanol such as (2), and then methane and carbon monoxide will be produced from
decarboxylation (3). Finally, it will produce hydrogen and carbon monoxide from
methane steam reforming reaction.
CH3CH2OH ↔ CH3CHO + H2 (2)
CH3CHO ↔ CH4 + CO (3)
CH4 + H2O ↔ CO + 3H2 (4)
On the other hand, ethylene will be produced from ethanol dehydration reaction (5), followed by dehydrogenation reaction (6) may poisoning in carbon accumulated which caused by loss of active. As mentioned above, ethanol steam reforming should avoid it [Vizcaino et al., 2007]. C H3C H2OH ↔ C2H4 + H2O ( 5 )
C2H4 ↔ 2 C + 2 H2 ( 6 )
C2H4 + H2O ↔ CO + 4H2 (7)
C O + H2O ↔ CO2 + H2 ( 8 ) In order to increase production of hydrogen, WGS (water gas shift) often use
currently, as shown as (8). Thus, catalyst plays an important role in ethanol steam
reforming. The catalyst can be divided into noble metal and non-noble metal, related
5
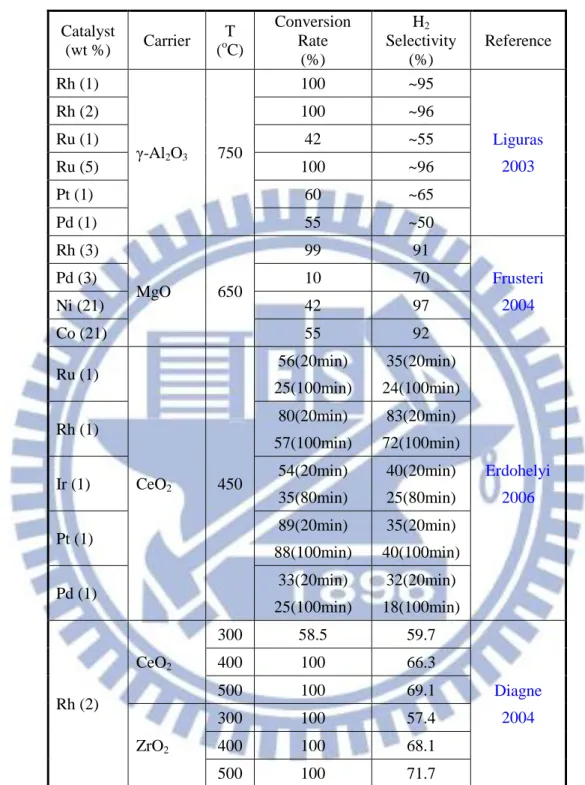
1. Noble metal catalyst
The advantage of noel metal catalyst is highly active, such as Ruthenium (Ru),
Rhodium (Rh), Palladium (Pd) and Platinum (Pt). Table 1.1 shows properties of ethanol
steam reforming with different noble metal catalysts.
2. Non-noble metal catalyst
Some non-noble metals can also be used as hydrogen reforming catalyst which
include nickel (Ni), copper (Cu), and zinc (Zn) and cobalt (Co). Table 1.2 shows detailed
performers of using different non-noble metal catalysts in ethanol steam reforming. In
Table 1.2, the result of using nickel assist reforming can be viewed as the most effective
among others; the ethanol in the reforming process easily breaks the carbon bond and
produce hydrogen. Furthermore, nickel is not only the most effective catalyst but also the
easiest and cheapest to prepare among others which is the reason that nickel is the most
common catalyst of ethanol steam reforming.
In comprehensive surveys tender that noble catalyst (Rh) with high efficiency and
non-noble catalyst (Ni0.35Mg2.65FeO0.45) with low-priced respectively is used to hydrogen
production using ethanol as reforming fuels.
Ethanol fuel is first steamed and then flows through a catalytic reformer, which is
made of rare metal oxide consisting of Ce or Ir. Although tests at the CGET of NCTU and
6
(>100%, excluding the hydrogen coming from water vapor), it suffers some potential
disadvantages, which include: 1) very high cost with noble catalyst (Rh) because of the
rarity, and 2) lower efficiency with non-noble catalyst (Ni0.35Mg2.65FeO0.45) 3) short
durability of the catalyst. These factors may eventually preclude the ethanol SOFC system
from real applications. Thus, how to resolve the above major drawbacks of the catalytic
reformer or find an alternative reformer has played an important role among one of the top
priorities of the teams. In this study, we choose to find an alternative reformer, plasma or
plasma assisted catalyst reformer, which is discussed later.
1.1.3 Plasma Reforming Technologies
Plasma is an ionized gas, which is generated by lots of reactor including corona,
spark, glow, gliding arc discharge (GA), microwave discharge, and dielectric barrier
discharge (DBD). The reforming process of hydrogen production by plasma technologies
has been researched with interest for applications because plasma has following
characteristics: fast ignition, the compatibility for a broad range of hydrocarbons, the high
energetic density.
Plasma state is usually classified as the high temperature (or thermal) plasma and
the cold (or non-thermal or non-equilibrium) plasma depending on energy level,
temperature and electronic density. The most challenge to use plasma reforming process
7
species are thermal equilibrium thus the temperature can reached 10,000-100,000K,
causing the reaction in thermal plasma lacks of chemical reaction selectivity. Those two
characters results in very little control over chemical processes inside plasma.
Non-thermal plasmas are non-equilibrium in gas temperature and electro temperature
and low power requirement and capable to induce physical and chemical reactions within
gases at relatively low temperatures. Combining these characters, non-thermal plasma
has been applied for fuel gas treatment and has been considered very promising for
organic synthesis. A review paper [G. Petipas, et al., 2007], which has been published,
shows the thermal plasma assisted reformers is lower yield than non-thermal (figure 1.3).
In this paper, it refer to various types of non-thermal plasma reforming technologies,
which are presented in the Figure 1.3 and point out the most efficiency plasma sources
are gliding arc (GA) by A. Fridman[A. Fridman, et al., 2002. Furthermore, in our group,
we have set up a gliding arc reforming system and investigation on the gliding arc (GA)
has been imperative to act. Therefore, this study focuses on gliding arc plasma for
hydrogen production.
However, the H2 selectivity of reforming with plasma is generally lower than with
the traditional catalytic reforming process even though using non-thermal plasma assisted
reforming [B. Pietruzk, et al., 2004]. Recently, a new technology has been developed,
8
catalysis. The PAC can be applied in hydrocarbon reforming for hydrogen production
and gaseous pollutant removal. For the former application has been published in one
review paper [M.B. Chang, et al., 2008]. For the latter application has been published in
two review papers[H.H. Ki, et al., 2004; J.V. Durme, et al., 2008].
For the environmental improvement, hydrogen reforming technologies are very
important. Furthermore, using PAC to reform ethanol can combine the reforming
advantages of using plasma-alone and using catalyst-alone, in other words PAC
reforming has such advantages: rapid startup, fast response time, and fuel flexibility.
Therefore, we expect PAC with gliding arc could increase the durability of the catalyst,
reforming performance and H2 selectivity, and turn into real application.
1.1.5 Hydrocarbon Reforming Fuel
Nowadays PAC reforming commonly uses methane as reforming fuel on the reason
of methane can easily obtain from fossil fuels. However, human-caused global warming is
one of the greatest and most urgent challenges that human need to deal with it on earth
today. The main culprit is the enormous amount of the potent greenhouse gas carbon
dioxide (CO2) released into the atmosphere by burning fossil fuels. So far, most of
methane was made by fossil fuels (over 80%). In other words, using methane to generate
hydrogen as clean fuel could still generate extra carbon dioxide. However, ethanol
9
convert sunlight and carbon dioxide into glucose and water through photosynthesis and
release an equal amount of carbon dioxide back to the atmosphere through the subsequent
reactive processes that generate energy (Figure 1.5). Thus, when ethanol is used as a fuel
source, the net amount of CO2 in the atmosphere remains the same, and the process does
not essentially affect global warming [L. D. Schmidt, et al., 2004]. This leads to the idea
of using ethanol as the source to produce hydrogen, which is the major objective of this
paper.
Hydrogen is difficult to store and transport. Nevertheless,methane and ethanol can
solve these problems. Therefore, they can be chosen as the hydrogen carrier for storage
and transportation. In comparison of methane and ethanol, the energy storage ability for
ethanol is better than methane. Besides, ethanol can exist on the earth in the form of liquid
without extra procedure which is much safer and easier to store and transport than methane.
On the basis of the advantages of using ethanol as reforming fuel, we shall emphasize on
ethanol reforming.
1.1.6 Literature Survey
Since we are interested in developing a PAC system to reform ethanol, all the
following literature surveys are restricted along this line. Table 1.3 and Table 1.4
10
respectively, about experimental parameters and efficiency. Several discussions later are
based on the contents of this table.
Form literature surveys, plasma power input could be divided into AC power supply
[Y. Kusano et al., 2008, Z. Bo et al., 2008], DC power supply[A. Fridman et al., 2005],
and pulse power supply [H. Shiki et al., 2008]. Table 1.5 summarizes several power
input parameters for plasma reactor, and more details are presented in Table 1.3. In the
plasma system, gliding arc and GAT, power input could affect plasma characters
dramatically, which could also cause synergistic effects on PAC system to change
reforming results. However, there has been no systematic work in seriously studying the
effects of plasma power to discharge for the same gliding arc plasma discharge.
In the plasma diagnostics parts, it is generally very difficult to measure the
discharge properties inside the discharged volume. Thus, most measurements were made
out of the quartz region. They include gas temperature measurements using a
thermocouple [Babayan et al., 2001; Wang et al., 2003; Li et al., 2006; Zhu et al., 2005],
the product gas components were analysis using gas chromatograph (figure 1.6)[Y. C.
Yang et al., 2009; Y. N. Chun et al., 2008; M. B. Chang., et al., 2008], and discharge arc
column motion using high speed camera [A. Fridman et al., 2000; Z. Bo et al., 2007].
From the previous part of survey, the experimental parameters and conditions which
11
literature survey some parameters that described the performance of reforming hydrogen
have been summarized in Chapter 2.2.3 (Definition of several Performance Parameters).
From literature survey, the conversion rate ranges is 62.6% - 87 % in [L. Bromberg
et al., 2006; A. Fridman et al., 2002, 2005; Y. N. Chun et al., 2008, 2008; M. B. Chang et al., 2008; G. Petipas et al., 2007]. The efficiency range from 35% - 75.81% [L. Bromberg
et al., 2006; A. Fridman et al., 2002, 2005; Y. N. Chun et al., 2008, 2008; M. B. Chang et al., 2008; G. Petipas et al., 2007] (Table 1.3).
1.2 Specific Objectives of this Thesis
Motivated by the technical advantages and tremendous advantages of PAC
reforming with gliding arc plasma with different catalyst (Rh) and (Ni0.35Mg2.65FeO4.5)
development in this field, the objectives are summarized as followed:
Through various C/O ratios and air flow rates, confirm the efficiency of the gliding arc (GA) reforming ethanol.
To confirm the efficiency of the noble catalyst (Rh) reforming ethanol by adjusting various temperatures and air flow rates.
To prove the efficiency of the PAC system with GA plasma and Rh catalyst is higher than Rh catalyst alone reforming ethanol.
12
To learn how to reconstruct the non-noble catalyst (Ni0.35Mg2.65FeO4.5) and
confirm the efficiency of the gliding arc (GA) reforming ethanol through
various temperatures.
To construct the PAC system combined the gliding arc plasma with Ni0.35Mg2.65FeO4.5 catalyst.
To verify the efficiency of PAC system with GA plasma and Ni0.35Mg2.65FeO4.5
13
Chapter 2
Theoretical Method
2.1 Theoretical Analysis
2.1.1 The Physical Phenomenon of Gliding-Arc
The gliding arc, a discharge contains thermal and non-thermal properties, could
effortlessly by two diverging knife shaped electrodes with high voltage and input power.
The gliding arc starts at the smallest gap between two electrodes when the electrode field
reaches breakdown conditions, for stance, an gliding arc reactor with the shortest gap
about 3mm between electrodes in the atmosphere pressure, needs 10 kV to breakdown
the gas, air, forming arc. And then the flow along the electrodes push the arc until the
electron density could not maintain the plasma caused gliding arc is split. Finally, the
next cycle starts immediately after the breakdown conditions reach. A typical gliding arc
reactor has been published [A. Fridman et al., 2002]. Figure2.1 is the gliding arc reactor
and the electric scheme with DC power supply and gas inlet. And, it is very important to
clearly see and measure the fluctuation of current and voltage by gliding arc production
in researching plasma physical phenomenon. Investigation on the electric measurement
14
Figure 2.2 is arc current and voltage waveform with ac power supply and shows the arc
ignition with rising instantly in the current waveform of arc breakdown.
The gliding arc has been called “intermediate” plasma, having both thermal
plasma and non-thermal plasma character, which offers greater energy density to perform
hydrogen reforming with chemical selectivity.
2.1.2 Chemical Reaction Paths of Ethanol Reforming
Nowadays, hydrogen production in the industrial procedure is ‘‘steam reforming’’
which is widely used all over the world, however the main drawback of this procedure is
that it needs an external heat source to support reforming reaction. Furthermore, there was
another hydrogen procedure, partial oxidation had been developed.
In partial oxidation reaction, ethanol reacting with insufficient oxygen generates a
slightly endothermic reaction to reform ethanol into hydrogen. However, using this
method lowers the performance and brings soot left caused poison of catalyst [A. Fridman
et al.,2004].
For the sake of solving these problems, combine steam reforming, water gas shift
reaction and partial oxidation. Ethanol can be reformed in an ‘‘auto-thermal’’[J.H. Wang
et al.,2009] process kept both advantages. The chemical reaction showed as followed: Steam Reforming:
15
Partial Oxidation:
C2H5OH(g) + 1⁄2O2 2CO + 3H2, ΔH298 = 12.9 kJ/mol
Water gas shift (WGS):
CO + H2O(g) CO2 + H2, ΔH298 = -40 kJ/mol
Auto-thermal Reforming:
C2H5OH(g) + 2H2O(g) + 1⁄2O2 2CO2 + 5H2, ΔH298 = -69.4 kJ/mol
2.1.3 Definition of Several Performance Parameters
Conversion rate and selectivity are three important factors to represent the
reforming performance. Each of them represents different meanings about reforming
product gas composition and formula to calculate the parameter is listed below. The fuel
conversion rate means how much percentage of fuel that were injected into the PAC
system have been reformed into other kinds of product; the hydrogen selectivity means
how much percentage of hydrogen were formed among all the formed product that
contains H atoms. (Similarly, CO selectivity and CO2 selectivity represent same idea, if
there were other formed product gases); the reformer thermal efficiency represents the
proportion of the lower heating value (LHV) of formed hydrogen to the input energy,
that is the summation of the electrical energy of the plasma and the LHV of the
hydrocarbon injected [G. Petitpas et al., 2009].
16
2 2
Amount of H atoms in the formed H Selectivity (H )
Amount of H atoms in the formed product
(9)
[Input fuel] - [Output fuel] Fuel Conversion Rate ( )
[Input fuel]
(10)
2 produced 2
(H + CO) x LHV(H )
Efficiency =
17
Chapter 3
Experimental Methods
3.1 Overview of Experimental Setup
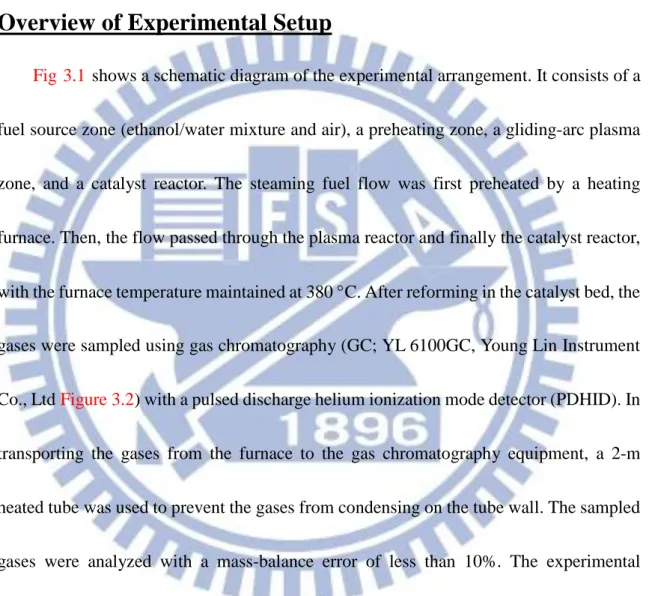
Fig 3.1 shows a schematic diagram of the experimental arrangement. It consists of a
fuel source zone (ethanol/water mixture and air), a preheating zone, a gliding-arc plasma
zone, and a catalyst reactor. The steaming fuel flow was first preheated by a heating
furnace. Then, the flow passed through the plasma reactor and finally the catalyst reactor,
with the furnace temperature maintained at 380 C. After reforming in the catalyst bed, the gases were sampled using gas chromatography (GC; YL 6100GC, Young Lin Instrument
Co., Ltd Figure 3.2) with a pulsed discharge helium ionization mode detector (PDHID). In
transporting the gases from the furnace to the gas chromatography equipment, a 2-m
heated tube was used to prevent the gases from condensing on the tube wall. The sampled
gases were analyzed with a mass-balance error of less than 10%. The experimental
configurations and operating conditions of each subsystem are described in detail in the
18
3.2 Experimental Facilities
In this section, the contents particularly give an account for experimental facilities,
including plasma reactor which is divided into gliding-arc and magnetic gliding-arc
discharge; ac power supply; fuel feeding; and catalyst preparation.
3.2.1 Plasma Reactor
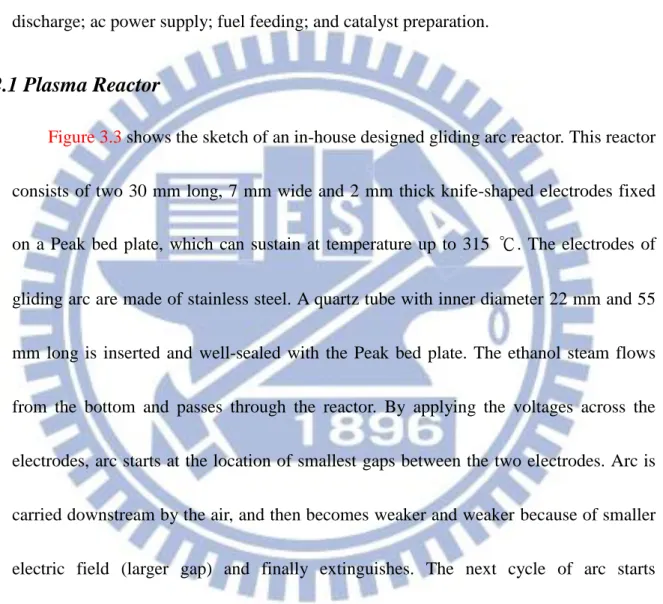
Figure 3.3 shows the sketch of an in-house designed gliding arc reactor. This reactor
consists of two 30 mm long, 7 mm wide and 2 mm thick knife-shaped electrodes fixed
on a Peak bed plate, which can sustain at temperature up to 315 ℃. The electrodes of
gliding arc are made of stainless steel. A quartz tube with inner diameter 22 mm and 55
mm long is inserted and well-sealed with the Peak bed plate. The ethanol steam flows
from the bottom and passes through the reactor. By applying the voltages across the
electrodes, arc starts at the location of smallest gaps between the two electrodes. Arc is
carried downstream by the air, and then becomes weaker and weaker because of smaller
electric field (larger gap) and finally extinguishes. The next cycle of arc starts
immediately after the breakdown condition reached at the throat.
3.2.2 AC Power Supply and Pulse Generator
The power supply (PVM500 plasma driver, Information Unlimited Inc. Figure 3.4)
19
voltage control ranges from zero to maximum 20 kV peak-to-peak. And frequency
ranges from 20-70 kHz. Though, this power supply is relatively unstable compare to
others, its price was low ($449.95). In the next chapter, the influence of different output
power magnitude on electrical character and reforming efficiency was studied in detail.
3.2.3 Fuel Feeding and Heating System
Ethanol and water, supplied by a liquid pump (930d-1428, Young Lin Instrument CO.,
Ltd., 0.0005-1.0 SLM, Figure 3.5), were mixed with dry air from a compressor controlled
by a mass flow controller (Multi-gas MFC, MC-100SCCM-D, Alicat Scientific Inc., max.
100 sccm, Figure 3.5). The gases were injected into the preheating zone (to raise the
temperature) through an oil injector that was taken from a car engine and controlled by a
solenoid valve (Fuel Injection, Mitsubishi Eclipe, figure 3.6). The solenoid valve was
operated with a voltage of 12 volts, and the duty cycle could be adjusted to control the
valve opening time. This injector was adjusted to maximize the vaporization of water and
ethanol droplets by varying the duty cycle of the input driving voltage. Through this setup,
one can control experimental parameters such as, the C/O mole ratio, air flow rate, and
ethanol/water mole ratio. C/O (mole) ratio represents the ratio of the moles of C in the
inflowing ethanol to the moles of O in the inflowing mixture that consisted of ethanol,
water and air. High-purity ethanol (99%) was used as the fuel and was mixed together
20
The heating system consists of two heating furnaces that were heated at specific
temperatures to control the gasification and catalyst reaction (You & Me Inc., Figure
3.7).
3.2.4 Catalyst Preparation
Thanks to professor Lee, Department of Applied Chemistry, NCTU for sharing the
chemicals and skills. All the catalyst setup procedures are learned from professor Lee’s
laboratory.
3.2.4.1 Rh/CeO
2/Al
2O
3The reforming catalyst beads were prepared using 5% Rh/CeO2/Al2O3. Initially, 1 g
of porous Al2O3 beads to be used as carriers were ground to small pieces, with a volume
in the range of 1.00-1.41 mm3. These were subsequently mixed with an ethanol solution
containing 0.125 g of dissolved Ce(NO3)3 and heated to 50 C to evaporate the ethanol.
Thereafter, the Al2O3 carriers loaded with Ce(NO3)3 were sintered at 300 C for 5 hours.
In addition, 0.01 g of RhCl3 in an ethanol solution was prepared and mixed with 10 %
Ce-Al2O3 after sintering. Following the same procedure for evaporating the ethanol, the
10% Ce-Al2O3 loaded with 5% RhCl3 was placed into the furnace at 600 C and 200
sccm of hydrogen was pumped for 6 hours for the reduction. In addition, 1 g of porous
Al2O3 loaded with 5% Rh/CeO2 could be produced using the above procedure. The
21
3.2.4.2 Ni
0.35Mg
2.65FeO
4.5/Al
2O
3The preparation for Ni/Mg/Al catalyst is done by coprecipitation method. First, the
mass of Ni(NO3)3, Mg(NO3)2, and Fe(NO3)3, which respectively are 0.2139 g, 1.4485 g,
and 0.8484 g, is changed the PH from acidity to 10.5 by titration using the alkaline liquid
mixed the NaOH of 6 g with the Na2CO3 0.99375 g. And then dry the product made by
above the elements to form the important admixture, Ni0.35Mg2.65FeO4.5. To pestle the
admixture with 95 Vol.% ethanol and let the admixture can be easily coat in the carrier,
Al2O3, in the specific ratio of mass weight of Ni0.35Mg2.65FeO4.5/Al2O3 is 0.1 . Finally, the
reduction furance, which specially designed to solve the hydrogen waste by traditional
reduction method, is used to reduce the 10 wt% Ni0.35Mg2.65FeO4.5/Al2O3 at 500 ℃ furance
keeping 30 min (figure 3.9). The figure 3.9 is simple flowchart for preparing this
catalyst.
3.3 Experimental Instrumentation
In the plasma and plasma assisted catalyst reforming, the power supply (PVM500
plasma driver) system which has the voltage control ranging from zero to maximum 20 kV
peak-to-peak at a frequency of 20 kHz. Meanwhile, we use the High Voltage Probe (Fig
3.10) to measure plasma voltage and Rogowski coil (Fig 3.11) to measure the current
respectively. The measured voltage and current are recorded using an oscilloscope
22
assisted catalytic system are introduced in turn. After reforming process, the productions
are measured and sampled by gas chromatography (Figure 3.2).
3.4 Experimental Procedures
3.4.1 Catalytic Reforming
In catalytic reforming, the steaming fuel was first preheated by a heating furnace.
Then, the flow, including air, ethanol, and DI water, passed through catalysis bed. Finally,
the gases were sampled using gas chromatography.
3.4.2 Plasma Reforming
In plasma reforming, the ethanol mixed water was injected by a liquid pump and
preheated by a heating furnace respectively. After the fuel consisted of air and ethanol
mixed water went through the plasma zone, we used the chromatography to sample the
productive gases.
3.4.3 Plasma Assisted Catalytic Reforming
In Plasma Assisted Catalytic Reforming, we used the air pump and liquid pump to
inject the air and ethanol mixed water respectively. Then, the fuel went through the
plasma zone and finally the catalyst reactor. The productive gases from reforming were
23
3.5 Test Conditions
In this study, air flow rates were controlled and maintained in the range of 0.5-2.0 slm,
the inflow C/O ratio was fixed at 0.7 unless otherwise specified, and the molar ratio of
ethanol to Deionized water (DI) water was kept at 1:3 (the flow rate of ethanol/DI water
mixture was 0.57-1.7 sccm). Gasification temperature in the preheat zone and the furnace
temperature for the catalyst bed were kept at 160 C and 230 C, respectively. The power input for the gliding-arc device was fixed as 223 W throughout the study.
The test conditions for the gliding arc plasma, catalyst (Rh/CeO2/Al2O3), and PAC
with gliding arc reforming are summarized in table 3.1. And the test conditions for
24
Chapter 4
Characterization of Gliding Arc Plasma
4.1Visualization
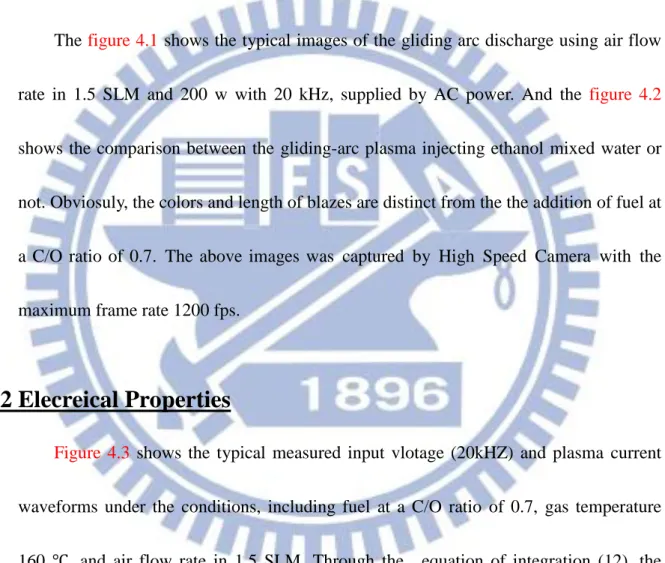
The figure 4.1 shows the typical images of the gliding arc discharge using air flow
rate in 1.5 SLM and 200 w with 20 kHz, supplied by AC power. And the figure 4.2
shows the comparison between the gliding-arc plasma injecting ethanol mixed water or
not. Obviosuly, the colors and length of blazes are distinct from the the addition of fuel at
a C/O ratio of 0.7. The above images was captured by High Speed Camera with the
maximum frame rate 1200 fps.
4.2 Elecreical Properties
Figure 4.3 shows the typical measured input vlotage (20kHZ) and plasma current
waveforms under the conditions, including fuel at a C/O ratio of 0.7, gas temperature
160 ℃, and air flow rate in 1.5 SLM. Through the equation of integration (12), the obtainable plasma absorption power is 223 W.
measured time (I V ) Absorption Power = T n n
( 1 2 )25
Chapter 5
Results and Discussion
5.1 Reforming with Gliding Arc Plasma
5.1.1 Effect of C/O ratio
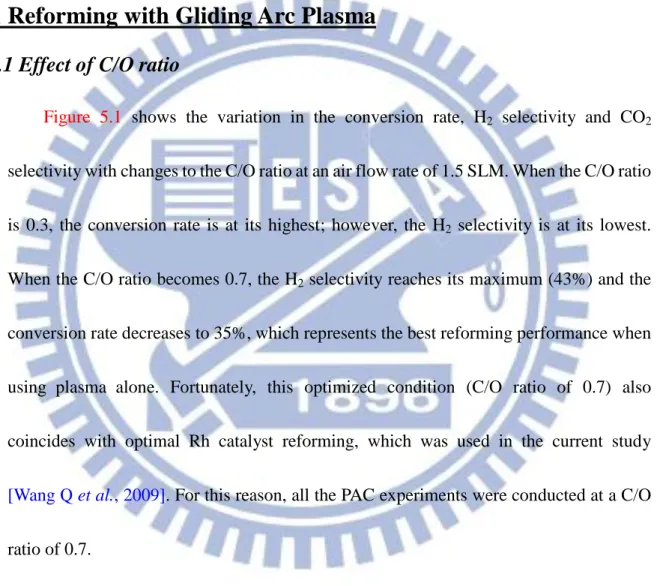
Figure 5.1 shows the variation in the conversion rate, H2 selectivity and CO2
selectivity with changes to the C/O ratio at an air flow rate of 1.5 SLM. When the C/O ratio
is 0.3, the conversion rate is at its highest; however, the H2 selectivity is at its lowest.
When the C/O ratio becomes 0.7, the H2 selectivity reaches its maximum (43%) and the
conversion rate decreases to 35%, which represents the best reforming performance when
using plasma alone. Fortunately, this optimized condition (C/O ratio of 0.7) also
coincides with optimal Rh catalyst reforming, which was used in the current study
[Wang Q et al., 2009]. For this reason, all the PAC experiments were conducted at a C/O
ratio of 0.7.
5.1.2 Effect of Gas Flow Rate
Figure 5.2 shows the selectivity of hydrogen and carbon dioxide and the fuel
conversion rate as functions of the air flow rate. The fuel conversion rate is generally less
26
decrease in the fuel conversion rate at 2.0 SLM can be attributed to the short residence
time in the plasma reactor because of the high gas flow rate. In addition, the hydrogen
selectivity and the fuel conversion rate both peak at an air flow rate of 1.5 SLM [Rueangjitt
N. et al., 2011, Chernyak V.Y. et al., 2008].
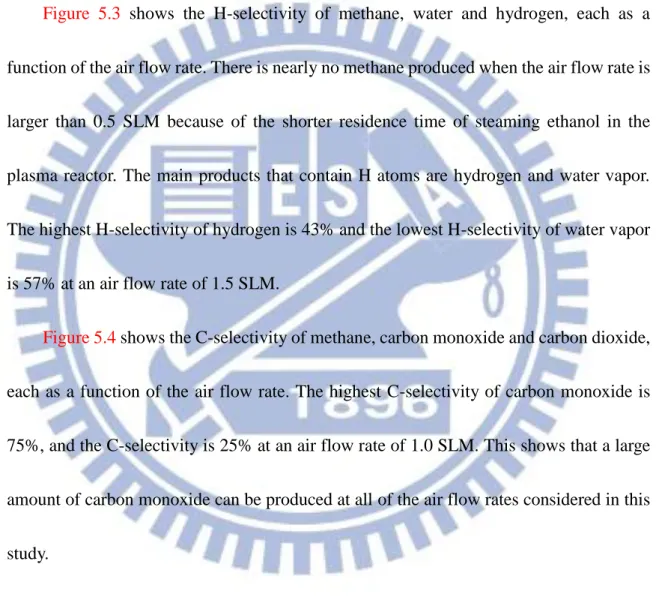
Figure 5.3 shows the H-selectivity of methane, water and hydrogen, each as a
function of the air flow rate. There is nearly no methane produced when the air flow rate is
larger than 0.5 SLM because of the shorter residence time of steaming ethanol in the
plasma reactor. The main products that contain H atoms are hydrogen and water vapor.
The highest H-selectivity of hydrogen is 43% and the lowest H-selectivity of water vapor
is 57% at an air flow rate of 1.5 SLM.
Figure 5.4 shows the C-selectivity of methane, carbon monoxide and carbon dioxide,
each as a function of the air flow rate. The highest C-selectivity of carbon monoxide is
75%, and the C-selectivity is 25% at an air flow rate of 1.0 SLM. This shows that a large
amount of carbon monoxide can be produced at all of the air flow rates considered in this
study.
5.2 Catalyst Reforming
In this section, investigation on conversion rates, hydrogen and carbon dioxide
selectivity of catalyst reforming is divided into two parts to discuss the results. First part
27
at different air flow rates (0.5-2.0 SLM). And the second part is the catalyst reforming
with Ni0.35Mg2.65FeO4.5/Al2O3 to confirm the selectivity and conversion at different
temperatures (200-400 ℃).
5.2.1 Rh
Figure 5.5 shows the conversion rates, hydrogen selectivity and carbon dioxide
selectivity at different air flow rates with the C/O ratio maintained at 0.7. At an air flow
rate of 1.0 SLM, Hydrogen selectivity (SH2) is found to be more than 100 % and the
conversion rate is nearly 100% (98%). However, when the flow rate increases to 1.5
SLM or 2 SLM, the reforming efficiency becomes worse (~70%). This can be attributed
to the shorter residence time during which the catalyst cannot thoroughly react with the
gases. However, at an air flow rate of 0.5 SLM, even though the residence time is the
longest, the catalyst reforming performance is not better than at air flow rates of 1.0 or
1.5 SLM. This results from the catalyst reforming becoming favorable to the complete
oxidation reaction (C2H5OH + 3O2 → 2CO2 + 3H2O) [Wang Q et al., 2009], which
prevents the production of hydrogen. The above observations show that higher reforming
efficiencies can be obtained only at specific air flow rates using the catalyst bed with 5%
Rh/CeO2/Al2O3, which necessitates a remedial approach for extending the applicability of
28
5.2.2 Ni0.35Mg2.65FeO4.5/Al
2O
3Figure 5.6 shows the conversion rate, hydrogen selectivity and car dioxide
selectivity at different temperatures. Obviously, the hydrogen selectivity and ethanol
conversion rates of Ni0.35Mg2.65FeO4.5/Al2O3 catalyst (non-noble) are much lower than
the Rh catalyst (noble). In the section 1.1.2 has introduced that the efficiency of noble
catalyst almost higher than non-noble catalyst. Therefore, it is no surprise to the results.
Figure 5.6 also shows the hydrogen and selectivity dropped down with adjusting
decreasingly catalyst temperatures. However, the catalyst temperatures stand for the
energy provided. Furthermore, the effect of catalyst temperature has been presented at
the IJHE paper [M. Li and et al., 2010]. The catalyst is much more inefficient at
water-gas-shift chemical reaction.
5.3 Plasma Assisted Catalyst (PAC) Reforming
In this section, investigation on hydrogen and carbon dioxide selectivity and
conversion rates of PAC reforming is divided into two parts to discuss the results. Owing
to compare the catalyst reforming with PAC reforming, the test parameters of catalyst
needed to be the same. Therefore, first part is the PAC reforming with Rh noble catalyst
and gliding arc plasma to confirm the selectivity and conversion rates at different air
29
Ni0.35Mg2.65FeO4.5/Al2O3 and gliding arc plasma to confirm phenomenon at the
temperatures (400 ℃) which arise the highest selectivity and conversion rate in catalyst reforming.
5.3.1 PAC reforming with Rh catalyst
Figure 5.7 shows the conversion rates, hydrogen selectivity and carbon dioxide
selectivity at different air flow rates for different cases of PAC. At an air flow rate of 0.5
SLM, the hydrogen selectivity and the conversion rate of PAC are 72% and 98%,
respectively, which are lower than those for the pure catalyst reforming. This could be
attributed to the longer residence time in the plasma reactor at the lowest air flow rate,
which produces smaller molecules such as C2H4 and C2H6 (see Table 5.1) that are
measured by gas chromatography, resulting in smaller hydrogen selectivity.
Notably, Figure 5.7 also shows that the fuel conversion rate and hydrogen selectivity
for the PAC case are high, at 100% and 111.2%, respectively, at an air flow rate of 1.5 SLM.
Without the addition of plasma, the hydrogen selectivity is very low (~70%) at this air
flow rate because of the shorter residence time, as explained earlier and also in the
literature [Barbara Pietruszka, 2004, Yu Chao, 2008]. FromFigure 5.2, we have learned
that the hydrogen selectivity the highest with plasma alone at this air flow rate.
30
CO, which is able to assist the catalyst reforming through the water-gas-shift reaction (CO
+ H2O → CO2 + H2), which was also reported in[Wang Q et al., 2009].
5.3.2 PAC reforming with Ni
0.35Mg
2.65FeO
4.5Catalyst
If the hydrogen selectivity and conversion rates of non-noble catalyst could be
raised to close the noble catalyst, the economic benefit would be elevatory causing the
reforming cost dropped down rapidly. However, the results in figure 5.8 and figure 5.9
show that, even though the PAC system with Ni0.35Mg2.65FeO4.5 catalyst could improve
the hydrogen selectivity and conversion rate, the outcome is much worse than with the
Rh catalyst. The reason perhaps is that this catalyst has the inefficiently water-gas-shift
chemical reaction with gliding arc generated much H2O (figure 5.3). Therefore, The
suggestion, decreased the ratio of ethanol mixed water and inject lesser DI water to PAC
reforming with gliding arc and Ni0.35Mg2.65FeO4.5 catalyst, should be published for the
31
Chapter 6
Conclusion and Future Work
6.1 Conclusion
In this study, ethanol steam flow is reformed using a gliding-arc plasma-assisted
catalytic system with air flow rates in the range of 0.5-2.0 SLM. The results show that,
with the catalyst alone, a 100% conversion rate and a maximum of 115% hydrogen
selectivity were obtained at a C/O ratio of 0.7 with an air flow rate of 1.0 SLM. However,
the hydrogen selectivity decreases rapidly to 95%, 70% and 68%, respectively, at air flow
rates of 0.5, 1.5 and 2.0 SLM. The former can be attributed to the longer residence time in
the catalytic bed, causing a higher temperature that favors a complete oxidation reaction
(C2H5OH + 3O2 → 2CO2 + 3H2O). The latter two cases can be attributed to the shorter
residence time, which is not enough time for a complete catalytic reaction to occur. With
the addition of the gliding-arc plasma, the hydrogen selectivity reaches 113% and 111.2%
at air flow rates of 1.0 and 1.5 SLM, respectively. This shows that, with the use of the
gliding-arc plasma prior to the catalyst, a very high hydrogen selectivity (>110%) can be
obtained at air flow rates of 1.0 or 1.5 SLM with the current experimental setup. However,
32
70% and is nearly the same as that for catalyst reforming. This is attributed to the shorter
residence time in the plasma reactor, resulting in no assistance from the gliding arc. Thus,
we can conclude that a very high reforming efficiency can be obtained at air flow rates less
than 2.0 SLM using the PAC system developed in the current study. In this study, we have
learned that the residence time within the plasma reactor and the catalyst reactor is a key
parameter that needs to be controlled properly to obtain good hydrogen selectivity for
ethanol steam reforming. For better control, an improved system adapted from a tornado
gliding arc (TGA) [Kalra C.S., Fridman A., 2003, 2005] is currently being developed in
our group and will be reported in the near future.
In the Ni0.35Mg2.65FeO4.5 Catalyst Reforming, the highest hydrogen selectivity
(~55%) and conversion rate are close the 100% at temperature 400 ℃ and drop down rapidly with decreasing the temperature. However, the PAC with Ni0.35Mg2.65FeO4.5
Catalyst can improve the selectivity of catalyst alone reforming to 75%. Even though the
selectivity could be raised, the conversion rate drops down to 73%. The reason maybe
the plasma generates a lot of H2O but the catalyst is inefficient at water-gas-shift (WGS)
chemical reaction equation. Hence, to change the C/O ratio and ethanol mixed water with
different from 1:3 is a possible to solve the worse WGS reaction in Ni0.35Mg2.65FeO4.5
33
6.2 Recommendations for Future Work
i. To adjust the temperatures in PAC system with Rh catalyst for much better
reforming selectivity.
ii. To change the ratio of water mixed ethanol to solve the Ni0.35Mg2.65FeO4.5
catalyst is worse in WGS reaction.
iii. To design the MGAD for the shorter residence time of PAC with gliding at
higher air flow rate. The detailed design and simulate has been done and
showed in Appendix B.
iv. To raise the catalyst reforming temperature for confirm the highest selectivity
Ni0.35Mg2.65FeO4.5.
v. To exchange the sequence between plasma and catalyst in PAC system for
investigation on the variation.
vi. To combine the plasma with other non-noble catalyst, which has better
selectivity and simultaneously is low cost.
vii. To investigate that the effect of gaps between two electrodes in gliding arc
plasma for hydrogen production.
viii. To analyze the chemical reaction in plasma alone, catalyst alone, and PAC
34
References
1. Akansu1 S.O., Dulger Z., Kahraman N., Nejat Veziroglu T. “Internal combustion
engines fueled by natural gas—hydrogen mixtures”, International Journal of Hydrogen
Energy, 29, pp. 1527-1539, 2004.
2. Barbara Pietruszka, Moritz Heintze, “Methane conversion at low temperature: the
combined application of catalysis and non-equilibrium plasma,” Catalysis Today, 90, pp.
151-158, 2004
3. Batista, M.S., Santos, R.K.S., Assaf, E.M., Assaf, J.M., and Ticianelli, E.A., ‘‘High
efficiency steam reforming of ethanol by cobalt-based catalysts’’, Journal of Power
Sources, 134, pp. 27-32, 2004.
4. Bo Z., Yan J.H., Li X.D., Chi Y., and Cen K.F. ‘‘Scale-up analysis and development of gliding arc discharge facility for volatile organic compounds decomposition’’, Journal of
Hazardous Material, 155, pp. 494-501, 2004.
5. Bo Z., Yan J.H., Li X.D., Chi Y., Cheron B., Cen K.F. ‘‘The dependence of gliding are
gas discharge characteristics on reactor geometrical configuration’’, Plasma Chemistry
and Plasma Processing, 27, pp. 691-700, 2007.
6. Bo, Z., Yan J., Li X.D., Chi Y., Cen K. ‘‘Plasma assisted dry methane reforming using
35
Hydrogen Energy, 33, pp. 5545-5553, 2008.
7. Bromberg L., Cohn D.R., Rabinovich A., Alexeev N., Samokhin A., Hadidi K., Palaia J.,
N. Margarit-Bel, ‘‘Onboard Plasmatron Hydrogen Production for Improved Vehicles’’,
PSFC JA-06-3, 2006.
8. Cavallaro S., Chiodo V., Freni S., Mondello N., Frusteri F. ‘‘Performance of Rh/Al2O3
catalyst in the steam reforming of ethanol: H2 production for MCFC’’, Applied
Catalysis A: General, 249, pp. 119-128, 2003.
9. Chao Y., Huang C. T., Chang M. B., Lee H. M. “Hydrogen production via partial
oxidation of methane with plasma-assisted catalysis,” International Journal of Hydrogen
Energy, 33, pp 664-671, 2008.
10. Chao Y., Huang C.T., Lee H.M., and Chang M.B. ‘‘Hydrogen production via partial
oxidation of methane with plasma-assisted catalysis’’, International Journal of Hydrogen
Energy,33, pp. 644-671, 2008.
11. Chen H.L., Lee H.M., Chen S.H., Chao Y., Chang M.B. ‘‘ Review of plasma catalysis on
hydrocarbon reforming for hydrogen production-Interaction, integration, and prospects’’,
Applied Catalysis B-Environmental, 85, pp. 1-9, 2008.
12. Chernyak V.Y., Olszewski S.V., Yukhymenko V.V., Solomenko E.V., Prysiazhnevych I.V., Naumov V.V., Levko D.S., Shchedrin A.I., Ryabtsev A.V., Demchina V.P.,
36
Ethanol in Dynamic Plasma-Liquid System: Experiments and Modeling”, IEEE
Transaction On Plasma Science, pp. 36(6), 2933 – 2939, 2008.
13. Cohn D.R., Rabinovich A., Titus C.H., and Bromberg, L. International Journal of
Hydrogen Energy, Elsevier, 22, pp. 715–723, 1997.
14. Comas J., Mariño F., Laborde M., Amadeo N. ‘‘Bio-ethanol steam reforming on
Ni/Al2O3 catalyst’’, Chemical Engineering Journal, 98, pp. 61-68, 2004.
15. De Souza S., Visco S.J., Jongle L.C.D. “Thin-film solid oxide fuel cell with high
performance at low-temperature”, Solid State Ionics, 98, pp. 57-61, 1997.
16. Diagne C., Idriss H., and Kiennemann A. ‘‘Hydrogen production by ethanol reforming
over Rh/CeO2–ZrO2 catalysts”, Catalysis Communications’, 3, 565-571, 2002.
17. Dupuis A.C. “Proton exchange membranes for fuel cells operated at medium
temperatures: Materials and experimental techniques”, Progress in Materials Science, 56, pp. 289-327, 2011.
18. Erdohelyi A., Raskó J., Kecskés T., Tóth M., Dömök M., and Baán K. ‘‘Hydrogen formation in ethanol reforming o n supported noble metal catalysts’’, Catalysis Today,
116, 367-376, 2006.
19. Fatsikostas, A.N., Verykios X.E. ‘‘Reaction network of steam reforming of ethanol over Ni-based catalysts’’, Journal of Catalysis, 225, pp. 439-452, 2004.
37
Health Perspectives, 111, pp. A38-A41, 2003.
21. Frusteri F., Freni S., Chiodo V., Spadaro L., Di Blasi O., Bonura G., Cavallaro, S. ‘‘Steam
reforming of bio-ethanol on alkali-doped Ni/MgO catalysts: hydrogen production for
MC fuel cell’’, Applied Catalysis A: General, 270, pp. 1-7, 2004.
22. Frusteri F., Freni S., Spadaro L., Chiodo V., Bonura G., Donato S., Cavallaro, S. ‘‘H2
production for MC fuel cell by steam reforming of ethanol over MgO supported Pd, Rh,
Ni and Co catalysts”, Catalysis Communications, 5, pp. 611-615, 2004.
23. G. A. Deluga, J. R. Salge, L. D. Schmidt, X. E. Verykios, 2004, “Renewable Hydrogen
from Ethanol by Autothermal Reforming,” Science, 303, pp. 993-996.
24. G. Petitpas, J.D. Rollier, A. Darmon, J. Gonzalez-Aguilar, R. Metkemeijer, and
L.Fulcheri, ‘‘A comparative study of non-thermal plasma assisted reforming technologies’’, International Journal of Hydrogen Energy, 32, pp.2848-2867, 2007.
25. Heffel J.W. “NOx emission and performance data for a hydrogen fueled internal
combustion engine at 1500 rpm using exhaust gas recirculation”, International Journal of Hydrogen Energy, 28, pp. 901-908, 2003.
26. Indarto A., Choi J. W., Lee H., Song H. K., Coowanitwong N. “Discharge characteristics
of a gliding-arc plasma in chlorinated methanes diluted in atmospheric air” Plasma
Device and Operations, 14, 15-26, 2006.
38
Fridman, A., Electronic Proceedings of the 16th International Symposium on Plasma
Chemistry, Taormina, Italy, pp.22–27, 2003.
28. Kalra C.S., Cho Y.I., Gutsol A., Fridman A., and Rufael, T.S., ‘‘Gliding arc in tornado
using a reverse vortex flow’’, Review of Scientfic Instruments, 99, 76, 2005.
29. Kalra C.S., Cho Y.I., Gutsol A., Fridman A., and Rufael, T.S., ‘‘Non-Thermal Plasma
Catalytic Conversion of Methane to Syn-Gas’’, Abstracts of Papers of the American
Chemical Society,228, pp. 687, 2004.
30. Kalra C.S., Gutsol A.F., and Fridman A.A., ‘‘Gliding arc discharges as a source of
intermediate plasma for methane partial oxidation’’, IEEE, Transactions ofn Plasma
Science, 33, pp. 32-4, 2005.
31. Kim J, Lee S.M., Srinivasan S. “Modeling of Protop Exchange Membrane Fuel Cell
Performance with an Empirical Eq”, Journal of The Electrochem Society, 142, pp. 2670-2674, 1995.
32. Kusano Y., Teodoru S., Leipold F., Andersen T.L., Sorensen B.F. Rozlosnik N.,
Michelsen P.K. ‘‘Gliding arc discharge - Application for adhesion improvement of fibre
reinforced polyester composites’’, Surface & Coatings technology, 202, pp. 5579-5582,
2008.
33. Kuznetsova I.V., Kalashnikov N.Y., Gutsol A.F., Fridman A.A., and Kennedy L.A. ‘‘Effect of "overshooting" in the transitional regimes of the low-current gliding arc
39
discharge’’, Journal of Applied Physics, 92, pp. 4231-4237, 2002.
34. Li M., Wang X., Li S., Wang S., Ma X. “Hydrogen production from ethanol steam
reforming over nickel based catalyst derived from Ni/Mg/Al hydrotalcite-like
compounds”, International Journal of Hydrogen Energy, 35, pp. 6699-6708, 2010
35. Liguras D.K., Kondarides D.I., Verykios X.E. ‘‘Production of hydrogen for fuel cells by
steam reforming of ethanol over supported noble metal catalysts’’, Applied Catalysis B:
Environmental, 43, pp. 345-354, 2003.
36. Llorca J., Homs N., Sales J., Fierro J.L.G., Piscina P.R. ‘‘Effect of sodium addition on the
performance of Co–ZnO-based catalysts for hydrogen production from bioethanol’’,
Journal of Catalysis, 222, pp. 470-480, 2004.
37. Llorca J., Piscina P.R., Dalmon J.A., Sales J., Homs N. ‘‘CO-free hydrogen from
steam-reforming of bioethanol over ZnO-supported cobalt catalysts: Effect of the
metallic precursor’’, Applied Catalysis B: Environmental, 43, pp. 355-369, 2003.
38. Mehta V., Cooper J.S.. “Review and analysis of PEM fuel cell design and
manufacturing”, Journal of Power Sources,114, pp. 32-53, 2003.
39. Mutaf-Yardimci O., Saveliev A.V., Fridman A.A. and Kennedy L.A. ‘‘Thermal and
non-thermal regimes of gliding arc discharge in air flow’’, Journal of Applied Physics, 87,
pp. 1632-1641, 2000.