COBRA
the Construction Research Conference of the RICS Foundation
AUBEA
the Australasian Universities' Building Educators Association Conference
3rd CIB Student Chapters International Symposium CIB W89
Building Education and Research CIB TG53
Postgraduate Research Training in Building and Construction Australasian Universities Building Educators Association A COLLABORA TION OF:
Conference Proceedings
Edited by A. C. Sidwell45 July 2005, Brisbane, Australia
The Queensland University of Technology
Research Week International Conference
4-8 July 2005
Brisbane, Australia
Conference Proceedings
Editor: A. C. Sidwell
July 2005
Queensland University of Technology Australia
HEDONIC MODEL OF COURT AUCTION
RESIDENTIAL HOUSING MARKET IN THE TAIPEI
METROPOLITAN AREA
Lin, Vickey Chiu-Chin
Department of Land Economics, National Chengchi University, Taipei, Taiwan, R.O.C.
ABSTRACT
Court auction of real estate in the domestic Residential housing market accounts for a certain level of market share. The high returns ratio, due to the fact that the auction price is always much lower than the market price, has been the driving force behind the entry of investors into the market.
Recently, the emerging real estates auctioned by Taiwan Financial Asset Service Corp., entrusted by Taipei District Court, and by each bank have prompted still further interest. However, what is the price difference between search and auction markets? What are the factors that affect the winning-bid price of court auction residences?
This study applied the Hedonic Price Theory and found out the relation of the attributes of court auction residences in Taipei Metropolitan Area from 2001 to 2003. In addition, this study also adopted the GIS system to find out which spatial factors affect the level of the winning-bid price on court auction residences.
The empirical results confirmed that the market share of court auction housing was larger, the bigger the discount ratio between markets was. The percentage 20 price-difference between the search market and auction market did not exist in 1994, a decade ago; however the bigger return was found in 2002 and 2003. The auction market still grows to be the investor or speculator market, it does not belong to the consumer’s market.
Keywords: court auction residential house, Hedonic Price Theory, bid price, spatial
factors.
INTRODUCTION
In recent years, the continuous decline in macro-economic conditions has contributed to a slump in the Taiwan real estate market cycle. As a result, there has been a steady increase in mortgage arrears. A large amount of mortgage arrears have been released to the court auction housing market. The court auction of real estate has become a new market that has gradually gathered interest and popularity. Reported by the media, people gradually understand the court auction housing market conditions. The court auction is always the main way for financial institutions to deal with defaulted loans. Upgrading the efficiency of the court auction price always affects the nonperforming loans directly. One of the strongest influences is the higher the bid times and the failure ratios of bids due to the higher price of appraisal and making reserve price. According to the previous references, the higher the reserve price, the
higher the bid price is. Meanwhile, the courts put forward an upper-price to refrain from lower-price bids when they make the first reserve price. Lower bid price will damage the benefit of creditors and debtors. When the courts set up its reserve price (base price) and lower it, they can reduce the times of make bids and avoid breaking down the tender. But whether the bid price will be reduced or not, there is something meaningful on the analyses of the court auction market. It can provide the indicator for the court auction on how to set up the reserve price. The court auction accounts for a certain level of market share in the Taiwan residential housing market. The high returns ratio, due to the fact that the auction price is always much lower than the market price, has been the driving force behind the entry of investors into the market. Recently, the emerging real estates auctioned by Taiwan Financial Asset Service Corp., entrusted by Taipei District Court, and by each bank have prompted still further interest.
Collecting the "real" transaction real estate price is the most critical issue of the real estate search market, and it is also the most difficult part of our research in Taiwan. Much of the real estate price research bias may come from the "not real" transaction price. We might study on the open auction market to gain some pricing information. Real estate price in Taiwan has its special formation background, for example, land shortage, high population density, high priority of owner occupancy, and highly speculative real estate demand, etc. However, what is the price difference between search and auction markets? What are the factors that affect the final bid price of court auction residences?
This study will use the Hedonic Price Theory to find out the relation of the attributes of court auction residences in Taipei city Area from 2001 to 2003. In addition, this study also adopts the GIS system to find out which spatial factors affect the level of the final successful-bid price on court auction residences.
DATA AND DESCRIPTIVE STATISTICS
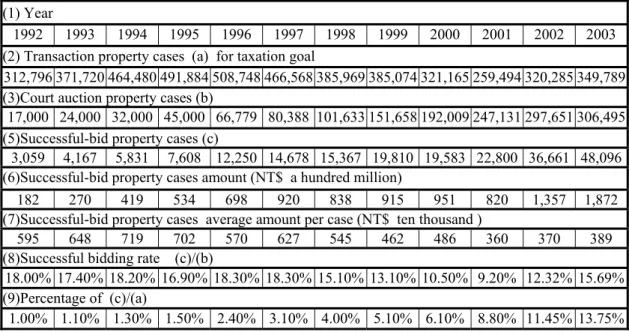
There are three up to four types of auction markets. Most of the auction market share is the court auction market, the others are (golden), (silvery), (diamond) auction markets, the latter only have a 2% market share on Taiwan real estate market, and most of them deal with the unsuccessful-bid court auction objects which are originally sourced from bank nonperforming loans (NPL). The auctioneers, not the court auction, can be Taiwan Financial Asset Service Corp., entrusted by Taipei District Court, the bank itself, or the auction agent, entrusted by the Bank. The 16 nation courts had 17,000 auction property cases in 1992, however in a decade these have dramatically risen to 306,495 cases. Both Table1 and Figure1 indicate the court auction change from 1.00% in 1992 to 13.75% in 2003 on real estate market share in cases. The successful-bid property cases amount rose from 182(NT$ a hundred million) in 1992 to 1,872(NT$ a hundred million) in 2003 and reached a new high in 2004 of around 3000 (NT$ a hundred million).
Hedonic model of court auction residential housing market in the Taipei metropolitan area
Table 1: 1992-2003 Taiwan Area Court Auction Property Cases Statistic Data
(1) Year
1992 1993 1994 1995 1996 1997 1998 1999 2000 2001 2002 2003 (2) Transaction property cases (a) for taxation goal
312,796 371,720 464,480 491,884 508,748 466,568 385,969 385,074 321,165 259,494 320,285 349,789 (3)Court auction property cases (b)
17,000 24,000 32,000 45,000 66,779 80,388 101,633 151,658 192,009 247,131 297,651 306,495 (5)Successful-bid property cases (c)
3,059 4,167 5,831 7,608 12,250 14,678 15,367 19,810 19,583 22,800 36,661 48,096 (6)Successful-bid property cases amount (NT$ a hundred million)
182 270 419 534 698 920 838 915 951 820 1,357 1,872
(7)Successful-bid property cases average amount per case (NT$ ten thousand )
595 648 719 702 570 627 545 462 486 360 370 389
(8)Successful bidding rate (c)/(b)
18.00% 17.40% 18.20% 16.90% 18.30% 18.30% 15.10% 13.10% 10.50% 9.20% 12.32% 15.69% (9)Percentage of (c)/(a)
1.00% 1.10% 1.30% 1.50% 2.40% 3.10% 4.00% 5.10% 6.10% 8.80% 11.45% 13.75%
Figure 1: 1992-2003 the Comparison between Taiwan Area Court Auction Property
Cases and Successful-bid (Bidden) Property Cases
0 5 0 , 0 0 0 1 0 0 , 0 0 0 1 5 0 , 0 0 0 2 0 0 , 0 0 0 2 5 0 , 0 0 0 3 0 0 , 0 0 0 3 5 0 , 0 0 0 1 9 9 2 1 9 9 3 1 9 9 4 1 9 9 5 1 9 9 6 1 9 9 7 1 9 9 8 1 9 9 9 2 0 0 0 2 0 0 1 2 0 0 2 2 0 0 3 C o u n t A u c t i o n P r o p e r t y C a s e s ( b ) B i d d e n P r o p e r t y C a s e s ( e )
We found in Table 2 that the city of Taipei total court auction property cases have 16% of Taiwan count auction market share with cases reaching 47,189 in the year of 2002 and the dollar amount has 32.00% market share which amount attained up to 438.2(NT$ a hundred million).
THE DATA AND ECONOMETRIC MODEL FRAMEWORK
The Hedonic Price Theory, Rosen (1974), is applied to most conventional housing price analyses. As hedonic pricing makes use of utilitarianism to analyze the implicit price of all the characteristics of a multifaceted commodity, when applied to housing, it analysed only the relationship between the attributes, proper for the subject and the price. However, looking at the auction housing market, one discovers that the behaviour of purchasers' paying money, regardless of purchase for consumption or investment, can be reflected by the attributes of housing, auction attributes as well as by the macro environment (such as an economic boom), and the influence of the macro environment is no less important than that of the attributes of the housing itself.
Table2: Taipei (City + County) Area Court Auction Property Cases Bidding Statistic
Data
(1) Taipei City + County 2001 2002 2003
(2) Successful-bid property cases 4,816 8,297 4,742
(3) Successful-bid rate 21.00% 23.00% N/A
(4) Fail-bid cases (Not-close bid) 26,772 33,880 N/A
(5) Withdraw-bid cases 3,760 5,012 N/A
(6) Court auction property cases 35,348 47,189 N/A
(7) The Percentage of (6) in Taiwan area cases 15.00% 16.00% N/A
(8) The average bidding counts(times) 3.15 2.97 N/A
(9) Bidden Property Cases Amount
(NT$ a hundred million) 257.4 438.2 301.7
(10) The Percentage of (9)
in Taiwan Area Cases Amount 31.00% 32.00% N/A
Generally speaking, this theory contains no flaws. It is the selection of attributes that matters to the outcomes. Besides, it is to be considered whether the local housing market status satisfies the basic assumptions of the hedonic price theory, as it directly connects to the results.
However, when evaluating these attributes, most empirical researches strongly rely on the land rent and location theories. As examples, the location evaluation indicators developed by Bender and Hwang (1982), Harrison and Rubinfeld (1976), Kain and Quigley (1975), Nelson (1978), Liu (1986), Ku and Liu (1989) and the others is based on the "negative relation of the rent & distance from the CBD" by Von Thunen (1826) and the "negative relation of the land price & distance from the CBD" in the bid-rent theory by Alonso (1964). Other examples can be found in similar studies about the relation of the accessibility and housing prices by Muth (1969), Mills (1972) and Evans (1973). These researches still cannot propose a practical theory for housing price evaluation.
There is no really free competition in the housing market, therefore, when we are applying the Hedonic Price Theory to the local housing market, it is first to consider whether local markets satisfy the basic assumptions of the theory. Having no other appropriate economic theories to interpret the market situation, the use of empirical statistics are nevertheless a more practical means. Besides, when establishing a model, reselection of attributes that are closer to local practices as to independent variables are needed. Doing so is to make price evaluation more substantiated for local markets.
From reviewing the literature, one discovers that most housing price studies did not include the values that cannot be quantitative (such as timing, location, type, those called "quality" variance). Also, are those attributes (such as area, age of the housing...) included in most foreign countries literature really important factors, which affect the auction housing price? Are they as sensible as conceived? The present research will make a review on these model frameworks with certain examples, in order to establish a more suitable model framework as the foundation for an empirical study.
Hedonic model of court auction residential housing market in the Taipei metropolitan area
1. How the auction market works
In the literature reviews (see Table 3), we find the auction market work on different by the rules of sales, and the most of markets the sale rules were the English auction-open called bid, such as Australia, U.S.A, and New Zealand.
In Taiwan, mostly we have the sale rules of the first-price sealed bid on auction market. Some of the auctions have open called bid in the private sale market (such as [silvery], [diamond] auction markets in Taiwan), which have the 2% market share in the auction market. The Taiwan court auctions were viewed as a way to dispose of distressed properties. Most of the properties in court auctions are related to debtor-creditor, amount due of mortgage or nonperforming loans (NPL) mortgage foreclosure, and tax foreclosure. The creditor declares court auction by the law of enforcing performance in court. Buyers bring secret bids to the auction site inside the court room before the fixed period date. This is followed by the execute judge openly announcing the highest winning bid.
The Taiwan court auction methods were more similar to the first-sealed bid auction, the buyer has claim to the object auctioned by making the highest. During the process, buyers did not know the other bids, such as the number of bidder, the bid-price of other bidders. If in the event of the successful bidder defaulting, the court shall have a secondary auction.
In the event of an unsuccessful-bid (it is not close auction, if no bidders reach the base price); the court might have second, third …sub sequential auction. The bid-times may one-shot, two, three or up to eight etc. to win the bid and the court can close the auction. Each next auction will cut down the base price around 20%. The average auction bid times (counts) was 3 to 4 times. The winning bidder would pay the full strike-price within 7 days of the date notification. Sometimes, the court auction is not efficient in time spending to deal with the properties.
Table3: The literature reviews of the auction markets comparisons
Author Auction System Real Estate market type Real estate type The method of
Evaluation Lusht, 1996 English
auction-open called bid Australia, The auction market attaints the half of market share in real estate market
Normal asset,
Residential housie Hedonic Price Theory
Dotzour; Moorhead; Winkler, 1998
English auction-open called bid
New Zealand, The auction market attaints fewer of market share
Residential house Hedonic Price
Theory Mayer, 1998 English
auction-open called bid U.S.A. The auction market attaints fewer of market share Normal and NPL asset mixed, Residential house
Reaped Sale Method Marcus,2001 English
auction-open called bid
U.S.A. The auction market attaints fewer of market share
NPL by HUD Residential house
Hedonic Price Theory
Quan, 2002 English
auction-open called bid U.S.A Residential land vacancy Hedonic Price Theory
Lin, Tsai,
2. Important Factors Affecting Auction Housing Prices in Taiwan
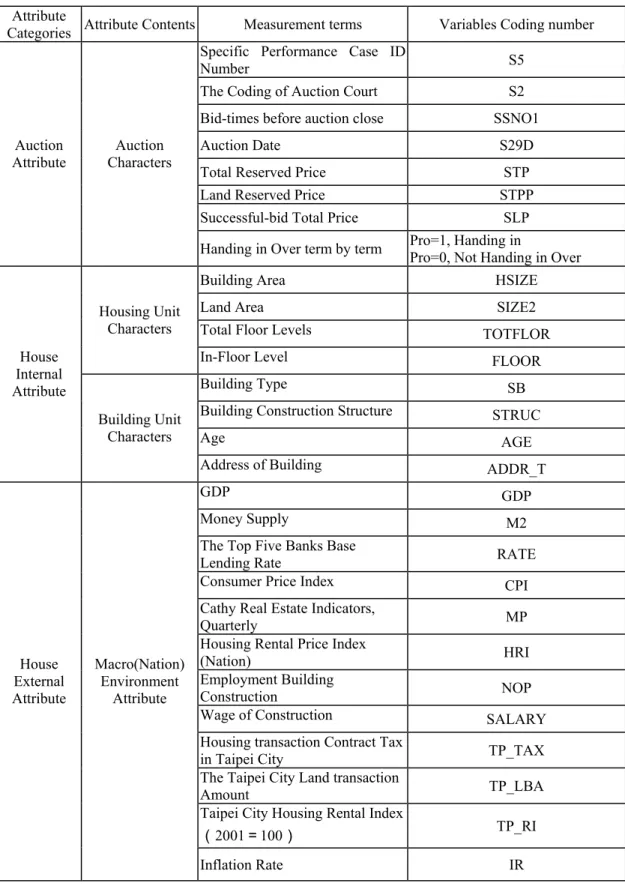
In an attributes analysis of the auction housing price, one should begin from the angle of a user and draw in the following factors(see Table 4 and Table 5): First, consider the auction attributes, such as bid times auction date, total reserved price (base price), land reserved price, successful-bid total price, handing in over term by term; next finding house internal/ external attribute such as dwelling, building unit characters/neighbourhood, macro (Nation) environment factors dwelling unit, building block, and macro environment factors.
The most important auction market factors were price; there are reservation price, bid price and the winning-bid price. Indeed, the auction price factors need to be studied. Whether the handing in over term by term or not, the process will affect the winning-bid price. The higher price they will chose the handing over term by term. The more bid-times the lower the reservation bid price as well the winning-bid price. The more the number of bidder, the higher the winning-bid price, but this cannot obtained (unobserved in the databank of this study) variable.
The dwelling unit factor refers to the interior condition of a dwelling unit. Generally, one can begin with the proportion of the public facilities, stayed-floor, floor-area, location, management fee, bathroom and toilette, and number of rooms. As there are different standards for public facilities, locations, and management fees, bathrooms and toilettes, and the number of rooms are all dependents of the dwelling unit's total floor-area. One can simplify these factors to floor-area and stayed-floor.
The building block factor refers to the appearance of the entire building above the construction site, i.e. the "type of building". One can examine this factor from the utilization, age of the building and the number of floors. The neighbourhood factor often connects to the location of the building, which can be divided into a major and minor neighbourhood. Major neighbourhood refers to the administration district in which a building is located. As the feature of the administration district is different from that of the distance from the CBD, living standards, and the standards of the neighbourhood, each has its individual development. For example, the six districts that were only included in the Taipei municipality since 1976 have been developing as residential areas, while the old districts are used as commercial areas. Near neighbourhood refers to the convenience of the building to the neighbouring public facilities. For example, the price of a building located beside the main road will be higher than one that is located in an alley. Other factors including corner area, and the distance from bus stations, parks, and markets, are also important attributes relating to accessibility.
Hedonic model of court auction residential housing market in the Taipei metropolitan area
Table 4: Court auction housing variable attributes
Attribute
Categories Attribute Contents Measurement terms Variables Coding number
Specific Performance Case ID
Number S5
The Coding of Auction Court S2
Bid-times before auction close SSNO1
Auction Date S29D
Total Reserved Price STP
Land Reserved Price STPP
Successful-bid Total Price SLP
Auction
Attribute Characters Auction
Handing in Over term by term Pro=1, Handing in Pro=0, Not Handing in Over
Building Area HSIZE
Land Area SIZE2
Total Floor Levels TOTFLOR
Housing Unit Characters
In-Floor Level FLOOR
Building Type SB
Building Construction Structure STRUC
Age AGE House Internal Attribute Building Unit Characters
Address of Building ADDR_T
GDP GDP
Money Supply M2
The Top Five Banks Base
Lending Rate RATE
Consumer Price Index CPI
Cathy Real Estate Indicators,
Quarterly MP
Housing Rental Price Index
(Nation) HRI
Employment Building
Construction NOP
Wage of Construction SALARY
Housing transaction Contract Tax
in Taipei City TP_TAX
The Taipei City Land transaction
Amount TP_LBA
Taipei City Housing Rental Index
(2001=100) TP_RI House External Attribute Macro(Nation) Environment Attribute Inflation Rate IR
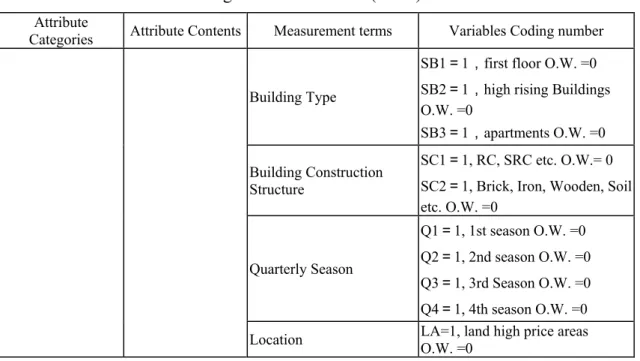
Table 4: Court auction housing variable attributes (Cont.)
Attribute
Categories Attribute Contents Measurement terms Variables Coding number
Building Type
SB1=1,first floor O.W. =0 SB2=1,high rising Buildings O.W. =0
SB3=1,apartments O.W. =0 Building Construction
Structure
SC1=1, RC, SRC etc. O.W.= 0 SC2=1, Brick, Iron, Wooden, Soil etc. O.W. =0 Quarterly Season Q1=1, 1st season O.W. =0 Q2=1, 2nd season O.W. =0 Q3=1, 3rd Season O.W. =0 Q4=1, 4th season O.W. =0
Location LA=1, land high price areas O.W. =0
Note: Location variable defined by the official land present value lot media price, the district lie on the higher lot media price than referred as high price area in Taipei city. LA=1, there are half of the 12 district located on high price area such as Chung-Chen, Chung-Shen, Shung-Sha Tan-An, Sin-Yi and Sin-Lin district.
Table 5: Spatial factors description
Variables Contents
SDIST The distance from small Regional park
BDIST The distance from big Regional park
STDIST The distance from station of the rapid transit system
S_101DISt The distance from101 high-rise building or Sin-Kua department store in
the main Train station whichever place is closer.
Dummy variables Contents
SCDIST The small Regional park of circle radius within 500 meter, SCDIST=1,
O.W. SCDIST=0
BCDIST The big Regional park of circle radius within 500 meter, BCDIST=1,
O.W. BCDIST=0
SCTDIST The distance from station of the rapid transit system of circle radius
within 500 meter, SCTDIST=1, O.W. SCTDIST=0
S_101CDIS The 101 high-rise building or Sin-Kua department store in the main Train
station of circle radius within 500 meter whichever place is closer, S_101CDIS=1, O.W. S_101CDIS=0
In the macro neighbourhood factor, all the elements can reflect to the "timing" factor, in which the response to timing is very important during the housing market booms.
3. Establishment of Model Frameworks
There are four types of Model shown in the literature reviews for hedonic price model function forms. The major difference between the model and the multiple regression is that the model is established to find out the linear or nonlinear relationship between a target variable and other "quality" variables, while the multiple regression model is
Hedonic model of court auction residential housing market in the Taipei metropolitan area
used to find out the linear relationship between a target variable and other independent variables of "quantity".
The aim of the analysis is to establish a relationship formula, in order to examine the degree of influence that each "quality" item causes to the target variable. Each independent variable of "quality" consists of several categories, and it is to be assumed that each sample within an independent variable must choose only one category, that is, the dummy value of the chosen category is 1, while the dummy value of the rest of categories is 0.
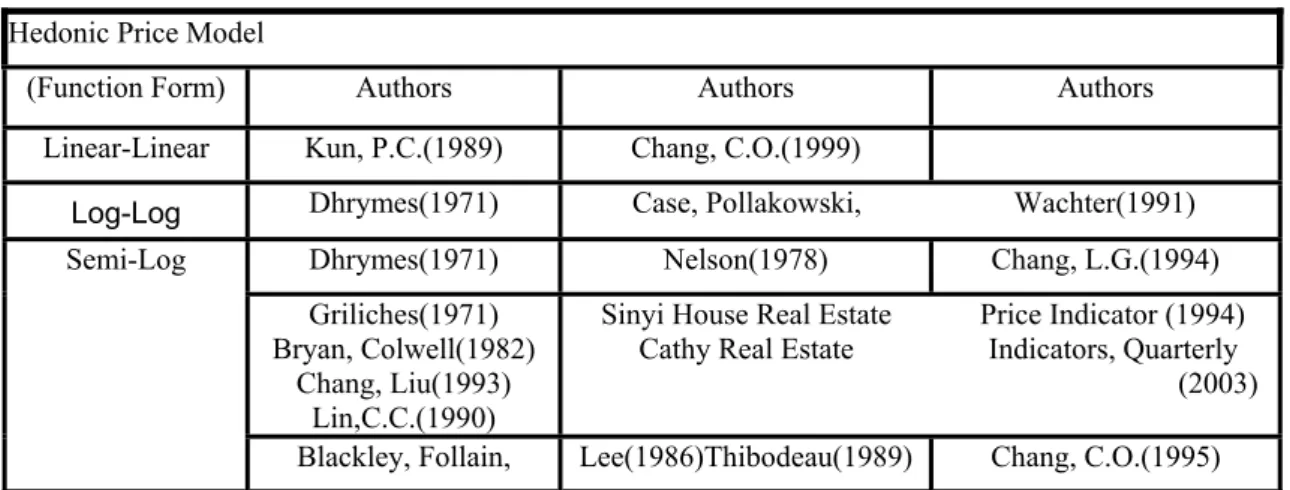
Like the general multiple regression, a hedonic price model makes use of the OLS to find out the better fitted model. The four types of Model are: linear-linear form, semi-log form, semi-log-semi-log form, and flexible functional form such as Box & Cox (1964). Since the Box & Cox flexible functional form was between linear and log-linear form, and while the other power functions(besides the linear and log form) have no meaningful paramaters, we chose the fuction forms linear-linear, log-log, and semi-log. Their related literature reviews are shown in Table 6. In our empirical study we chose the most uses in Taiwan housing price study of semi-log form.
Table 6: Related literature reviews for hedonic price model function forms
Hedonic Price Model
(Function Form) Authors Authors Authors
Linear-Linear Kun, P.C.(1989) Chang, C.O.(1999)
Log-Log Dhrymes(1971) Case, Pollakowski, Wachter(1991)
Dhrymes(1971) Nelson(1978) Chang, L.G.(1994)
Griliches(1971) Bryan, Colwell(1982)
Chang, Liu(1993) Lin,C.C.(1990)
Sinyi House Real Estate Cathy Real Estate
Price Indicator (1994) Indicators, Quarterly
(2003) Semi-Log
Blackley, Follain, Lee(1986)Thibodeau(1989) Chang, C.O.(1995)
THE EMPIRICAL ANALYSES
In Table7 we found the court auction data from 2001Q1-2003Q4, the total are 3,016 cases. We used 90% in-sample data for regression analysis, the 10% out-sample for post forecast. Outlier have been adjusted the data by Lin (1996) empirical results which show the DFFITS outlier removal better method. The final data we used in the study are shown in table 7.
Table7: The Empirical study In/Out Sample data on the Taipei city court auction
houses /Adjusted by outlier checking
Year In Sample Data Out Sample Data Outliers for Adjusting
2001 584 65 34
2002 1,019 110 71
2003 1,111 127 65
Based on the data banks from the private company [Tom-Ming], we have limit on the possible data factors. The selected-factors list in Table 4 and Table 5. There are micro variables and macro variables. To avoid the multicollineary, we chose the macro variable limitation. The GDP presented the macro variable. The model we used in the empirical is as follows; in this model we have 14 RHS independent variables: 0 1 2 3 4 5 6 7 8 9 10 11 12 13 14 1 2 1 2 1 2 i i i i i i i i i i i i i i i i
Y ssno stp pro hsize size sb sb age sc totflor floor floor la gdp
β β β β β β β β β β
β β β β β ε
= + + + + + + + + +
+ + + + + +
i
Y :ith Court Bid Price after log transformation; β ~ :Hedonic Price Model 0 β15
Regression Coefficients; εi: Error Term, we have ε ~Ni (0,σ)
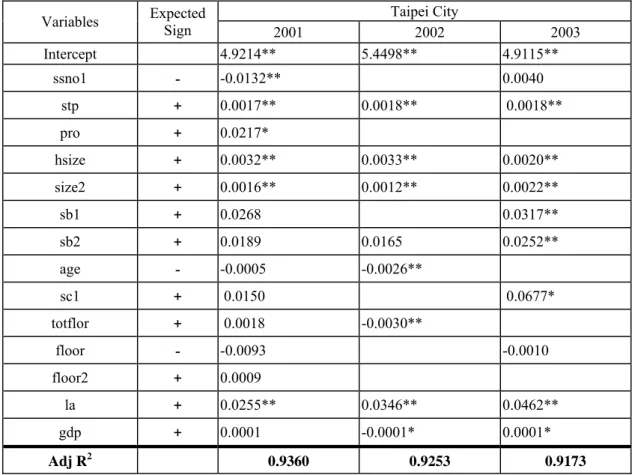
The models have been chosen by three criteria (see Table 8 and Table 9). One is the experience rules T value significance; the other rules are the bigger AdjR2 and the smaller Root Mean Squared Errors. The indicators found the better models the criteria exhibit in Table8. The Table 9 shows the better models results from the year 2001 to 2003. We found the important factors such as handing over term by term, the total reservation price, house total size and lot size, location and macro factor GDP have significance in winning-bid price. The positive contribute factors show as handing over term by term, both size factors and location. The others were vague in the direction for winning-bid price.
Table 8: AdjR2、 root MSE comparison between model 1 and model 2
AdjR2 Year 2001 2002 2003 MODEL 1 0.9360 0.9235 0.9170 MODEL 2 0.9253 0.9173 Root MSE MODEL 1 0.1140 0.1197 0.1348 MODEL 2 0.1162 0.1340
Hedonic model of court auction residential housing market in the Taipei metropolitan area
Table 9: The estimate of the better fitted model (consider the auction price modelling)
Taipei City
Variables Expected Sign
2001 2002 2003 Intercept 4.9214** 5.4498** 4.9115** ssno1 - -0.0132** 0.0040 stp + 0.0017** 0.0018** 0.0018** pro + 0.0217* hsize + 0.0032** 0.0033** 0.0020** size2 + 0.0016** 0.0012** 0.0022** sb1 + 0.0268 0.0317** sb2 + 0.0189 0.0165 0.0252** age - -0.0005 -0.0026** sc1 + 0.0150 0.0677* totflor + 0.0018 -0.0030** floor - -0.0093 -0.0010 floor2 + 0.0009 la + 0.0255** 0.0346** 0.0462** gdp + 0.0001 -0.0001* 0.0001* Adj R2 0.9360 0.9253 0.9173
Note:* indicated significance level 10% ** defined significance level 5%
Table 10 shows the 10% out-sample forecast model results. The best fitted model was selected by the value criteria RMSE, MAPE, AS-Ratio mean, variance and Hit Ratio :
1. Root Mean Squared Errors,RMSE ∑=
= n i i n e RMSE 1 2 / ei = yi − yˆi
The smaller RMSE is the better result is.
2. Mean Absolute Percentage Errors, MAPE *100 % ( 0)
/ 1 ≠ = ∑= t n i t t y n y e MAPE t t t y y
e = − ˆ ; MAPE not over 5%~15% were better. 3. Assessment Ratio,AS RatioAS Ratio=y /ˆ y
AS Ratio indicated the assessment fair, the value more close 1 was better. The variance of AS Ratio not over 15%~20% was better.
4. .Hit Ratio. N *100 % n
HitRatio = ; n:the number of hit the range,N:sample size
( ) ˆ ( )
Hitting Range=y-y α ≤ ≤y y+y α
where Y represents the actual value,α are the significant levels : 5%、10%、20 %,If the forecast value fall in the hitting range defined 1, otherwise defined 0. Added up the ‘1’ the sum ratio to the total sample defined Hit Ratio. The higher ratio defined the small gap between the actual value and the forecast value. The final results show in Table 11.
Table 10: The estimate of the better fitted model (consider the spatial factors for auction price
model modelling)
Variables 2001 Variables 2002 Variables 2003
_TYPE_ PARMS _TYPE_ PARMS
Intercept 4.9071 ** Intercept 5.4767 ** **
SSNO1 -0.0122 * SSNO1 -0.0001 SSNO1 0.0071
STP 0.0017 ** STP 0.0018 ** STP 0.0019 **
PRO 0.0244 ** PRO 0.002 PRO 0.002
HSIZE 0.0034 ** HSIZE 0.0034 ** HSIZE 0.0022 **
SIZE2 0.0014 ** SIZE2 0.0011 ** SIZE2 0.0015 **
SB1 0.0283 SB1 0.015 SB1 0.0286
SB2 0.0188 SB2 0.0273 ** SB2 0.0373 **
AGE -0.0008 AGE -0.0021 ** AGE 0.0004 **
SC1 0.0142 SC1 0.0553 SC1 0.0478
TOTFLOR 0.0013 TOTFLOR -0.0042 ** TOTFLOR -0.0015 **
FLOOR -0.0099 FLOOR -0.0018 FLOOR -0.0059
FlOOR2 0.0009 * FlOOR2 0.0002 FLOOR2 0.0003
LA 0.0319 ** LA 0.035 ** LA 0.047 **
GDP 0.0001 * GDP -0.0001 ** GDP 0.0001 **
SDIST -0.0001 * SDIST -0.0001 ** SCDIST 0.0121
BDIST -0.0001 ** BDIST 0.00 BCDIST 0.0169 *
STDIST 0.00 STDIST 00.00 STCDIST 0.0135
S_101DIS 0 S_101DIS 0 S_101CDIS 0.0375 **
Adj-RSQ 0.9372 Adj-RSQ 0.9239 Adj-RSQ 0.9241
Table 11: The out-sample criteria for the estimate of the better fitted model (consider
the spatial factors for auction price model modelling)
Out-Sample Size 65 108 114 Criteria 2001 2002 2003 RMSE 109.77 146.3 184.28 MAPE 10.62% 12.24% 14.89% AS_R_AVG 1.0003 1.1636 1.0484 AS_R_cv 13.98% 14.32% 17.25% Hit Ratio 5% 31% 26% 24% 10% 51% 50% 50% 20% 89% 88% 75%
Hedonic model of court auction residential housing market in the Taipei metropolitan area
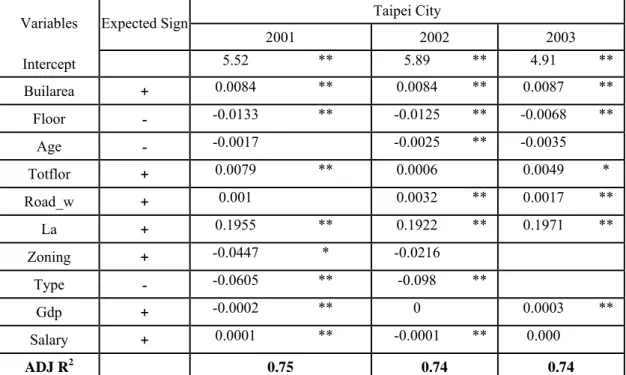
In additional, we added the spatial factors which adopt the GIS system come the distance with the significance signs. The signs include 101 high-rise building, small and big regional Park, the rapid transit system and Sin-Kua department store in the main Train station. The better fitted model was show in Table10 and Table11. We also set up the search market model by the data from the transaction sale cases from official transaction sale data banks (see Table 12). We found the mutual factors such as house size (hsize /Builarea) and location (la); the factors more contribute to the search market price given by house type (Type), the road width (Road_w) the house total-floor level (Totflor), house stay-floor level and the macro factors such as GDP and construction employer salary (Salary). The less contribute to the search market price found as land zoning and house age. In additions, the auction housing characters put in the deepest contributes in housing modelling. Especially the reservation bid price have the deepest effect on auction price. Some of spatial factors did put significant effect on pricing auction market such as the distance factors from park (SDIST/ BDIST) and 101 high-rise building areas (S_101CDIS). The rapid transit system may not significant in this study, it is surprise result. We suggest check the modelling or the GIS system measurement on the distance for further research in the spatial factors side.
Table 12: The estimate of the better fitted model (consider the search market price
modelling)
Taipei City
Variables Expected Sign
2001 2002 2003 Intercept 5.52 ** 5.89 ** 4.91 ** Builarea + 0.0084 ** 0.0084 ** 0.0087 ** Floor - -0.0133 ** -0.0125 ** -0.0068 ** Age - -0.0017 -0.0025 ** -0.0035 Totflor + 0.0079 ** 0.0006 0.0049 * Road_w + 0.001 0.0032 ** 0.0017 ** La + 0.1955 ** 0.1922 ** 0.1971 ** Zoning + -0.0447 * -0.0216 Type - -0.0605 ** -0.098 ** Gdp + -0.0002 ** 0 0.0003 ** Salary + 0.0001 ** -0.0001 ** 0.000 ADJ R2 0.75 0.74 0.74
Note:* indicated significance level 10% ** defined significance level 5%
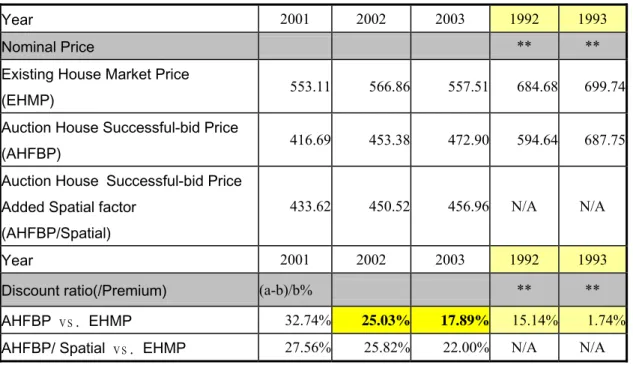
We evaluate the housing price respectively by year and by types. The model results defined the standard housing price based by 2001 housing characters. The standard housing price evaluated in both tables in nominal and real price (see Table 13 and Table 14).
Table 13: Court auction residential housing price 2001-2003 (in nominal price)
Year 2001 2002 2003 1992 1993
Nominal Price ** **
Existing House Market Price
(EHMP) 553.11 566.86 557.51 684.68 699.74
Auction House Successful-bid Price
(AHFBP) 416.69 453.38 472.90 594.64 687.75
Auction House Successful-bid Price Added Spatial factor
(AHFBP/Spatial)
433.62 450.52 456.96 N/A N/A
Year 2001 2002 2003 1992 1993
Discount ratio(/Premium) (a-b)/b% ** **
AHFBP vs. EHMP 32.74% 25.03% 17.89% 15.14% 1.74%
AHFBP/ Spatial vs. EHMP 27.56% 25.82% 22.00% N/A N/A
Note: ** 1992-1993 Data result was referred by Lin, Tsai, Change (1994)
Table 14: Court Auction Residential Housing Price 2001-2003 VS 1992-1993(in
Real Price)
Year 2001 2002 2003 1992 1993
CPI-Deflator (Base=2001) 100.00 99.80 99.60 83.91 86.38
Real Price a a
Existing House Market Price
(EHMP) 553.12 568.01 559.73 815.96 810.04
Auction House Successful-bid Price
(AHFBP) 416.70 454.30 474.78 708.66 796.16
Auction House Successful-bid Price Added Spatial factor
(AHFBP/Spatial )
433.63 451.43 458.78 N/A N/A
Note: ** 1992-1993 Data result was referred by Lin, Tsai, Change (1997)
The percentage of auction housing is larger the bigger the discount ratio between markets. 20% difference between the search market and auction market does not exist in 1994, the decade ago, however the bigger return found in 2002 and 2003. The auction market still raised to the investor or speculator market, it not belongs to the consumer’s market. By auction theory we might pre-sight the factors of the competition-bids, the information level, or the different machines in auction market, there might bring the big-gap between the search market and auction market, or between base auction price and bid-price. We need further study to find the factors.
Hedonic model of court auction residential housing market in the Taipei metropolitan area
CONCLUSIONS
According to the above analyses, the conclusion of this study is as follows:
1. In both markets, auction and search market found have common factors in house attributors on price, such as house size and location; the factors more contribute to the search market price given by house type, the road width the house total-floor level, house stay-floor level and the macro factors such as GDP and construction employer salary. In addition, the auction housing characters put in the deepest contributes in housing modelling. Especially the reservation bid price have the deepest effect on auction price. Some of spatial factors did put significant effect on pricing auction market such as the distance factors from park and 101 high-rise building areas.
2. Location and house size are the important variables in every submarket as expected. The influence of the stayed-floor at the same time should not be ignored in each market. If one considers location to be the horizontal accessibility (to the CBD) indicator, stayed-floor to be the vertical accessibility (to the first floor) indicator, house size (Floor-area) or land size to be the profitability of space, one will realize that the space size of a city is the most influential factor of the real estate price. In general, the greater the floor-area we have, the higher the total price have.
3. The coefficients of type-category of each submarket model can reflect the quantitative change from the standard values, which can be applied to real estate price estimation.
4. In the search market model the ADJ R2 is only about 75.00%; its explanatory power is
quite inferior to that of the auction price model with an ADJ R2 of 93%. These indicated that the existing housing market (search market) contains a lower explanatory power. When using such information, the results of this study should be with caution.
5. The market share percentage of auction housing is larger the bigger the discount ratio between markets. 20% difference between the search market and auction market does not exist in 1994, the decade ago, however the bigger return found in 2002 and 2003. The auction market still raised to the investor or speculator market, it not belongs to the consumer’s market. The big-gap between the search market and auction market might explain by the theory of auction. We need further study to find the factors.
REFERENCES
Blackley, D. M., Follain, J. R. and Lee, H.(1986) An Evaluation of Hedonic Price Indexes for Thirty-four Large SMSAs, AREUEA Journal, 14, 179-205.
Case, B., Pollakowski, H. O. and Wachter, S. M.(1991) On Choosing Among Housing Price Index Methodologies, AREUEA Journal, 19(3).
Chang, L.G.(1994) The relationship study on pre-sale and existing housing price viewing from the forward and spot market.---The case study in Taipei City., Journal
of Housing Studies, 2(1). (in Chinese with English Abstract)
Change, C.O.; Liu, S.L. (1993) The relationship study on the real estate quality, price and CPI , The Journal of Cheng-Chi University, 67, 369-400
Dhrymes, P. F. (1971) Price and Quality Changes in Consumer Capital Goods: An Empirical Study, edited by Griliches, Z., Price Indexes and Quality Chang, Cambridge: Harvard University Press.
Dotzour, Mark G.; Moorhead, Everard; Winkler Daniel T. (1998) The impact of auctions on residential sales prices in New Zealand, The Journal of Real Estate
Research, 16(1), 57-71.
Harrison, D. J. and Rubinfrld, D.L. (1978) Hedonic Housing Prices and the Demand for Clean Air, Journal of Environmental Economics and Management, 5, 81-102. Lin, V. C.C. (1996) The Robust Study on Rental Housing Modelling---The Outlier Analysis, Journal of Housing Studies, 4(1), 51-72 (in Chinese with English Abstract). Lin, V. C.C., Tsai F.T., Chang, C.O.(1997) The study of price factors on the auction hosing market in Taipei City, 1997 Conference of Chinese Society of Housing Studies,
Taipei, Taiwan, R.O.C. ( in Chinese).
Lusht, K. M. (1996) A comparison of prices brought by English auctions and private negotiations, Real Estate Economics, 24(4).12-130
Marcus, A.(2001) Discount in Real Estate Auction Price: Evidence form South Florida, The Appraisal Journal, 69, 28-43.
Mayer, C. J. (1998) Assessing the Performance of Real Estate Auction, Journal of
Real Estate Economics, 126, 41-66.
Nelson, J.P. (1978) Residential Choice, Hedonic Price, and the Demand for Urban Air Quality, Journal of Urban Economics, 5, 357-369.
Quan, D. C. (2002) Market Mechanism Choice and Real Estate Disposition: Search versus Auction, Real Estate Economics, 30(3), .65-384
Rosen, S. (1974) Hedonic Prices and Implicit Markets: Product Differentiation in Pure Competition, Journal of Political Economy, 82, 34-55.
Thibodeau, T. G. (1989) Housing Price Indexes from the 1974-1983 SIMSA Annual Housing Surveys, AREUEA Journal, 1(1).
“Cathy Real Estate Indicators”, Cathy Construction Co., Quarterly (2003) (in Chinese).
“Sinyi House Price Indicators” Sinyi House Real Estate Quarterly (1994) (in Chinese). Change, C.O; Lin, V.C.C.; Yang, C.S. (1995) The Residential Housing Price
Indicator in Taiwan Area, The CEPT technique research report, The Council for
Economic Planning and Development (CEPT):Taipei (in Chinese).
Change, C.O; Lin, V.C.C ;.( 1999) The Housing Information System Planning and
Integration, The CPAMI technique research report, The Construction and Planning
Agency Ministry of the Interior (CPAMI): Taipei (in Chinese).
Griliches, Z. (1971) Introduction: Hedonic Price Indexes Revisited, ed. By Griliches, Z. Price Indexes and Quality Change, Cambridge: Harbard University Press.
Kain, J.F. and Quigley J.M. (1976) Housing Markets and Racial Discrimination: A
Microeconomic Analysis, Nat. Bur. Res., New York.
Ku, P.C. & Liu L.W. (1989) Real Estate Price Indicator Study, Taipei: Directorate-General of Budget, Accounting and Statistics, Executive Yuan: Taipei (in Chinese).