Effect of the Trapping Laser Linewidth on the Atom Number in a
Magneto-Optical Trap
Ying-Cheng Chen1, Wen-Bin Lin1, Hsuin-Chia Hsue1, Long Hsu2 and Ite A. Yu1
1Department of Physics, National Tsing Hua University, Hsinchu, Taiwan 300, R.O.C. 2Department of Electrophysics, National Chiao Tung University, Hsinchu, Taiwan 300, R.O.C.
(Received April 5, 2000)
We have experimentally studied the effect of the trapping laser linewidth on the number of trapped atoms in a magneto-optical trap (MOT). Our data show that a significant number of the atoms can still be trapped in the MOT, even when the trapping laser linewidth is larger than the natural linewidth of the excited state of the driving transition.
PACS. 32.80.Pj – Optical cooling of atoms; trapping. I. Introduction
Cold atoms produced by a magneto-optical trap (MOT) [1, 2] provide great opportunities for the studies of quantum phenomena at long de Broglie wavelengths and for the scientific applications that require atoms with slow velocity or low kinetic energy. A vapor-cell MOT [2] is a rather simple and inexpensive setup. Such a setup is quite popular and adopted widely in many experiments. In a vapor-cell MOT, the number of the trapped atoms varies with the trap parameters such as the laser detuning, magnetic field gradient, laser intensit, laser beam size, and laser linewidth. Other than the laser linewidth, the dependences of the trapped atom number on the above trap parameters have been studied in detail [3]. For a MOT, if the linewidth of the trapping laser is much narrower than the natural linewidth of the excited state of the driving transition, the effect of the laser linewidth can be neglected. On the other hand the effect is not negligible, if the trapping laser linewidth is comparable to or larger than the natural linewidth of the excited state of the driving transition. In this work on 87Rb atoms, the effect of a finite laser linewidth on the number of the trapped atoms is experimentally investigated. Two laser linewidths, 1 MHz and 10 MHz, are studied in the experiment, while the natural linewidth of the excited state in the 87Rb transition for the MOT is 5.9 MHz.
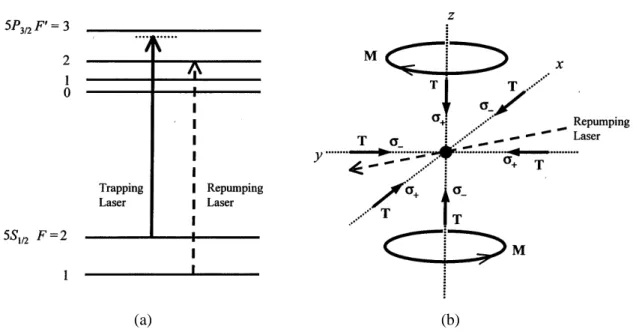
Our experimental arrangement is shown in Fig. 1. We cool and trap 87Rb atoms with a vapor-cell MOT. The MOT is formed with a spherical quadrupole magnetic field, 6 trapping laser beams, and a repumping laser beam. The typical temperature of the trapped atoms is about 300¹ K
in our MOT [4]. The spherical quadrupole magnetic field is generated by the two anti-Helmholtz coils, and its field gradient is varied in the experiment. The circular trapping beams have 1=e diameters of 9.6 mm. We carefully align the 6 trapping beams such that the trapped atoms form an evenly ellipsoidal cloud. All the trapping beams come from the same trapping laser. The frequency of the trapping laser is tuned below the transition of5S1=2; F = 2! 5P3=2; F0 = 3. The amount of the detuning and the intensity of the trapping laser beams are varied in the experiment. A diode
920 ° 2000 THE PHYSICAL SOCIETYc
(a) (b)
FIG. 1. (a) The diagram of the 87Rb energy levels. (b) The scheme of the experiment. T denotes the trapping beam andM denotes the anti-Helmholtz coil. The polarizations of the trapping beams and the current directions of the coils are indicated in the figure.
laser which has no external cavity or optical feedback from a diffraction grating is used as the trapping laser. The measured linewidth of this trapping laser diode (HL7851G) is 10 MHz. The generation of the 1-MHz trapping laser linewidth is under the condition that the trapping laser is injection-locked [5, 6] by an external-cavity diode laser (EOSI 2010). For the 10-MHz laser linewidth studied in the experiment, the trapping laser is operated without the injection locking. The repumping beam from another diode laser drives the5S1=2; F = 1! 5P3=2; F0= 2 transition with an1=e diameter of 10 mm and a power of 4 mW. All the conditions of the repumping beam are unchanged throughout the entire experiment. The trapping cell, in 2.7 cm square by 7 cm long, is made of Pyrex glass and connects to a 40-liter/s ion pump and a titanium sublimation pump. It can be vacuumed below 5£ 10¡ 11 torr. During tthe course of the experiment, the trapping cell
is filled with Rb background vapor with a pressure maintained at 4£ 10¡ 9 torr. This pressure is determined by comparing the absorption signals of an on-resonance laser beam sent through the trapping cell and the same beam sent through a saturation-pressure Rb vapor cell.
Some of the trapping conditions, such as optical alignment, beam size, and beam shape, not only can affect the number of the trapped atoms but also are difficult to reproduce if the trapping laser is replaced or relocated. In order to maintain the same trapping conditions, we change the trapping laser linewidth with injection locking technique instead of replacing the trapping laser. In the injection locking, the grating-feedback external-cavity diode laser is the master laser and the trapping laser is the slave laser. With or without the injection locking, the temperature and the current of the trapping laser diode are kept the same. The output power of the trapping laser is unaffected by the injection locking. On the other hand, the spectral characteristics of the trapping laser are locked to those of the external-cavity diode laser. We measure the linewidth of the beat
note between the trapping laser under the injection locking and another external-cavity diode laser (TUI DL100) with a RF spectrum analyzer. The measured linewidth of the beat signal is 1 MHz. This indicates that the linewidth of the trapping laser under the injection locking is less than 1 MHz. For the rest of this paper, the laser linewidth under the injection locking is referred to 1 MHz.
A small part of the trapping laser output is split for frequency stabilization. This part of the trapping laser beam is sent through an acousto-optic modulator (AOM) which shifts the laser frequency downward. The RF frequency of the AOM is kept constant. The shifted laser frequency is locked to the side of the crossover line between the5S1=2; F = 2! 5P3=2; F0 = 2 and 5S1=2; F = 2 ! 5P3=2; F0 = 3 transitions in the saturated absorption spectroscopy. By adjusting the locking position, the detuning of the trapping laser can be varied. Under the above frequency-stabilization method, the amount of the detuning or the frequency of the trapping laser can not be directly known. We determine the detuning of the trapping laser by using a reference laser. The frequency of the reference laser is modulated at an amplitude of 2.1 MHz and at a rate of 10 KHz. With the frequency modulation and the lock-in detection, the frequency of the reference laser is locked to the center of the crossover line between the F = 2! F0 = 2 and
F = 2! F0 = 3 transitions in the saturated absorption spectroscopy [7]. Therefore, the frequency
of the reference laser is 133 MHz below the F = 2! F0 = 3 transition. By measuring the beat frequency between the trapping laser and the reference laser, the detuning of the trapping laser can be determined. With or without the injection locking, the short-term jitter plus the long-term fluctuation of the beat frequency at 0.1-s gate time is always within § 0.4 MHz.
A calibrated photodiode detects the emitted fluorescence from the trapped atoms. In the steady-state, the fluorescence emission rate R is given by
R = 2¼ ¡a °
2° + 2¼ ¡a
N; (1)
where N is the number of the trapped atoms, ° is the absorption rate of an atom, and ¡a is the
natural linewidth of the5P3=2 excited state of Rb atoms. For the consideration of the finite laser linewidth, the absorption rate is described by the following equation:
° = Z 1 ¡ 1 2¼ ¡a b-2 tot=(4¼2) ¡2 a+ 4(º¡ º0)2 2¡l=¼ ¡2 l + 4(º¡ ºl)2 dº; (2)
whereb is a coefficient due to non-uniform Zeeman-level populations of the atoms trapped in the
MOT, -tot is the Rabi frequency of the total intensity of the 6 trapping laser beams, º0 is the transition frequency of the atom, ¡l is the linewidth of the trapping laser, and ºl is the center
frequency of the laser. According to the results in Refs. 7 and 8, we take b = 0.73 in the above
equation for the trapped87Rb atoms in the MOT. After evaluating the integral of Eq. (2), we get
R = 2¼ ¡a
0:73-2tot=(4¼2) ¡2
a(1 + ¡l=¡a) + 4¢ 2l=(1 + ¡l=¡a) + 0:73-2tot=(2¼2)
N; (3)
where¢ l= º0¡ ºl is the detuning of the trapping laser. Knowing the fluorescence emission rate R as well as -tot,¡l, and¢ l, we can calculate the number of the trapped atomsN with Eq. (3).
actual laser linewidth may be less than 1 MHz in that condition. At the sameN , the R of ¡l= 1
MHz is about 10% larger than the R of ¡l= 0 for the MOT situations in our experiment.
Figures 2(a) and 2(b) show the number of the trapped87Rb atoms versus the laser detuning at different magnetic-field gradients for the two laser linewidths of 1 MHz and 10 MHz. The total intensity of the six trapping beams in the MOT center is kept at 18.7 mW/cm2 for all the data
FIG. 2. The number of the trapped atoms versus the detuning at different magnetic-field gradients. Circles, asterisks, triangles, crosses, and squares are the data at the axial magnetic-field gradients of 9.8, 13.0, 16.3, 19.5, and 22.8 G/cm respectively. Solid lines are curves to guide the eye. (a) the 1-MHz laser linewidth. (b) the 10-MHz laser linewidth. The horizontal scales are in the unit of the natural linewidth. The typical error bars of all data are about§ 5% (N > 2 £ 107) and§ 10% (others).
FIG. 3. (a) The maximum number of the trapped atoms, (b) the optimum detuning, and (c) the optimum axial magnetic-field gradient versus the total laser intensity. The horizontal scales of the three figures are the same. Squares are for the 1-MHz laser linewidth and circles are for the 10-MHz laser linewidth.
in Fig. 2. The influences of the detuning and the magnetic-field gradient on the number of the trapped atoms are qualitatively similar for the two laser linewidths. In Fig. 3(a), the maximum number of the trapped atoms (Nopt) is plotted against the total laser intensity. Each data ofNopt
is taken at the optimized detuning and magnetic-field gradient for the given laser intensity and laser linewidth. The maximum number of the trapped atoms of the 10-MHz laser linewidth is about 40% less than that of the 1-MHz laser linewidth. The figure also indicates that the laser intensities used in the experiment are in the regime that the number of the trapped atoms increases linearly with the laser intensity. Figures 3(b) and 3(c) illustrate the optimum detuning and the optimum magnetic-field gradient with respect toNopt for the two laser linewidths. It is clear that
both have smaller values for the larger laser linewidth. During the measurements of the above data, the stability of the magnetic field is maintained within 0.1% or 0.01 G (whichever is larger),
and the fluctuation of the laser intensity is less than 1%. All the quoted error bars in the figures are mainly due to the noise or the variation of the fluorescence measurements, and they do not include the errors caused by the uncertainties of theb and the ¡l in Eq. (2).
We exam the experimental data with the simplified one-dimension calculation that is based on the model in Ref. [3]. The calculation does take into account the laser linewidth, which is not considered in Ref. [3]. The slowing force in the calculation is written as
F =~k · 2¼ ¡a-2=(4¼2) ¡2 a(1 + ¡l=¡a) + 4(¢ l¡ ¢B+ kv)2=(1 + ¡l=¡a) + -2=(2¼2) ¡ 2¼ ¡a -2=(4¼2) ¡2 a(1 + ¡l=¡a) + 4(¢ l+ ¢B¡ kv)2=(1 + ¡l=¡a) + -2=(2¼2) ¸ : (4)
In the above equation, ¢B is the Zeeman shift induced by the magnetic field and is
position-dependent, v is the atom velocity, k is the wave vector of the trapping laser, and - is the Rabi
frequency of a single laser beam. With the slowing force, the equation of motion of an atom is solved numerically. After knowing the motions of atoms in the MOT region, we can determine the maximum velocity (vc) of the background Rb atoms that can be captured by our MOT under
a given trapping condition. The predicted number of the trapped atoms is then given by
N = 0:1A ¾ µ vc vt ¶4 ; (5)
whereA is the surface area of the trapping region, ¾ is collision cross section between the trapped
atoms and atoms in the room-temperature Rb background gas, and vt is the average velocity of
the room-temperature Rb background gas. The relation between N and vc in the above equation
has been explained in Refs. 3 and 10. The results of the calculation show the similar trends of the atom number versus the laser detuning and versus the magnetic-field gradient as shown in Fig. 2(a) and (b). Since the calculation is only one-dimensional, discrepancies in absolute values between calculation results and experimental data are expected. Nevertheless, the predicted effects of the finite laser linewidth on the number of the trapped atoms are consistent to the experimental observations. The calculation finds that a larger laser linewidth always results in less trapped atoms and shifts the optimum detuning and the optimum magnetic-field gradient toward smaller values.
In conclusion, we have presented the experimental study of the number of the trapped atoms in a vapor-cell MOT versus the laser detuning, the magnetic-field gradient, and the laser intensity for the laser linewidths of 1 MHz and 10 MHz. Our data show that a significant number of the atoms can still be trapped in the MOT, even when the trapping laser linewidth is larger than the natural linewidth of the excited state of the driving transition. A laser with a narrower linewidth usually requires more elaborate work or is more costly. The study indicates that the MOT setup can be simplified and less expensive for experiments that do not consider the number of the trapped cold atoms critical [11].
This work is supported by National Science Council of the Republic of China under the grant of NSC 89-2112-M-007-048. We would like to thank Jow-Tsong Shy for useful discussions. We are also grateful to Jow-Tsong Shy, Tom T. Chen, and Ya-Chang Chou for loaning us instruments and to Tien Ho Hung for constructing the trapping cell.
References
[ 1 ] E. L. Raab, M. Prentiss, A. Cable, S. Chu, and D. E. Pritchard, Phys. Rev. Lett. 59, 2631 (1987). [ 2 ] C. Monroe, W. Swann, H. Robinson, and C. Wieman, Phys. Rev. Lett. 65, 1571 (1990).
[ 3 ] K. Lindquist, M. Stephens, and C. Wieman, Phys. Rev. A46, 4082 (1992).
[ 4 ] S. K. Tung, Y. C. Chen, C. W. Lin, L. Hsu, and I. A. Yu, Chinese J. Phys. (Taipei)38, 395 (2000). [ 5 ] L. Goldberg, H. F. Taylor, J. F. Weller, and D. M. Bloom, Electron. Lett. 19, 491 (1983).
[ 6 ] M. Snadden, R. B. M. Clarke, and E. Riis, Opt. Lett. 22, 892 (1997). [ 7 ] J. Ye, S. Swartz, P. Jungner, and J. L. Hall, Opt. Lett. 21, 1280 (1996).
[ 8 ] C. G. Townsend, N. H. Edwards, C. J. Cooper, K. P. Zetie, C. J. Foot, A. M. Steane, P. Szriftgiser, H. Perrin, and J. Dalibard, Phys. Rev. A 52, 1423 (1995).
[ 9 ] C. Gabbanini, A. Evangelista, S. Gozzini, A. Lucchesini, A. Fioretti, J. H. Muller, M. Colla, and E. Arimondo, Europhys. Lett. 37, 251 (1997).
[10] C. Monroe, H. Robinson, and C. Wieman, Opt. Lett. 16, 50 (1991).
[11] Y. C. Chen, C. W. Lin, and I. A. Yu, Phys. Rev. A61, 053805 (2000). As an example, the linewidth of the trapping laser is about 10 MHz in that work.