Mini-Nutritional Assessment (MNA) is useful for assessing the nutritional status of patients with chronic obstructive pulmonary disease: A cross-sectional study
Min-Fang Hsua, Shu-Chuan Hobc, Han-Pin Kuobd, Jiun-Yi Wanga, Alan C. Tsaiae*
aDepartment of Healthcare Administration, Asia University, Wufeng, Taichung, Taiwan bDepartment of Thoracic Medicine, Chang Gung Memorial Hospital, Chang Gung University
College of Medicine, Taoyuan, Taiwan
cSchool of Respiratory Therapy, College of Medicine, Taipei Medical University, Taipei, Taiwan dDepartment of Medicine, Chang Gung University College of Medicine, Taoyuan, Taiwan
eDepartment of Health Services, School of Public Health, China Medical University, Taichung,
Taiwan
Disclosures: Min-Fang Hsu and Shu-Chuan Ho contributed equally to this paper
*Please send all correspondence to:
Alan C. Tsai, PhD
Professor, Department of Healthcare Administration, Asia University, 500 Liufeng Rd., Wufeng, Taichung 41354, Taiwan
Tel: 886 4 2332 3456 x1943, Fax: 886 4 2332 1206. E-mail: atsai@umich.edu
Running head: Nutritional assessment in COPD
Keywords: COPD, Body composition, Anthropometric, Mini Nutritional Assessment, Nutritional status, Exercise capacity
1 2 3 4 5 6 7 8 9 10 11 12 13 14 15 16 17 18 19 20 21 22 23 24
1
Abstract
Malnutrition is prevalent in patients with chronic obstructive pulmonary disease (COPD) but is often neglected in clinical practice. This study examined the usefulness of the Mini Nutritional Assessment (MNA) for assessing the nutritional status of patients with COPD. We recruited 83 patients with COPD in stable condition from the pulmonary rehabilitation unit of a medical center in northern Taiwan. Each patient was interviewed with a structured questionnaire to elicit personal and health-related data, and measured for anthropometric and blood
biochemical indicators. Nutritional status was rated with two Taiwanese-specific versions of the MNA, MNA-T1 and MNA-T2. Fat-free mass was measured with bioelectrical impedance analysis (BIA), and exercise capacity indicators with the 6-Minute Walk Test. The two MNA versions showed high agreement (kappa=0.949) in predicting the nutritional risk, and both versions predicted the FFMI well (area under the curve of the Receiver Operating Characteristics = 0.804, p<0.001 for MNA-T1; and 0.813, p<0.001 for MNA-T2). MNA scores decreased with increasing disease severity and were highly correlated with FFMI, BMI, mid-arm circumference, calf circumference, and oxygen saturation at rest and during exercise (all p0.01). The MNA score was positively correlated with FEV1, FVC and 6-minute walking distance, and negatively
correlated with GOLD stages (all p<0.05). However, the MNA score was not significantly correlated with blood biochemical indicators, perhaps due to inflammatory status associated with COPD. The MNA appears appropriate for rating the nutritional risk of patients with COPD. Routine use of the MNA may help reduce the risk of malnutrition in patients with COPD.
5 6 25 26 27 28 29 30 31 32 33 34 35 36 37 38 39 40 41 42 43 44
1. Introduction
Chronic obstructive pulmonary disease (COPD) is characterized by airflow limitation that is not fully reversible. Body weight loss and muscle wasting is often a common and serious
problem with poor prognosis and malnutrition is a systemic manifestation in these patients. COPD decreases muscle strength especially the diaphragm, reduces exercise capacity, and weakens immunity of the respiratory system, resulting in increased risk of mortality.
Although malnutrition is common in patients with COPD, nutritional assessment is not carried out routinely and often ignored in clinical settings. Ideal nutritional marker or gold standard for diagnosis of nutritional risk for these patients is not yet available. Because weight loss, especially lean body mass is a common problem in patients with COPD [1], clinicians often use anthropometric or biochemical indicators to get a feeling of their nutritional status. Percent of ideal body weight, mid-arm circumference (MAC) and triceps skinfolds thickness were often the indicators used to gauge nutritional changes in these patients [2] and a multi-indicator method including albumin, prealbumin, total lymphocyte count, percent of ideal body weight, triceps skinfolds thickness, mid-arm circumference and BMI has been used to compute a nutritional index to confirm the diagnosis [3-6]. While these methods may yield satisfactory results and successfully identify the nutritional status of patients with COPD, the process is time consuming, expensive and impractical for routine clinical practice.
Bioelectrical impedance analysis (BIA) is a method that determines lean and fat body compartments. It has been used to assess body composition of patients with COPD [7-9]. Using BIA, body fat-free mass index (FFMI), ≤15kg/m2 for women and ≤16kg/m2 for men, has been
derived to suggest muscle depletion in patients with COPD [10-12]. However, few families are equipped with BIA.
In recent decades, several measurement scales have been developed for rating the 45 46 47 48 49 50 51 52 53 54 55 56 57 58 59 60 61 62 63 64 65 66 67 68
3
nutritional status of elderly persons. The Mini-Nutritional Assessment (MNA) is one of the most widely used ones. It is a simple, low-cost, fast and non-invasive tool that has been shown to perform well in elderly living in various settings or with various health conditions [13]. The MNA consists of 18 items and evaluates 4 areas of nutritional status--anthropometric, dietary, global and self-rated status. A normalized version (MNA-T1) has been developed for Taiwanese elderly by adopting population-specific anthropometric cutoff points. An alternative version that replaced calf circumference (CC) for BMI (MNA-T2) was also developed [14]. These
Taiwanese-specific versions have been shown to be suitable for assessing the nutritional status of elderly Taiwanese living in various settings [15, 16] or with various health conditions [17].
A few recent reports have used the MNA to evaluate the nutritional risk of patients with COPD [18-21]. However, the appropriateness of using the MNA to screen for nutritional risk in patients with COPD has not been robustly examined. Thus, we conducted this study to determine the appropriateness of using the MNA for assessing the nutritional risk of patients with COPD.
2. Methods
2.1. Design and Subjects
We recruited 83 (79 males and 4 females) patients with COPD from the pulmonary rehabilitation unit of a medical center in northern Taiwan to serve as study subjects during November 2009 to April 2011. The diagnosis of COPD and the grading of the severity of the disease were based on the 2007 version of the Global Initiative for Chronic Obstructive Lung Disease (GOLD)
guidelines [22]. Only non-hospitalized patients who were able to communicate verbally and without acute infection or exacerbation during the study period were allowed to participate. The study protocol was approved by the Ethics Committee of the Chang-Gung Memorial Hospital (No.98-3601B) and conducted according to the guidelines laid down in the Declaration of
13 14 69 70 71 72 73 74 75 76 77 78 79 80 81 82 83 84 85 86 87 88 89 90 91 92
Helsinki. All participants signed a consent form in the presence of a nursing staff and family members.
2.2. Outcome measurements
Each participant underwent a person-to-person interview with a structured questionnaire for eliciting personal, demographic, lifestyle and disease-related data and answers to items in the MNA. Each subject was also measured for anthropometric indicators and body composition, and taken a fasting blood specimen for measuring blood/serum biochemical indicators. Weight, height, MAC and CC were measured according to standard methods [23]. Bioelectrical impedance analysis (TANITA’s, BF-800 Body Fat Monitor, Tokyo, Japan) was performed to determine percentage of body fat. Fat-free mass was calculated from body weight minus fat mass. FFMI was calculated according to fat-free mass (kg)/height (m)2. Hemoglobin, total
lymphocyte count, and serum albumin and C-reactive protein (CRP) concentrations were measured in the clinical laboratories of the hospital.
The nutritional status of each patient was rated with both versions of the MNA. The MNA has a maximum score of 30. A score 16.5 suggests malnourishment; 17-23.5 suggests at risk of malnutrition, and 24 suggests normal [14]. Lung function indicators including FVC and FEV1
were measured with a spirometer (SpiroAnalyzer ST-250, Fukuda Sangyo, Tokyo, Japan). Each subject was also evaluated for exercise capacity with the 6-Minute Walk Test (6-MWT)
according to American Thoracic Society guidelines [24]. Patients were instructed to walk as far as possible but were allowed to stop and rest when necessary. During the test, pulse oxygen saturation (SaO2) was continuously monitored with a finger pulse oximeter (BCI, 3301,
Wisconsin, USA). 2.3. Statistical analysis 93 94 95 96 97 98 99 100 101 102 103 104 105 106 107 108 109 110 111 112 113 114 115
5
Data were analyzed with PASW Statistics 18.0 (SPSS Inc., Chicago, IL). Simple descriptive statistics such as mean and standard deviation or percentage were calculated for continuous or categorical data. Kappa statistic was performed to evaluate the agreement of the two MNA versions in discriminating the nutritional status. Receiver operating characteristic (ROC) curves were generated for both MNA versions using the FFMI as a reference. The area under the curves (AUC) was used to indicate the discriminating ability by each scale. Pearson's correlation
analysis was performed to determine the strength of relationship of age, anthropometric, biochemical, lung function (FEV1 and FVC), physical functional and health-related parameters
with the MNA scores whereas Spearman's correlation analysis was performed to determine the relationship between the severity of COPD (GOLD stages) with the MNA scores. The level of significance for all statistical tests was set at alpha = 0.05.
3. Results
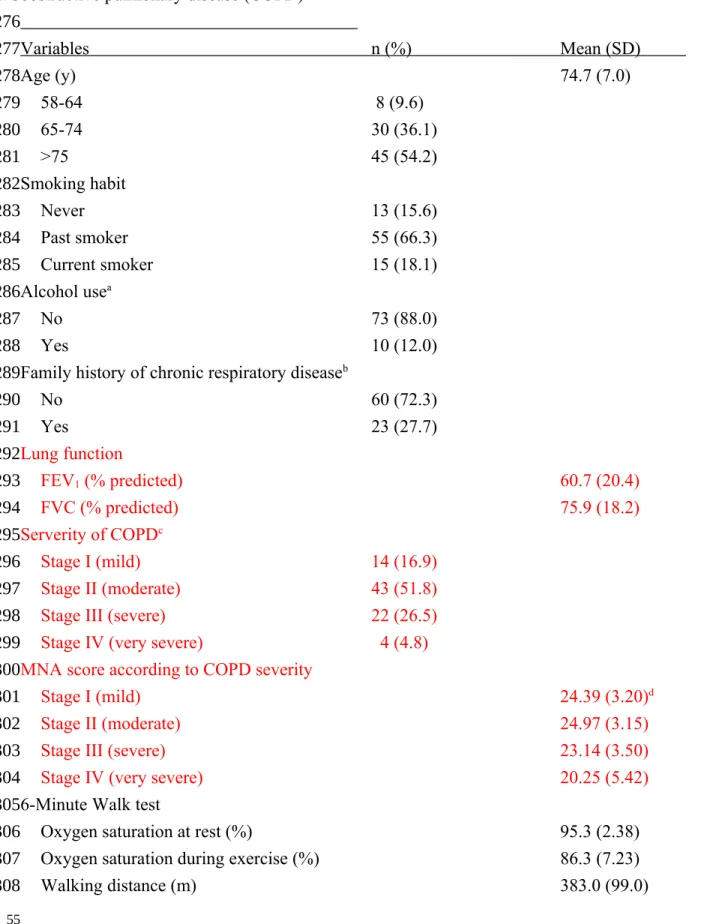
Table 1 shows the characteristics and the status of health indicators of subjects. Most subjects (75/83) aged over 65 years; 55 (66%) were past smokers and 15 (18%) were current smokers; Average FEV1 % predicted was 60.7 20.4%, and FVC % predicted was 75.6
18.2%. Fourteen subjects (16.9%) had mild, 43 (51.8%) had moderate, 22 (26.5%) had severe and 4 (4.8%) had very severe airway obstruction according to GOLD guidelines. The MNA scores were generally lower with increasing COPD severity. The average BMI was 23.7 3.9 kg/m2, and FFMI was 17.8 2.5 kg/m2. Only 12 patients (14.4%) were <90% of ideal weight,
and 15 (19.2%) were <4g/dL (averaged 4.3 0.3 g/dL) in serum albumin. Average CRP was 9.9 ± 17.3 mg/L.
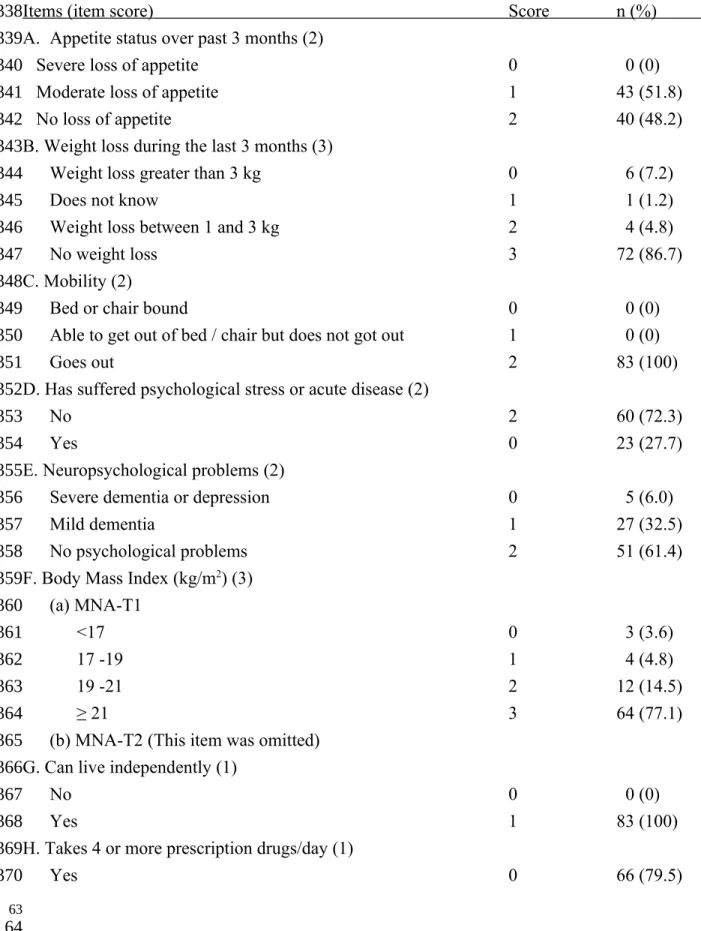
Table 2 shows the MNA item score patterns. Forty-three patients (51.8%) had moderate loss of appetite over the past 3 months; 10 (12.0%) had weight loss ≥1 kg; 23 (27.7%) had
21 22 116 117 118 119 120 121 122 123 124 125 126 127 128 129 130 131 132 133 134 135 136 137 138 139
psychological stress or acute disease; 66 (79.5%) were on ≥4 prescription drugs; about a quarter of patients consumed inadequate protein-rich foods or fruits/vegetable; nearly half (48.2%) did not consume enough water; 43.4% thought self as malnourished or were unsure about their nutritional state; and 42.2% thought self had poorer health relative to peers or were unsure about own health status. MNA-T1 rated 4 (4.8%) as malnourished, 28 (33.7%) as at risk of
malnutrition, and 51 (61.4%) as normal; whereas MNA-T2 rated 4 (4.8%) as malnourished, 26 (31.3%) as at risk of malnutrition, and 53 (63.9%) as normal. Kappa = 0.949 for the two versions (p<0.001) (Table 3).
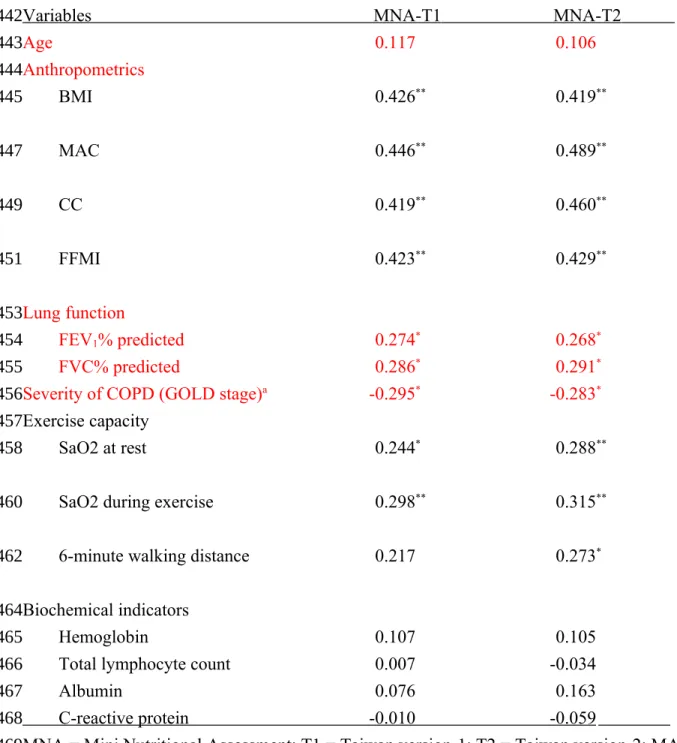
Table 4 shows the correlations the MNA scores with age and various COPD-related
indicators. The scores of both MNA versions were significantly correlated with BMI, MAC, CC, FFMI, FEV1, FVC, and O2 saturation at rest or during exercise (all p<0.05), but not with age and
blood biochemical indicators (all p>0.05) on the basis of Pearson's correlation. The scores of both MNA versions were also correlated with GOLD stages on the basis of Spearman's
correlation. 6MWD was correlated with the score of MNA-T2 but not MNA-T1 on the basis of Pearson's correlation (p<0.05).
Fig. 1 shows the ROC generated for MNA-T1 and -T2 in predicting FFMI of patients with COPD. The AUC of ROC was 0.804, (95% CI = 0.673-0.935, p<0.001) for MNA-T1 and 0.813, 0.686-0.940, p<0.001 for MNA-T2 (FFMI was sex-adjusted).
4. Discussion
Results show the MNA predicts the FFMI (a widely used nutritional indicator for patients with COPD) well and the MNA score is significantly correlated with most other anthropometric indicators or exercise capacity/pulmonary functional indicators. Thus, the MNA appears to be an appropriate tool for rating the nutritional status of patients with COPD. However, the MNA 140 141 142 143 144 145 146 147 148 149 150 151 152 153 154 155 156 157 158 159 160 161 162 163
7
scores were not significantly (p>0.05) correlated with blood biochemical indicators. 4.1. Validating the MNA for rating patients with COPD
Without a universally accepted gold standard, we used a divergent list of anthropometric,
lung function, exercise capacity, and biochemical markers, especially FFMI as reference standards for the validation. We found that MNA scores were significantly correlated with all anthropometric indices examined including FFMI, BMI, MAC and CC. Patients with COPD generally have lower fat-free mass compared to healthy elderly [25]. Depletion of fat-free mass is associated with impaired peripheral muscle strength [12] and FFMI is an independent
predictor of mortality in patients with COPD [26] and also a stronger predictor of mortality than BMI [27]. In patients with COPD, muscle wasting is common, thus fat-free mass is an important nutritional indicator [7, 28]. We used FFMI as the major reference standard for rating the
functional ability of the MNA. BMI is probably the most frequently used indicator of general nutritional status, especially for the elderly. Higher BMI has been shown to be a better predictor of long-term survival in patients with acute exacerbation in patients with COPD [29].
Furthermore, patients with COPD with lower BMI took longer time to improve symptoms and had longer hospital stay [1]. MAC reflexes body muscle mass and subcutaneous fat and it complements BMI in the diagnosis of protein-energy malnutrition and mid-arm muscle area and it is a better predictor of mortality than BMI in patients with stable COPD [30]. CC is a major biomarker of malnutrition in hospitalized elderly patients [31]. It can reflect nutritional status, lean body mass, functional activity and general health conditions in elderly population better than BMI or MAC [32]. Results suggest that the MNA predicts FFMI well and the MNA scores are highly correlated with anthropometric indicators examined in these patients.
4.2. Rating the nutritional status with the MNA
Both MNA versions rated 4.8% (4/83) of patients with COPD as malnourished and roughly
29 30 164 165 166 167 168 169 170 171 172 173 174 175 176 177 178 179 180 181 182 183 184 185 186 187
one-third were as at risk of malnutrition. Cross-tabulation test (combining malnourished and at risk vs. normal) showed that the two versions have high agreement (kappa = 0.949). The MNA scores were also significantly correlated (p<0.05) with all anthropometric and most exercise capacity markers.
To date, only a few studies have used the MNA to rate the nutritional status of patients with COPD. Odencrants et al. [19] rated 50 patients with COPD admitted to an acute care hospital with the MNA and found all but two were malnourished or at risk of malnutrition. Scichilone et al. [20] observed that the MNA score was associated with dyspnoea in 32 ≥60-year old patients with COPD. Benedik et al. [18] found that 14% of patients with COPD were malnourished and another 55% were at risk of malnutrition, and there was a positive correlation between MNA score and lean body mass. Battaglia et al. [33] suggested that the MNA was valuable for gaining an insight into the nutritional problems in patients with COPD, and might provide useful clues for treatment strategies. Yuceege et al. [21] rated 60 male patients with COPD from outpatient clinics with SGA and MNA. They found that the MNA identified more patients as malnutrition than SGA and suggested that SGA and MNA could be used for the evaluation of the nutritional state in patients with COPD. The present study has further shown that the MNA predicts FFMI of patients with COPD well and their MNA scores are significantly (p<0.05) correlated with most other anthropometric, lung function and exercise capacity indicators.
4.3. Rating lung function with the MNA
Our results suggest that the MNA is capable of predicting lung function capacity in patients with COPD. The MNA score is significantly correlated with FEV1, FVC and GOLD stages of
COPD patients. This finding is generally in line with the observations of earlier studies. Steuten et al. [9] observed that COPD stage 4 patients had lower BMI compared to less severe patients.
188 189 190 191 192 193 194 195 196 197 198 199 200 201 202 203 204 205 206 207 208 209 210
9
Gupta et al. [1] found the correlation between body weight and FEV1/FVC% was good and the
correlation between BMI and FEV1was statistically significant among patients in hospital with
COPD acute exacerbation.Yuceege et al. [21] found FEV1 and FVC values were less in the
malnourished group evaluated with the SGA, but not with the MNA in male patients with COPD. Exercise capacity is important in patients with COPD and it also reflects their nutritional status. We observed that the score of both versions of the MNA were significantly (p<0.05) correlated with O2 saturation at rest and during exercise and with 6MWD, an indicator
of exercise capacity. MNA-T2 shows slightly stronger correlations with all three indicators than MNA-T1. Clinical observations suggest that exercise limitation in patients with COPD might be related to their weakening in lung function and worsening of nutritional conditions [8,34].
The present study observed no significant correlation between the MNA score and serum albumin or other biochemical indicators (all p>0.05). Similar findings have also been observed by others. Braun et al. [2] found that albumin was only slightly reduced and prealbumin was within the normal range in patients with COPD. Giron et al. [35] observed that serum albumin values remained normal in most (82%) of hospitalized patients with COPD. Gupta et al. [36] found that nutritional status of patients with COPD newly admitted for hospitalization rated with the Subjective Global Assessment (SGA) was not correlated with albumin or any other blood nutritional indicators. Even in the severely malnourished patients, serum albumin was within the normal range (averaged 4.08 g/dL). Gupta et al. [1] further showed that serum total protein, albumin, urea and creatinine were all within the normal ranges in patients with COPD admitted in hospital with acute exacerbation. Yazdanpanah et al. [37] found that serum albumin was associated with the severity of the disease (GOLD stages), but was only minimally reduced, from 4.43 mg/dL for stage 2 patients to 4.06 and 3.6 mg/dL for stages 3 and 4, respectively. Thus,
37 38 211 212 213 214 215 216 217 218 219 220 221 222 223 224 225 226 227 228 229 230 231 232 233
Batres et al. [38] concluded that biochemical parameters including serum albumin, prealbumin and transferrin were generally not useful for assessing nutritional status in patients with COPD and suggested that the reason might be because these indicators are influenced by non-nutritional factors, such as infections and renal or hepatic disease. Inflammation, hydration status and medication especially corticosteroids may also play a role [39].
4.4. Limitations of the study
This study has some limitations. (a) Subjects were recruited from one hospital and therefore might not represent the entire spectrum of patients with COPD in Taiwan. (b) The prevalence of COPD in female was relatively low. We were able to recruit only four female patients. This small sample size may not accurately reflect the status of female subjects. Further confirmation with larger samples is needed. (c) Most subjects were elderly adults and some might have difficulty in correctly recalling certain information in the MNA questionnaire. This might have a slight impact on the accuracy of the MNA score. (d) The full MNA involves more
items/questions compared to the SGA or single item indicators such as FFMI or FVC1. Thus, it
may have greater chance of revealing nutritional inadequacy at an earlier stage than other tools/indicators. However, more items mean more time consuming which is an important factor in today's clinical settings.
5. Conclusion
Our results suggest that both MNA-T1 and MNA-T2 appear appropriate for assessing the nutritional status of patients with COPD. Nutritional scores rated with both versions correlated well with most nutrition-related anthropometric and pulmonary function indicators. The MNA appears appropriate not only for rating the nutritional status but also for suggesting exercise capacity of patients with COPD. Since patients with COPD may have greater risk of malnutrition
234 235 236 237 238 239 240 241 242 243 244 245 246 247 248 249 250 251 252 253 254 255 256 257
11
than their non-COPD counterparts, routine screening with the MNA may enhance timely intervention to prevent the development of malnutrition in these patients.
Acknowledgements
The study was supported by a grant from the Chang-Gung Memorial Hospital
(CMRPG391921). The authors wish to thank the Pulmonary Rehabilitation unit of the Chang Gung Memorial Hospital at Linkou and the participants for their collaboration during the course of this study. MFH and SCH conceived the idea, designed and carried out the study, performed statistical analyses, and drafted the manuscript. HPK directed and supervised the study. JYW provided statistical advice; ACT directed the nutritional assessment; and both interpreted the results and edited the manuscript. All authors read and approved the final version of the manuscript.
Declaration of Interest
All authors declare no conflict of interest involved in this study.
45 46 258 259 260 261 262 263 264 265 266 267 268 269 270 271 272
References 273
13
Table 1. Basic characteristics and functional and nutritional status of 83 patients with chronic obstructive pulmonary disease (COPD)
Variables n (%) Mean (SD) Age (y) 74.7 (7.0) 58-64 8 (9.6) 65-74 30 (36.1) >75 45 (54.2) Smoking habit Never 13 (15.6) Past smoker 55 (66.3) Current smoker 15 (18.1) Alcohol usea No 73 (88.0) Yes 10 (12.0)
Family history of chronic respiratory diseaseb
No 60 (72.3) Yes 23 (27.7) Lung function FEV1 (% predicted) 60.7 (20.4) FVC (% predicted) 75.9 (18.2) Serverity of COPDc Stage I (mild) 14 (16.9) Stage II (moderate) 43 (51.8)
Stage III (severe) 22 (26.5)
Stage IV (very severe) 4 (4.8)
MNA score according to COPD severity
Stage I (mild) 24.39 (3.20)d
Stage II (moderate) 24.97 (3.15)
Stage III (severe) 23.14 (3.50)
Stage IV (very severe) 20.25 (5.42)
6-Minute Walk test
Oxygen saturation at rest (%) 95.3 (2.38)
Oxygen saturation during exercise (%) 86.3 (7.23)
Walking distance (m) 383.0 (99.0) 53 54 274 275 276 277 278 279 280 281 282 283 284 285 286 287 288 289 290 291 292 293 294 295 296 297 298 299 300 301 302 303 304 305 306 307 308
Anthropometrics BMI (kg/m2) 23.7 (3.86) Mid-arm circumference (cm) 26.5 (3.40) Calf-circumference (cm) 33.1 (3.36) Body composition % body fat 24.28 (5.89)
Fat-free mass index (kg/m2) 17.81 (2.45)
Distribution by % of ideal body weight
<90% 12 (14.5)
90-110% 37 (44.6)
>110% 34 (41.0)
Blood biochemical indicators
Hemoglobin (g/dL) 13.86 (1.85)
Total lymphocyte count (n/L) 1883 (775)
Albumin (g/dL) Average 4.32 (0.31) ≥4 g/dL 63 (80.8) <4 g/dL 15 (19.2) C-reactive protein (mg/L) 9. 91 (1 7 . 3 ) FEV1 = force expiratory volume in 1 second (an indicator of the severity of COPD) aAt least once/week
bIncluding parents, grandparents and siblings having COPD, asthma, bronchiectasis, or lung
cancer.
cAccording to GOLD (2007), Stage I (mild) is defined as FEV
1 ≥80% of predicted ; Stage II
(moderate) as 50%-79%; Stage III (severe) as 30-49%; and stage IV (very severe) as <30%. In all stages, FEV1/FVC is <0.7.
dAccording to MNA-T2. 309 310 311 312 313 314 315 316 317 318 319 320 321 322 323 324 325 326 327 328 329 330 331 332 333 334 335
15
Table 2. MNA item-score patterns of 83 patients with chronic obstructive pulmonary disease
Items (item score) Score n (%) A. Appetite status over past 3 months (2)
Severe loss of appetite 0 0 (0)
Moderate loss of appetite 1 43 (51.8)
No loss of appetite 2 40 (48.2)
B. Weight loss during the last 3 months (3)
Weight loss greater than 3 kg 0 6 (7.2)
Does not know 1 1 (1.2)
Weight loss between 1 and 3 kg 2 4 (4.8)
No weight loss 3 72 (86.7)
C. Mobility (2)
Bed or chair bound 0 0 (0)
Able to get out of bed / chair but does not got out 1 0 (0)
Goes out 2 83 (100)
D. Has suffered psychological stress or acute disease (2)
No 2 60 (72.3)
Yes 0 23 (27.7)
E. Neuropsychological problems (2)
Severe dementia or depression 0 5 (6.0)
Mild dementia 1 27 (32.5)
No psychological problems 2 51 (61.4)
F. Body Mass Index (kg/m2) (3)
(a) MNA-T1
<17 0 3 (3.6)
17 -19 1 4 (4.8)
19 -21 2 12 (14.5)
≥ 21 3 64 (77.1)
(b) MNA-T2 (This item was omitted) G. Can live independently (1)
No 0 0 (0)
Yes 1 83 (100)
H. Takes 4 or more prescription drugs/day (1)
Yes 0 66 (79.5) 61 62 336 337 338 339 340 341 342 343 344 345 346 347 348 349 350 351 352 353 354 355 356 357 358 359 360 361 362 363 364 365 366 367 368 369 370
No 1 17 (20.5) I. Pressure sore or skin ulcers (1)
Yes 0 2 (2.4)
No 1 81 (97.6)
J. Number of full meals the patient eats daily (2)
1 0 0 (0)
2 1 7 (8.4)
3 2 76 (91.6)
K. Consumption of protein-rich foods every day (1)
0 or 1 “yes” 0 5 (7.2)
2 “yes” 0.5 15 (18.1)
3 “yes” 1 62 (74.7)
L. Consumes ≥2 servings of fruits or vegetables/day (1)
No 0 20 (24.1)
Yes 1 63 (75.9)
M. Cups of fluid/water consumed/day (1)
<3 0 0 (0)
3-5 0.5 40 (48.2)
>5 1 43 (51.8)
N. Mode of feeding (2)
Unable to eat without assistance 0 0 (0)
Self-fed with some difficulty 1 0 (0)
Self-fed without any problem 2 83 (100)
O. Self-view of nutritional status (2)
View self as being malnourished 0 25 (30.1)
Uncertain of nutritional state 1 11 (13.3)
Views self as having no nutritional problem 2 47 (56.6) P. Self-rated health status (2)
Not as good 0 32 (38.6)
Does not know 0.5 3 (3.6)
As good 1 26 (31.3) Better 2 22 (26.5) Q. Mid-arm circumference (cm) (a) MNA-T1 (1) <22.5/<21 0 9 (10.8) 371 372 373 374 375 376 377 378 379 380 381 382 383 384 385 386 387 388 389 390 391 392 393 394 395 396 397 398 399 400 401 402 403 404 405
17 22.5-23.4/21-21.9 0.5 9 (10.8) ≥23.5/≥22 1 65 (78.3) (b) MNA-T2 (2) <22.5/<21 0 9 (10.8) 22.5-23.4/21-21.9 1 9 (10.8) ≥23.5/≥22 2 65 (78.3) R. Calf circumference (cm) (a) MNA-T1 (1) <28/<25 0 5 (6.0) ≥28/≥25 1 78 (94.0) (b) MNA-T2 (3) <28/<25 0 5 (6.0) 28-29/25-26 1 2 (2.4) 29-30/26-27 2 5 (6.0) ≥ 30/ ≥ 27 3 71 (85.5) MNA = Mini Nutritional Assessment; T1 = Taiwan version-1; T2 = Taiwan version-2.
MNA-T1 rated 4 (4.8%) patients as malnourished (MNA score ≤16.5), 28 (33.7%) as at risk of malnutrition (MNA score 17-23.5) and 51 (61.4%) as normal (MNA score ≥24), whereas MNA-T2 rated 4 (4.8%) patients as malnourished, 26 (31.3%) as at risk of malnutrition and 53 (63.9%) as normal. 69 70 406 407 408 409 410 411 412 413 414 415 416 417 418 419 420 421 422 423 424 425
Table 3. Cross-tabulation test of the nutritional scores between MNA-T1 and MNA-T2 of 83 patients with chronic obstructive pulmonary disease
MNA-T1
Item Undernutrition* Normal
MNA-T2
Undernutrition* 30 (93.8) 0 (0)
Normal 2 (6.2) 51 (100)
Kappa (95% CI) 0.9 49 (0.878-1.000)
MNA = Mini Nutritional Assessment; T1 = Taiwan version-1; T2 = Taiwan version-2.
*Including those rated as malnutrition or at risk of malnutrition.
426 427 428 429 430 431 432 433 434 435 436 437 438
19
Table 4. Correlation coefficients (r) of MNA scores with anthropometric, biochemical and pulmonary function status of 83 patients with chronic obstructive pulmonary disease
Variables MNA-T1 MNA-T2
Age 0.117 0.106 Anthropometrics BMI 0.426** 0.419** MAC 0.446** 0.489** CC 0.419** 0.460** FFMI 0.423** 0.429** Lung function FEV1% predicted 0.274* 0.268* FVC% predicted 0.286* 0.291*
Severity of COPD (GOLD stage)a -0.295* -0.283*
Exercise capacity
SaO2 at rest 0.244* 0.288**
SaO2 during exercise 0.298** 0.315**
6-minute walking distance 0.217 0.273*
Biochemical indicators
Hemoglobin 0.107 0.105
Total lymphocyte count 0.007 -0.034
Albumin 0.076 0.163
C-reactive protein -0 .010 -0 .059 MNA = Mini Nutritional Assessment; T1 = Taiwan version-1; T2 = Taiwan version-2; MAC = Mid-arm circumference; CC = Calf circumference; FFMI = Fat-free mass index; SaO2 = Oxygen saturation
aAll correlations, except COPD stages, were based on Pearson's correlation analysis. COPD
stages was based on Spearman’s correlation analysis
77 78 439 440 441 442 443 444 445 447 449 451 453 454 455 456 457 458 460 462 464 465 466 467 468 469 470 471 472 473
*p<0.05, **p<0.01. 474
21
Figure legends:
Fig. 1. Receiver operating characteristic (ROC) curves generated for the MNA-T1 ( ) and MNA-T2 ( ) scores against fat-free mass index using 16 kg/m2 and15 kg/m2 as cutoffs for men
and women, respectively.
85 86 475 476 477 478