Title: Factors related to continuing care and interruption of P4P program participation in patients with diabetes
Running Title: P4P Program for Diabetes Care
Suh-May Yen, MD, MHA1,2; Pei-Tseng Kung, Sc.D3,#;Yi-Jing Sheen, MD, MHA4,
Li-Ting Chiu, MHA1; Xing-Ci Xu, MHA1;Wen-Chen Tsai, Dr.PH1,#,*;
1. Department of Health Services Administration, China Medical University, Taichung, Taiwan, ROC
2. Department of Chinese Medicine, Nantou Hospital, Nantou, Taiwan, ROC 3. Department of Healthcare Administration, Asia University, Taichung, Taiwan,
ROC
4. Division of Endocrinology and Metabolism, Taichung Hospital, Ministry of Health and Welfare
# Authors had equal contribution to this work.
*Correspondence author:Professor Wen-Chen Tsai, Dr.PH
Address:No. 91 Hsueh-Shih Road, Taichung, Taiwan 40402, R.O.C Tel:886-4-22073070
Fax:886-4-22028895
E-mail: wtsai@mail.cmu.edu.tw
Table of contents
Analyzing factors associated with continuing care participation in diabetes mellitus patients and with interrupted participation in diabetes pay-for-performance (P4P) program in enrolled DM patients
This study examined factors associated with continuing care participation in diabetes mellitus (DM) patients and with interrupted participation in diabetes
pay-for-performance (P4P) program in enrolled DM patients.
1.Taiwan’s P4P program increased the rate of continuing care in DM patients
2. Factors that correlated with DM patients' participation in continuing care included the patient’s P4P program enrollment status, personal characteristics, health status, characteristics of the main physician, and characteristics of the main health care organization.
3. Factors associated with interrupted DM patient participation in the P4P program after enrollment included male gender, younger age (<35), residence in areas of the highest urbanization level, greater severity of diabetes complications, presence of catastrophic illness or injury, older age (≥55) and high service volume in the main physician, having a regional or private hospital as the main health care organization, and change of physician.
Funding Source:
This study was funded by China Medical University and Asia University, and
National Science Council (grant numbers: CMU103-S-17, NSC101-2410-H-039-002-MY2). Number of pages: 30 Number of references: 45 Number of figures: 0 Number of tables: 4 Word count: 3,696
Abstract
Objectives: To examine factors that influenced continuing care participation in diabetes mellitus (DM) patients and factors contributing to interrupted participation in a diabetes pay-for-performance (P4P) program in enrolled DM patients in Taiwan. Study Design: Retrospective cohort analysis.
Methods: Data were obtained from Taiwan’s National Health Insurance Research Database on patients with a new confirmed diagnosis of type 2 DM during 2001– 2008, selected as 1:1 propensity score–matched P4P program enrollees and non-enrollees (totaling 396,830). Logistic regression was performed to analyze factors associated with continuing care participation and with interrupted P4P program participation after enrollment.
Results: Among the DM patients, P4P program enrollees were 4.27 times (95% CI=4.19–4.36) as likely to participate in continuing care as non-enrollees. Factors affecting the DM patients’ participation in continuing care included P4P program enrollment status, personal characteristics, health status, characteristics of the main physician, and characteristics of the main health care organization. Interruption of P4P program participation occurred in 78,759 (44.33%) of the enrolled DM patients and was correlated with male gender, younger age (<35), residence in areas of highest urbanization, greater severity of diabetes complications, presence of catastrophic illness/injury, high service volume and older age (≥55) in the main physician, having a regional or private hospital as the main health care organization, and change of physician.
Conclusions: Taiwan’s diabetes P4P program increased continuing care participation in DM patients. The rate of interruption of P4P program participation among enrolled DM patients, at 44.33%, should be a focus of improvement for Taiwan’s health authorities.
Key Words: Pay for performance, diabetes, continuing care, National Health Insurance
In 2013, an estimated 382 million people worldwide had diabetes mellitus (DM), which resulted in at least 548 billion USD in health expenditure. The number of people with DM is expected to rise to 592 million by 2035.1 Previous studies have shown DM prevention and management to be a challenging problem. Better
continuity of care has been associated with improved medication compliance, reduced hospitalizations, reduced emergency department visits,8 reduced mortality,9 and reduced health care expenses for DM patients.
Pay-for-performance (P4P) is a payment scheme that rewards health care
providers for providing high-quality continuing care services. In many countries (such as the United States, Australia, Germany, and the United Kingdom), P4P programs are a priority policy for promoting more efficient use of health care resources and enhancing the quality of care.13-15
In Taiwan, 7% of the population, or 1,631,599 individuals, have DM as of 2012, which costs 3.8% of the National Health Insurance program’s total annual health care expenditure. To improve the prevention and treatment of DM, Taiwan launched a diabetes P4P program in November 2001. As part of this program, a team of care providers, consisting of physicians, nurses, nutritionists, and other health care professionals, work together to provide examination, testing, health education, and follow-up services in an effort to reduce the occurrence of diabetic complications and comorbidities.18 Health care organizations participating in the program must perform specific diagnosis and management tasks, including medical history, physical
examination, laboratory evaluation, evaluation of the management plan, and diabetes self-management education. Patients who are enrolled in the diabetes P4P program must undergo a complete annual evaluation of their disease. If health care services have been provided as required by the program, the health care organization will
receive a bonus payment (a value-added physician examination fee and a case management fee). For Taiwan’s diabetes P4P program, the amount of the bonus payment is calculated using a point system. The case management fee includes 400 points awarded for the initial physician visit (once per patient), 200 points for each follow-up visit (once every 3 months), and 800 points for the annual evaluation (once per year),19 where one point is worth around 1 NTD (NTD / USD = 30). In 2009, 27.56% (totaling 214,340) of Taiwan’s DM patients were enrolled in the program.19
Previous assessments of Taiwan’s diabetes P4P program have found it to effectively increase clinical guideline adherence and patient satisfaction with the quality of care,21 as well as decrease inpatient care utilization. In this study, we used data from the National Health Insurance database to examine factors that influence continuing care participation in DM patients who are either enrolled or not enrolled in the P4P program, and factors that affect whether interrupted participation in the P4P program occurs in the enrolled DM patients. Both Taiwan and the United States provide doctors with financial incentives to enhance medical quality, and some payments are based on quality indicators. Nevertheless, P4P in Taiwan is
implemented by one public insurer (National Health Insurance), whereas P4P in the United States is practiced under multiple medical insurance systems. The study results could be a policy reference for comparing between different health insurance systems.
Previous studies have adopted variables such as gender, age, monthly salary, comorbidity, 24 DCSI score, and hospital accreditation level22 when evaluating diabetes P4P programs. On the basis of logical inference, we searched for possible variables to use in investigating joining or withdrawing from a diabetes P4P program because the topic has rarely been discussed.
Data Source and Participants
In this retrospective cohort study, analysis was performed with secondary data obtained from the National Health Insurance Research Database maintained by Taiwan’s National Health Research Institutes. The study population consisted of all patients with a confirmed diagnosis of type 2 DM from 2001 through 2008. DM patients were defined as individuals with one hospitalization or three or more outpatient visits within 365 days in which the primary or secondary diagnosis was DM (ICD-9-CM code 250. or A-code A181).25 Patients with DM in pregnancy or gestational DM (ICD-9-CM code 648.0 or 648.8), neonatal DM (775.1), or abnormal glucose tolerance (790.2) were excluded from the study. DM patients whose
outpatient records had ever been designated with the specific treatment code “E4” (for the diabetes P4P program) were defined as P4P program enrollees (N = 198,420). All study subjects were followed up until the end of 2009.
Propensity score matching was performed on the basis of personal characteristics (gender, age, monthly salary, and residence urbanization level), health status
(comorbidity, severity of diabetes complications, and presence or absence of
catastrophic illness or injury), and characteristics of the health care organization (level and ownership type) in order to match P4P enrollees 1:1 with non-enrollees among the DM patients, resulting in a sample of 396,830 patients for analysis. For the analysis of factors related to interrupted participation in the diabetes P4P program after enrollment, we excluded enrollees, totaling 20,744, who did not reach the time point for their annual evaluation (29 full weeks after enrollment), leaving 177,676 enrollees for the analysis. To encourage medical teams to improve their monitoring of and continual care for patients, the National Health Insurance Administration in Taiwan has established payment regulations for its diabetes P4P program. DM patients who have been in the P4P program for 29 weeks can participate in yearly
evaluations and the doctor can receive the annual case management fee for each patient.
Description of Variables
The dependent variables examined in this study included whether participation in the diabetes P4P program was interrupted and whether continuing care participation was maintained. The independent variables analyzed included personal characteristics (gender, age, monthly salary, and urbanization level of residence area), health status (comorbidity, severity of diabetes complications, and presence or absence of
catastrophic illness or injury), characteristics of the main physician seen (age and annual service volume), and characteristics of the main health care organization utilized. The National Health Insurance Administration in Taiwan has identified 30 types of severe illness or injury as the catastrophic illnesses or injuries (e.g.,
malignant neoplasm, type I diabetes mellitus, chronic renal failure, cerebrovascular disease, rare disease).
Further details on the variables are as follows: (1) Continuing care participation was defined as having at least one DM-related physician visit every three months and at least four such visits per year following a confirmed DM diagnosis for patients not enrolled in the P4P program, or following P4P program enrollment for enrollees. Otherwise, patients were considered to lack continuing care participation. (2)
Uninterrupted diabetes P4P program participation was defined as having regular DM visits during the year following P4P program enrollment and then undergoing the annual evaluation of DM disease (prescription code P1409C). Enrolled patients who failed to complete the first annual DM evaluation were considered to have interrupted participation in the diabetes P4P program. (3) Monthly salaries were taken to be the monthly salary amounts use in the determination of National Health Insurance
premiums. (4) The urbanization level of the residence area was designated as one of seven levels, with level 1 corresponding to the highest level of urbanization and level 7, the lowest. (5) Comorbidity was assessed using the Deyo modification of the Charlson comorbidity score. Each patient’s ICD-9-CM primary and secondary diagnosis codes were converted to weighted numerical scores, which were then summed to give the patient’s Charlson comorbidity index.26 (6) The severity of diabetes complications was assessed using the categories of diabetes complications described by Young et al. (retinopathy, nephropathy, neuropathy, stroke,
cardiovascular disease, peripheral vascular disease, and metabolic complications). Each patient’s ICD-9-CM primary and secondary diagnosis codes were converted to weighted numerical scores, which were then summed to give the patient’s diabetes complications severity index.27 (7) Physician service volume was computed as the annual service volume of the patient’s main physician, categorized by the quartile method as high (≥75%), medium (≥25% and 75%), or low (25%). (8) The
characteristics of the main health care organization utilized were classified in terms of its level and ownership type. Low-income household status was defined as belonging to a household in which the average monthly income per person falls below the lowest living index, which is 60% of the living expenditure per person in the previous year in the household’s local area.28 This study was approved by the Institutional Review Board of China Medical University and Hospital (IRB No.20130326C).
Statistical Analysis
First, descriptive statistics were used to examine the distribution of different variables—personal characteristics, health status, characteristics of the main physician, characteristics of the main health care organization, and continuing care participation—in the study participants, who were distinguished by whether they were
enrolled in the P4P program and whether interruption occurred in their participation in the P4P program after enrollment. The distributions were expressed as percentages and means.
Next, the chi-square test and t-test were used to examine each variable’s
association with continuing care participation in diabetes P4P program enrollees and non-enrollees, as well as association with interrupted P4P program participation in the enrollees. Logistic regression analysis was performed to examine factors that
influenced continuing care participation in the DM patients.
Finally, logistic regression was employed to examine factors that influenced whether interruption occurred in DM patients’ participation in the P4P program after enrollment. In this study, a p value less than 0.05 was considered statistically
significant.
RESULTS
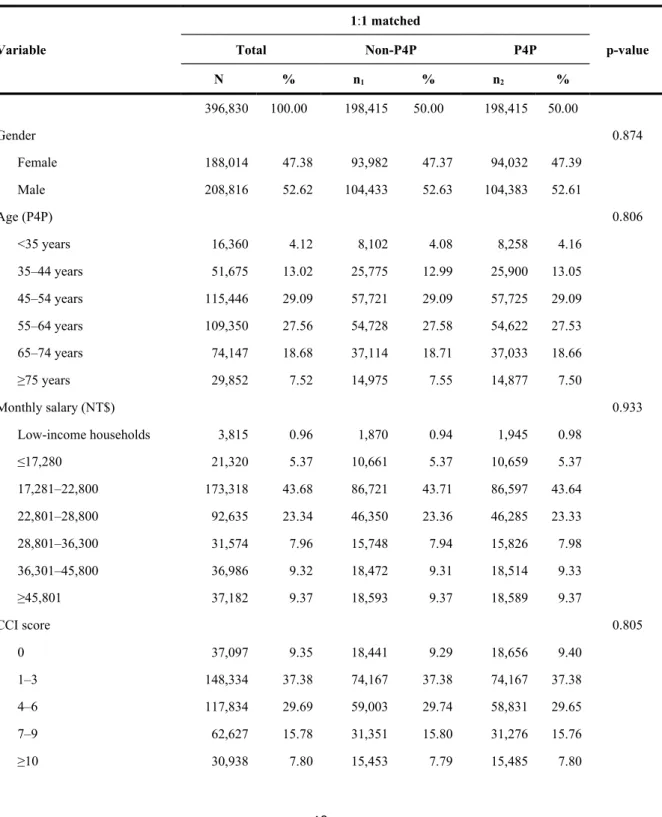
Among the DM patients analyzed in this study, the P4P program enrollees and the propensity score–matched non-enrollees were not significantly different in any of the matched variables, as shown in Table 1. The majority of the program enrollees participated in continuing care, defined as having at least one DM-related physician visit every 3 months (71.82%, vs. 27.67% who did not), as shown in Table 2. With respect to personal characteristics, DM patients characterized by female gender (49.99%), age 35–64 years (50.37%–52.35%), a monthly salary of NT$17,281– 22,800 (50.60%), and residence in urbanization level 4 or 5 areas (50.77%) had higher rates of continuing care participation. As for health status, a Charlson comorbidity index (CCI) of 2 (60.19%), a diabetes complications severity index (DCSI) of 1 (65.13%), and the absence of catastrophic illness or injury (50.88%) corresponded to
higher rates of continuing care participation in the DM patients. Higher rates of continuing care were also observed in patients whose main physician were aged 45– 54 years (63.86%) or had a high service volume (70.67%) and patients whose main health care organization was a district hospital (50.63%), a clinic (50.09%), or a public hospital (50.53%).
Factors Affecting Continuing Care Participation in DM Patients
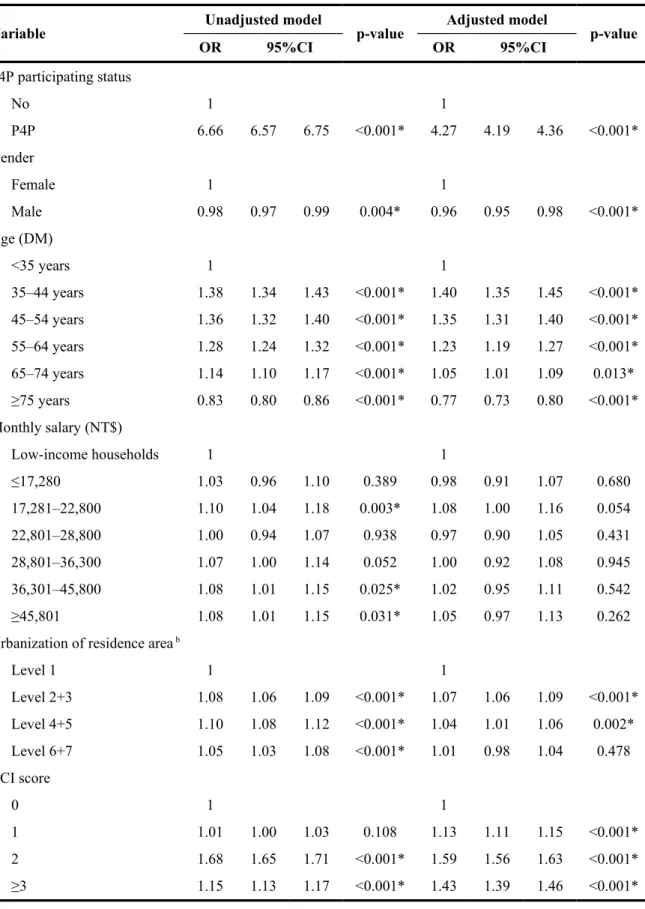
Logistic regression analysis revealed that DM patients enrolled in the P4P program were more likely to participate in continuing care (having at least one DM-related physician visit every 3 months) than those not enrolled in the program by a factor of 4.27 (95% confidence interval [CI], 4.19–4.36), as shown in Table 3. Increased odds of continuing care participation were associated with the patient characteristics of female gender, age 35–74 years (odds ratio [OR], 1.05–1.40), and residence in urbanization level 2 or 3 areas (OR, 1.07). With respect to health status, DM patients with a CCI of 2 (OR, 1.59), with a DCSI of 1 (OR, 1.58), or without catastrophic illness or injury were more likely to participate in continuing care. As for physician and health organization characteristics, higher odds of continuing care participation were found for DM patients whose care was provided mainly by a physician in the 35–44-year age group (OR, 1.15) or with a high service volume (OR =3.01) and mainly at a clinic (OR, 1.12) or a public hospital. In particular, physician service volume was directly correlated with DM patients’ odds of continuing care participation.
Comparison of Characteristics between DM Patients with and without Interruption of Diabetes P4P Program Participation after Enrollment
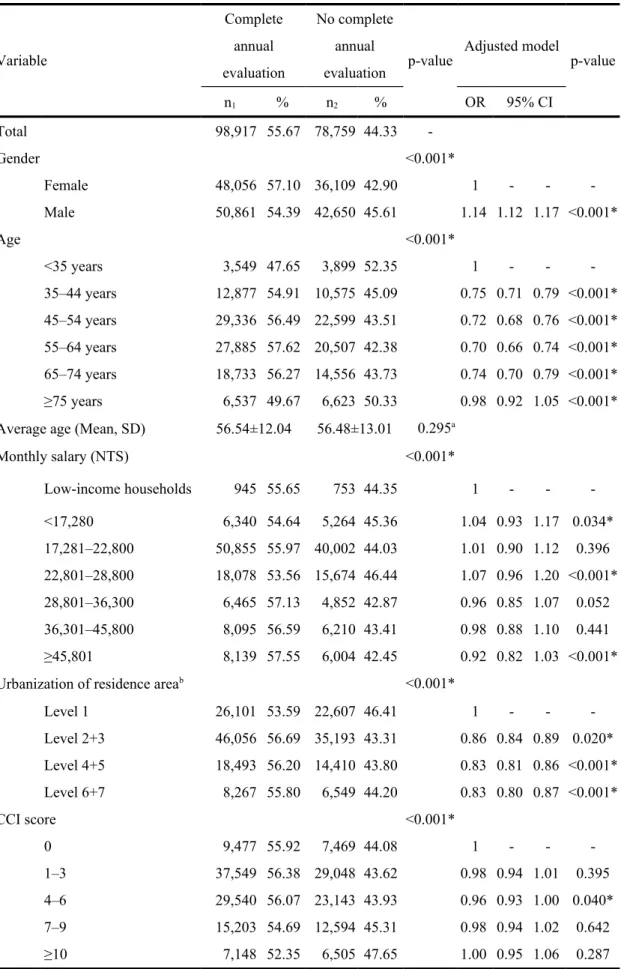
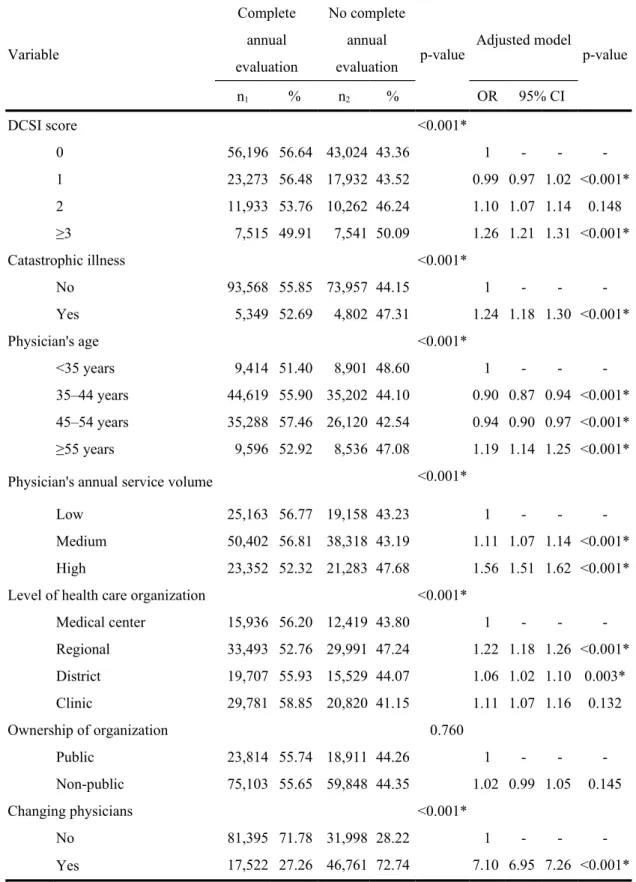
interrupted participation in the program, as seen in Table 4. With respect to personal characteristics, higher proportions of enrollees who were male (45.61%), were aged 35 (52.35%), had a monthly salary of NT$22,801–28,800 (46.44%), or resided in urbanization level 1 areas (46.41%) had an interruption of program participation. Among the health status characteristics, a CCI ≥10 (47.65%), a DCSI ≥3 (50.09%), and the presence of catastrophic illness or injury (47.31%) corresponded to higher rates of interrupted program participation. Interrupted program participation also occurred at higher rates in enrollees whose main physician was aged 35 years (48.60%) or had a high service volume (47.68%), whose main health care
organization was a regional hospital (47.24%), and who had a change of physician (72.74%).
Factors Associated with Interrupted Diabetes P4P Program Participation in Enrolled DM Patients
Factors related to interruption of diabetes P4P program participation in enrolled DM patients were analyzed by logistic regression, with the results shown in Table 4. Personal characteristics of the DM patients that were associated with a greater
likelihood of interrupted program participation were male gender (OR, 1.14), age <35 years, a monthly salary of NT$≤28,800, and residence in urbanization level 1 areas. With respect to health status, enrollees with a DCSI ≥3 (OR, 1.26) or with
catastrophic illness or injury (OR, 1.24) were more likely to have an interruption of program participation. Increased odds of interrupted program participation were also associated with having a main physician who was ≥55 years old (OR, 1.19; 95% confidence interval [CI], 1.14–1.25) or had a high service volume (OR, 1.56), having a regional hospital (OR, 1.22) or a private hospital (OR, 1.02) as the main health care organization, and having changed physicians (OR, 7.10). In particular, there was a
direct correlation between physician service volume and the odds of interrupted diabetes P4P program participation in enrolled DM patients.
DISCUSSION
In this study, we showed that DM patients who were enrolled in Taiwan’s diabetes P4P program were more likely to engage in continuing care (i.e., have at least one DM-related physician visit every 3 months) than their non-enrolled counterparts (Table 3), in agreement with a previous study conducted in Taiwan by Lee et al. (2010).23 The authors found that DM patients in the P4P program had a larger increase in the number of diabetes-specific physician visits after program enrollment (annual average increasing from 3.8 times to 6.4 times) than non-enrolled DM patients in the same period (from 3.5 to 3.6 times).23
One of the factors that have been associated with differences in DM patients’ continuing care participation is gender. Chang et al. (2005) showed that female DM patients were more likely than their male counterparts to take their medicine regularly and practice self-care (exercise, dietary control, weight control, and life style
regularity).29 Studies in Germany30 and Israel31 observed a higher number of physician visits for female than male DM patients. Previous research also found differing views on health-related issues between men and women and the greater social and cultural acceptability of women being weak or unhealthy.32 Women were also shown to more readily seek consultation for illness in general33 and to have more diabetes-related worries as DM patients.34 Our results show that, compared with their male
counterparts, female DM patients were more likely to participate in continuing care (Table 3) and less likely to have interrupted participation in the diabetes P4P program after enrollment (Table 4).
With respect to patient age, it has been shown that younger patients, with a shorter medical history, were less likely than older patients to have established a long-term, sustained relationship with their medical care provider or team.33 Younger patients also self-reported better health status35 and were less likely to have
experienced severe diabetes complications.36 Consistently, we found DM patients in the <35-year age group to have poorer continuing care participation (Table 3) and higher odds of interrupted diabetes P4P program participation (Table 4). Aller et al. (2013) showed that patients aged <35 years and patients with poorer health status experienced less relational continuity of care with their physicians.37
As for the effect of economic status, a Brazilian study (2003) found that patients with higher income were more likely to have a continual relationship with a regular physician than those with lower income.38 Our results show that DM patients earning ≤NT$28,800 in monthly salary were more likely than those earning NT$28,800 to have interrupted participation in the diabetes P4P program.
The area of residence may affect continuing care because the fast pace of life and busy work schedules in highly urbanized areas leave patients less time for health care–related activities. We observed less continuing care participation (Table 3) and more interruption of diabetes P4P program participation after enrollment (Table 4) in DM patients residing in urbanization level 1 areas. A previous study by Lin et al. (2011) examining preventive care utilization in Taiwan found that DM patients in the more urbanized northern area had a lower rate of regular use of preventive services than DM patients in the southern area (36.6% vs. 29.5%),39 which is consistent with our finding.
A patient’s health status also influences his or her continuing care. A study in Spain (2013) showed that patients with better health status (both self-rated and based on the declared number of health conditions) were better able to maintain a continuing
relationship with their physicians.37 In the present study, we found that DM patients with poorer health status, indicated by greater severity of diabetes complications (DCSI ≥ 3) and the presence of catastrophic illness and injury, were more likely to have interrupted participation in the diabetes P4P program after enrollment (Table 4).
With respect to physician service volume, Katz et al. (2003) showed a correlation between greater patient satisfaction with a surgical procedure and a higher number of such procedures performed at the hospital or by the surgeon.40 We found in our study that the higher the physician service volume, the higher the likelihood of continuing care participation (at least one DM-related physician visit every 3 months) in DM patients (Table 3). Yet, for DM patients enrolled in the diabetes P4P program, the higher the physician service volume, the likelihood of interrupted program participation was also higher (Table 4). We infer that there is a group of patients who preferentially seek care from high-volume physicians, but have no intention of maintaining a long-term relationship with these physicians. This idea may form the basis for further research. This study further analyzed the characteristics of this group of P4P patients who interrupted from the main physicians with high service volume. With respect to personal characteristics, higher proportions of enrollees who did not have continuing care (80.44%), were male (48.57%), were aged <35 (54.03%), were low-income households (53.11%), or resided in urbanization level 1 areas (50.77%) had an interruption of program participation. Among the health status characteristics, a CCI ≥10 (50.62%), a DCSI ≥3 (53.48%), and the presence of catastrophic illness or injury (52.32%) corresponded to higher rates of interruption from the main physicians with high service volume. Interruption from P4P program also occurred at higher rates in enrollees whose main health care organization was a regional hospital (47.24%), or was a public hospital (49.60%) and who had a change of physician (80.49%)
The effect of hospital ownership type on DM care is related to the fact that public hospitals in Taiwan are overseen by health authorities and are eligible for extra health care funding for good performance. It is thus in the interest of public hospitals to more actively promote the P4P program. Consistently, DM patients who sought care at public hospitals were more likely to participate in continuing care (Table 3) and less likely to have interrupted participation in the diabetes P4P program after enrollment (Table 4) than their private hospital counterparts.
Our analysis also revealed a correlation between a change of the main physician and interruption of diabetes P4P program participation in enrolled DM patients. A stable, long-term relationship between a patient and a physician has been found to promote familiarity, trust, and better sharing of information,41 decrease information asymmetry and increase goal alignment,42 and improve treatment compliance. Previous studies have also associated the length of patient–physician relationships with patients’ trust in their physicians43 and with patients’ satisfaction with the outcomes of care.
Limitations
This study was a retrospective analysis based on data obtained from the National Health Insurance Database. The use of this secondary database limited the number of variables available for our analysis. The monthly salary, used as a proxy for economic status, does not represent an individual’s entire income. Also, the database did not include information on the study participants’ health beliefs and health behaviors, limiting further analysis in this study.
Our analysis showed that DM patients who were enrolled in Taiwan’s diabetes P4P program were more likely to participate in continuing care (at least one DM-related physician visit every 3 months). Factors that affected DM patients’
participation in continuing care included P4P program enrollment status, personal characteristics, health status, characteristics of the main physician, and characteristics of the main health care organization.
Of the DM patients who enrolled in the diabetes P4P program, 44.33% had interrupted participation in the program. Male gender, younger age (<35), residence in areas of highest urbanization, greater severity of diabetes complications, presence of catastrophic illness or injury, older age (≥55) and high service volume in the main physician, having a regional or private hospital as the main health care organization, and change of physician were the factors that were associated with interruption of diabetes P4P program participation in enrolled DM patients. Doctors aged ≥55 years and those with a higher service volume must be more active in cultivating satisfactory and lasting patient–doctor relationships. For patients who are male and <35 years old, live in highly urbanized areas (i.e., cities), have changed doctors, exhibit serious diabetes complications, or have suffered from catastrophic illnesses, doctors and case managers should strive to decrease patients’ withdrawal from diabetes P4P programs, enabling patients to continue their treatment in the programs, thereby reducing the occurrence of complications.
In the future, researchers can adopt questionnaires to investigate the lifestyles and health behaviors of patients who withdraw from diabetes P4P programs and examine the major reasons for their program withdrawal. Thus, case managers and doctors can identify problems and seek solutions for patient withdrawal.
Table 1 Comparisons of study subjects after propensity score matching for P4P participating status Variable 1:1 matched p-value Total Non-P4P P4P N % n1 % n2 % 396,830 100.00 198,415 50.00 198,415 50.00 Gender 0.874 Female 188,014 47.38 93,982 47.37 94,032 47.39 Male 208,816 52.62 104,433 52.63 104,383 52.61 Age (P4P) 0.806 <35 years 16,360 4.12 8,102 4.08 8,258 4.16 35–44 years 51,675 13.02 25,775 12.99 25,900 13.05 45–54 years 115,446 29.09 57,721 29.09 57,725 29.09 55–64 years 109,350 27.56 54,728 27.58 54,622 27.53 65–74 years 74,147 18.68 37,114 18.71 37,033 18.66 ≥75 years 29,852 7.52 14,975 7.55 14,877 7.50 Monthly salary (NT$) 0.933 Low-income households 3,815 0.96 1,870 0.94 1,945 0.98 ≤17,280 21,320 5.37 10,661 5.37 10,659 5.37 17,281–22,800 173,318 43.68 86,721 43.71 86,597 43.64 22,801–28,800 92,635 23.34 46,350 23.36 46,285 23.33 28,801–36,300 31,574 7.96 15,748 7.94 15,826 7.98 36,301–45,800 36,986 9.32 18,472 9.31 18,514 9.33 ≥45,801 37,182 9.37 18,593 9.37 18,589 9.37 CCI score 0.805 0 37,097 9.35 18,441 9.29 18,656 9.40 1–3 148,334 37.38 74,167 37.38 74,167 37.38 4–6 117,834 29.69 59,003 29.74 58,831 29.65 7–9 62,627 15.78 31,351 15.80 31,276 15.76 ≥10 30,938 7.80 15,453 7.79 15,485 7.80
Variable 1:1 matched p-value Total Non-P4P P4P N % n1 % n2 % DCSI score 0.948 0 219,307 55.26 109,738 55.31 109,569 55.22 1 92,872 23.40 46,398 23.38 46,474 23.42 2 50,164 12.64 25,073 12.64 25,091 12.65 ≥3 34,487 8.69 17,206 8.67 17,281 8.71 Catastrophic illness 0.544 No 373,472 94.11 186,781 94.14 186,691 94.09 Yes 23,358 5.89 11,634 5.86 11,724 5.91 Table 1 (Continued) Variable 1:1 matched p-value Total Non-P4P P4P N % n1 % n2 %
Level of health care organization 0.810
Medical center 64,330 16.21 32,260 16.26 32,070 16.16 Regional 142,551 35.92 71,289 35.93 71,262 35.92 District 77,353 19.49 38,674 19.49 38,679 19.49 Clinic 112,596 28.37 56,192 28.32 56,404 28.43 Ownership of organization 0.420 Public 95,135 23.97 47,459 23.92 47,676 24.03 Non-public 301,695 76.03 150,956 76.08 150,739 75.97
Table 2 Distribution of various characteristics in DM patients with and without continuing care participation
Variable Total No continuing care Continuing care p-value
N % n1 % n2 % Total 396,830 100.00 199,438 50.26 197,392 49.74 P4P participating status <0.001* No P4P 198,415 50.00 143,515 72.33 54,900 27.67 P4P 198,415 50.00 55,923 28.18 142,492 71.82 Gender 0.004* Female 188,014 47.38 94,033 50.01 93,981 49.99 Male 208,816 52.62 105,405 50.48 103,411 49.52 Age (DM) <0.001* <35 years 20,496 5.16 11,418 55.71 9,078 44.29 35–44 years 61,242 15.43 29,184 47.65 32,058 52.35 45–54 years 123,960 31.24 59,625 48.10 64,335 51.90 55–64 years 102,243 25.76 50,745 49.63 51,498 50.37 65–74 years 66,053 16.65 34,698 52.53 31,355 47.47 ≥75 years 22,836 5.75 13,768 60.29 9,068 39.71
Average age (mean, SD) 55.05±12.61 55.49±13.19 54.60±11.98 <0.001a*
Monthly salary (NT$) <0.001* Low-income households 3,815 0.96 1,979 51.87 1,836 48.13 ≤17,280 21,320 5.37 10,898 51.12 10,422 48.88 17,281–22,800 173,318 43.68 85,627 49.40 87,691 50.60 22,801–28,800 92,635 23.34 47,994 51.81 44,641 48.19 28,801–36,300 31,574 7.96 15,853 50.21 15,721 49.79 36,301–45,800 36,986 9.32 18,483 49.97 18,503 50.03 ≥45,801 37,182 9.37 18,604 50.03 18,578 49.97
Urbanization of residence area b <0.001*
Level 1 110,653 27.88 57,154 51.65 53,499 48.35 Level 2+3 182,168 45.91 90,693 49.79 91,475 50.21 Level 4+5 70,239 17.70 34,581 49.23 35,658 50.77 Level 6+7 33,770 8.51 17,010 50.37 16,760 49.63 CCI score <0.001* 0 208,284 52.49 109,555 52.60 98,729 47.40 1 80,842 20.37 42,253 52.27 38,589 47.73 2 56,913 14.34 22,655 39.81 34,258 60.19 ≥3 50,791 12.80 24,975 49.17 25,816 50.83
Table 2 (Continued)
Variable Total No continuing care Continuing care p-value
N % n1 % n2 % DCSI score <0.001* 0 315,267 79.45 165,312 52.44 149,955 47.56 1 46,980 11.84 16,381 34.87 30,599 65.13 2 26,143 6.59 13,436 51.39 12,707 48.61 ≥3 8,440 2.13 4,309 51.05 4,131 48.95 Catastrophic illness <0.001* No 363,837 91.69 178,708 49.12 185,129 50.88 Yes 32,993 8.31 20,730 62.83 12,263 37.17 Physician’s age <0.001* <35 years 143,706 36.21 95,227 66.27 48,479 33.73 35–44 years 147,542 37.18 64,794 43.92 82,748 56.08 45–54 years 79,804 20.11 28,840 36.14 50,964 63.86 ≥55 years 25,778 6.50 10,577 41.03 15,201 58.97
Physician’s annual service volume <0.001*
Low 99,039 24.96 79,292 80.06 19,747 19.94
Medium 198,566 50.04 91,042 45.85 107,524 54.15
High 99,225 25.00 29,104 29.33 70,121 70.67
Level of health care organization <0.001*
Medical center 64,330 16.21 32,227 50.10 32,103 49.90 Regional 142,551 35.92 72,830 51.09 69,721 48.91 District 77,353 19.49 38,189 49.37 39,164 50.63 Clinic 112,596 28.37 56,192 49.91 56,404 50.09 Ownership of organization <0.001* Public 95,135 23.97 47,059 49.47 48,076 50.53 Non-public 301,695 76.03 152,379 50.51 149,316 49.49 a t-test
b Level 1: the most urbanized areas.
Table 3 Association of factors with continuing care participation in DM patients
Variable Unadjusted model p-value Adjusted model p-value
OR 95%CI OR 95%CI P4P participating status No 1 1 P4P 6.66 6.57 6.75 <0.001* 4.27 4.19 4.36 <0.001* Gender Female 1 1 Male 0.98 0.97 0.99 0.004* 0.96 0.95 0.98 <0.001* Age (DM) <35 years 1 1 35–44 years 1.38 1.34 1.43 <0.001* 1.40 1.35 1.45 <0.001* 45–54 years 1.36 1.32 1.40 <0.001* 1.35 1.31 1.40 <0.001* 55–64 years 1.28 1.24 1.32 <0.001* 1.23 1.19 1.27 <0.001* 65–74 years 1.14 1.10 1.17 <0.001* 1.05 1.01 1.09 0.013* ≥75 years 0.83 0.80 0.86 <0.001* 0.77 0.73 0.80 <0.001* Monthly salary (NT$) Low-income households 1 1 ≤17,280 1.03 0.96 1.10 0.389 0.98 0.91 1.07 0.680 17,281–22,800 1.10 1.04 1.18 0.003* 1.08 1.00 1.16 0.054 22,801–28,800 1.00 0.94 1.07 0.938 0.97 0.90 1.05 0.431 28,801–36,300 1.07 1.00 1.14 0.052 1.00 0.92 1.08 0.945 36,301–45,800 1.08 1.01 1.15 0.025* 1.02 0.95 1.11 0.542 ≥45,801 1.08 1.01 1.15 0.031* 1.05 0.97 1.13 0.262
Urbanization of residence area b
Level 1 1 1 Level 2+3 1.08 1.06 1.09 <0.001* 1.07 1.06 1.09 <0.001* Level 4+5 1.10 1.08 1.12 <0.001* 1.04 1.01 1.06 0.002* Level 6+7 1.05 1.03 1.08 <0.001* 1.01 0.98 1.04 0.478 CCI score 0 1 1 1 1.01 1.00 1.03 0.108 1.13 1.11 1.15 <0.001* 2 1.68 1.65 1.71 <0.001* 1.59 1.56 1.63 <0.001* ≥3 1.15 1.13 1.17 <0.001* 1.43 1.39 1.46 <0.001*
Table 3 (Continued)
Variable Unadjusted model Adjusted model
OR 95%CI p-value OR 95%CI p-value
DCSI score 0 1 1 1 2.06 2.02 2.10 <0.001* 1.58 1.54 1.61 <0.001* 2 1.04 1.02 1.07 0.001* 1.00 0.97 1.03 0.809 ≥3 1.06 1.01 1.10 0.012* 1.05 1.00 1.11 0.065 Catastrophic illness No 1 1 Yes 0.57 0.56 0.58 <0.001* 0.52 0.51 0.54 <0.001* Physician’s age <35 years 1 1 35–44 years 2.51 2.47 2.55 <0.001* 1.15 1.13 1.17 <0.001* 45–54 years 3.47 3.41 3.53 <0.001* 0.92 0.89 0.94 <0.001* ≥55 years 2.82 2.75 2.90 <0.001* 0.96 0.93 1.00 0.031*
Physician’s annual service volume
Low 1 1
Medium 4.74 4.66 4.83 <0.001* 2.17 2.12 2.21 <0.001*
High 9.67 9.48 9.88 <0.001* 3.01 2.93 3.09 <0.001*
Level of health care organization
Medical center 1 1 Regional 0.96 0.94 0.98 <0.001* 0.91 0.89 0.93 <0.001* District 1.03 1.01 1.05 0.007* 1.06 1.03 1.09 <0.001* Clinic 1.01 0.99 1.03 0.441 1.12 1.10 1.15 <0.001* Ownership of organization Public 1 1 Non-public 0.96 0.95 0.97 <0.001* 0.93 0.91 0.94 <0.001*
b Level 1: the most urbanized areas.
Table 4 Association of factors with interruption of diabetes P4P program participation Variable Complete annual evaluation No complete annual evaluation p-value Adjusted model p-value n1 % n2 % OR 95% CI Total 98,917 55.67 78,759 44.33 -Gender <0.001* Female 48,056 57.10 36,109 42.90 1 - - -Male 50,861 54.39 42,650 45.61 1.14 1.12 1.17 <0.001* Age <0.001* <35 years 3,549 47.65 3,899 52.35 1 - - -35–44 years 12,877 54.91 10,575 45.09 0.75 0.71 0.79 <0.001* 45–54 years 29,336 56.49 22,599 43.51 0.72 0.68 0.76 <0.001* 55–64 years 27,885 57.62 20,507 42.38 0.70 0.66 0.74 <0.001* 65–74 years 18,733 56.27 14,556 43.73 0.74 0.70 0.79 <0.001* ≥75 years 6,537 49.67 6,623 50.33 0.98 0.92 1.05 <0.001* Average age (Mean, SD) 56.54±12.04 56.48±13.01 0.295a
Monthly salary (NTS) <0.001* Low-income households 945 55.65 753 44.35 1 - - -<17,280 6,340 54.64 5,264 45.36 1.04 0.93 1.17 0.034* 17,281–22,800 50,855 55.97 40,002 44.03 1.01 0.90 1.12 0.396 22,801–28,800 18,078 53.56 15,674 46.44 1.07 0.96 1.20 <0.001* 28,801–36,300 6,465 57.13 4,852 42.87 0.96 0.85 1.07 0.052 36,301–45,800 8,095 56.59 6,210 43.41 0.98 0.88 1.10 0.441 ≥45,801 8,139 57.55 6,004 42.45 0.92 0.82 1.03 <0.001*
Urbanization of residence areab <0.001*
Level 1 26,101 53.59 22,607 46.41 1 - - -Level 2+3 46,056 56.69 35,193 43.31 0.86 0.84 0.89 0.020* Level 4+5 18,493 56.20 14,410 43.80 0.83 0.81 0.86 <0.001* Level 6+7 8,267 55.80 6,549 44.20 0.83 0.80 0.87 <0.001* CCI score <0.001* 0 9,477 55.92 7,469 44.08 1 - - -1–3 37,549 56.38 29,048 43.62 0.98 0.94 1.01 0.395 4–6 29,540 56.07 23,143 43.93 0.96 0.93 1.00 0.040* 7–9 15,203 54.69 12,594 45.31 0.98 0.94 1.02 0.642 ≥10 7,148 52.35 6,505 47.65 1.00 0.95 1.06 0.287
Table 4 (Continued) Variable Complete annual evaluation No complete annual evaluation p-value Adjusted model p-value n1 % n2 % OR 95% CI DCSI score <0.001* 0 56,196 56.64 43,024 43.36 1 - - -1 23,273 56.48 17,932 43.52 0.99 0.97 1.02 <0.001* 2 11,933 53.76 10,262 46.24 1.10 1.07 1.14 0.148 ≥3 7,515 49.91 7,541 50.09 1.26 1.21 1.31 <0.001* Catastrophic illness <0.001* No 93,568 55.85 73,957 44.15 1 - - -Yes 5,349 52.69 4,802 47.31 1.24 1.18 1.30 <0.001* Physician's age <0.001* <35 years 9,414 51.40 8,901 48.60 1 - - -35–44 years 44,619 55.90 35,202 44.10 0.90 0.87 0.94 <0.001* 45–54 years 35,288 57.46 26,120 42.54 0.94 0.90 0.97 <0.001* ≥55 years 9,596 52.92 8,536 47.08 1.19 1.14 1.25 <0.001*
Physician's annual service volume <0.001*
Low 25,163 56.77 19,158 43.23 1 - -
-Medium 50,402 56.81 38,318 43.19 1.11 1.07 1.14 <0.001*
High 23,352 52.32 21,283 47.68 1.56 1.51 1.62 <0.001*
Level of health care organization <0.001*
Medical center 15,936 56.20 12,419 43.80 1 - - -Regional 33,493 52.76 29,991 47.24 1.22 1.18 1.26 <0.001* District 19,707 55.93 15,529 44.07 1.06 1.02 1.10 0.003* Clinic 29,781 58.85 20,820 41.15 1.11 1.07 1.16 0.132 Ownership of organization 0.760 Public 23,814 55.74 18,911 44.26 1 - - -Non-public 75,103 55.65 59,848 44.35 1.02 0.99 1.05 0.145 Changing physicians <0.001* No 81,395 71.78 31,998 28.22 1 - - -Yes 17,522 27.26 46,761 72.74 7.10 6.95 7.26 <0.001* a t-test
b Level 1: the most urbanized areas.