College of Management
I-Shou University
Master Thesis
A study on business’s satisfaction on
export-import registration in the
Department of Customs in Ba Ria –
Vung Tau
Advisor
Co-Advisor
:
:
Dr. Ching-Sung Lai
Dr. HO SY TAN
Graduate Student
:
Lo Trong Ngoc Tuong
ACKNOWLEDGEMENTS
First of all I would like to give very special thanks to Dr. Ching-Sung Lai and Dr.Ho Sy Tan, who is my thesis advisor, for his suggestions, directions, and their patience guiding me. Without their help, I couldn`t have finished this thesis, and this research would not have got off the ground.
Moreover, all the support my family provided me over the years was the greatest, and wonderful gift anyone has ever given me. So, I would like to thank my parents, my wife, that always stand by my side when I need the most.
Also I would like to thank all of my friends, that we are always sharing our happiness, sadness, and always stand for each other. Also, I would like to thank all the professors for their time, recommendation, incitement, support and unique ability to put up with me.
From the deepest of my heart, I would like to thank all of you.
December 2015 Lo Trong Ngoc Tuong
ABSTRACT
This study was conducted to evaluate the satisfaction of customers coming to the Customs office of Ba Ria – Vung Tau to register the Customs documents. Along with the international economic integration trend, the economy of Vietnam has seen remarkable achievements. To maintain the development momentum of the country, the Vietnamese government has issued many policies to keep pace with the rapidly changing business environment. As an important part of the government, the customs system is not excluded from this trend. The analysis result shows that the customer’s satisfaction is influenced by three factors: (1) Employee’s Attitude (Standardized Beta = 0.784), (2) Time (Standardized Beta = 0.133) and (3) Infrastructure (Standardized Beta = 0.124). This result is understandable as the frontline Customs employees are the ones who directly work with customers. Thus, their attitude may have substantial influence on the satisfaction of customers. Besides, as customers of the Customs office are businesses, they really care about how fast their customs procedures could be completed as it directly affects the performance of their companies. This concern is displayed through the fact that Time is the second factor that has the highest influence on the satisfaction. Aside from Employee’s Attitude and Time, customers also considered Infrastructure of a Customs office as a significant factor. It could be said that a Customs office with modern facilities and equipment can really help improve the work effectiveness of customs employees. It also helps businesses to look for information and register their customs documents more easily with the help of technology. With the rapid growth of Vietnam’s economy, the number of business is rapidly growing. Thus, the application of technology in customs activities is unavoidable and significantly helpful.
Keywords: Ba Ria – Vung Tau, customs office, job satisfaction, employee’s attitude, time, infrastructure
Table of Content
ACKNOWLEDGEMENTS ... i
ABSTRACT ... ii
Table of Content ... iii
List of Tables ... v List of Figures ... vi Chapter 1 INTRODUCTION ... 1 1.1. Research Background ... 1 1.2. Research Purposes ... 2 1.3. Research Scope ... 2 1.4. Research Methodology ... 2 1.5. Research Questions ... 3 1.6. Research Significance ... 3
1.7. Structure of the Research ... 3
CHAPTER 2 LITERATURE REVIEW ... 4
2.1. Concepts of service ... 4
2.2. Concepts of public service ... 5
2.3. Theories on Satisfaction ... 7
2.3.1. Concepts of Customer Satisfaction ... 7
2.3.2. Distinction between customer satisfaction and service quality ... 8
2.3.3 Assessment model of customer satisfaction and service quality SERVQUAL model ... 9
2.4. Overview on Customs Activities and the Customs Department of Ba Ria – Vung Tau 11 2.4.1. Overview on the Customs activities ... 11
2.4.2. Introduction to the Customs Department of Ba Ria – Vung Tau ... 12
2.5. Experiences of Customs Agencies in other Countries ... 14
2.5.1. Experience of Customs Agencies in the U.S ... 14
2.5.2. Experience of Customs Agencies in South Korea ... 15
2.5.3. Experience of Customs Agencies in Singapore ... 16
2.5.4. Experience of Customs Agencies in Thailand ... 16
2.5.5. Lessons for the Customs Department of Vietnam ... 16
CHAPTER 3: RESEARCH METHODOLOGY ... 18
3.1. RESEARCH DESIGN ... 18
3.2. RESEARCH PROCESS ... 19 iii
3.3. QUESTIONNAIRE DESIGN ... 20
3.4. SAMPLING DESIGN ... 22
3.5. DATA ANALYSIS ... 22
3.5.1 RELIABILITY TEST ... 22
3.5.2. EXPLORATORY FACTOR ANALYSIS (EFA) ... 22
3.5.3 REGRESSION ANALYSIS ... 23
CHAPTER 4: RESULTS AND DISCUSSION ... 24
4.1. Descriptive Statistics ... 24
4.1.1. Gender ... 24
4.1.2. Working Position ... 24
4.1.3. Experience with Register Customs Procedure ... 25
4.1.4. Business Types... 25
4.1.5. Industry ... 25
4.2. Model Assessment ... 26
4.2.1. Reliability Test ... 26
4.2.2. Exploratory Factor Analysis ... 27
4.2.3. Adjusted Research Model ... 30
4.3. Correlation Analysis ... 31
4.4. Regression Analysis ... 32
4.5. T-test and ANOVA analysis ... 34
CHAPTER 5: CONCLUSION AND RECOMMENDATION ... 36
5.1. Research Summary ... 36
5.2. Contributions of the Research ... 37
5.3. Limitations of the Research ... 37
5.4. Recommendations ... 37
5.5. Suggestions for Future Researches ... 38
REFERENCES ... 39
APPENDIX 1: QUESTIONNAIRE ON THE SATISFACTION OF BUSINESSES TOWARD THE REGISTRATION SERVICE QUALITY OF BA RIA –VUNG TAU CUSTOMS OFFICE ... 41 APPENDIX 2: ANALYSIS RESULT ... Error! Bookmark not defined.
List of Tables
Table 2.1: The number of registration document sets applied to the Customs Department of
Ba Ria – Vung Tau ...14
Table 3.1: Survey on Customers’ Satisfaction ...20
Table 4.1: Descriptive statistics on gender of the participants ...24
Table 4.2: Descriptive statistics on working position of the participants ...24
Table 4.3: Descriptive statistics on experience with register customs procedure of the participants ...25
Table 4.4: Descriptive statistics on business types ...25
Table 4.5: Descriptive statistics on industry ...26
Table 4.6: Reliability Test in the first time ...26
Table 4.7: Reliability Test in the second time ...27
Table 4.8: General EFA results in the first time ...28
Table 4.9: Rotated Component Matrixa in the first time ...28
Table 4.10: General EFA results in the second time ...29
Table 4.11: Rotated Component Matrixa in the second time ...30
Table 4.12: Correlation Analysis Results ...32
Table 4.13: Model Summary ...32
Table 4.14: Regression Analysis...33
Table 4.15: T-test and ANOVA results ...35
List of Figures
Figure 2.1: GAP model of service quality ...6
Figure 2.2 Customer satisfaction measurement model for public service in England...10
Figure 2.3: Customer satisfaction measurement model for public service in England ...10
Figure 2.4 Customs Department of Ba Ria – Vung Tau ...12
Figure 2.5 Organizational Structure of Customs Department of Ba Ria – Vung Tau ...13
Figure 3.1 Proposed Research Model ...18
Figure 4.1: Official Research Model ...31
Figure 4.2: Influence level of Independent Variables on Dependent Variable ...34
Chapter 1 INTRODUCTION
In this chapter, research topic, rationale, objective and importance of the research are discussed. Overall structure of the thesis also presented.
1.1.Research Background
Along with the international economic integration trend, the economy of Vietnam has seen remarkable achievements. To maintain the development momentum of the country, the Vietnamese government has issued many policies to keep pace with the rapidly changing business environment. As an important part of the government, the customs system is not excluded from this trend. The customs system is tasked with two important objectives: (1) preventing commercial frauds and smuggling; (2) offering convenient conditions for export-import businesses. As a public service department, businesses are customers to the customs offices. Without those customers, there is no reasons for the existence of the customs system. As previously mentioned, Vietnam is increasingly integrating into the world economy with economic ties spread all over the world. Thus, the export-import activity plays a significant role to the development of the country. As the managing entity of this activity, constantly reviewing and offering better services to businesses better has become an important task for the customs system in Vietnam.
Registration is the very first step of the export-important activity management procedure. Whether or not the following phases of the customs management are completed smoothly and conveniently depend a lot on the registration step. The registration step also create the first impression of business upon the customs office. The first impression may come from various factors such as professionalism, attitude, empathy or appearance of service provider. For a service office, the first impression may form the a lasting perception of customers on that office. It will also influence their expectation, satisfaction and decision of customers. Besides, it is very difficult to change the first impression in the customer’s mind. Thus, it can be said that it is very important for the customs system to constantly review and offer good registration service quality.
The customs system usually receives complaints about its unsuitable policies, unnecessary procedures or the uncooperative attitude from customs officers that lead to the waste of money and time of businesses, the loss of business opportunities, the dissatisfaction toward customs authorities and limiting the competitiveness and attractiveness of business.
Thus, evaluating the satisfaction of business toward the customs service quality, and especially the registration phase, is a significant research that provides insights of service quality in the customs office. Through this research, the customs authorities can have updated information on the opinions of business and make suitable solutions to improve the quality of customs service. As Vietnam is integrating into the world economy and is bind by many international commercial rules, the customs system of Vietnam is the sector that requires reorganization the most. Within the reorganization of the customs system, the simplification and the proper procedures of customs are two most important changes that Vietnam is committed to fulfill as a part of Kyoto Protocol in 1997.
The above situation of the customs systems had encouraged the author to pick the research topic “A study on business’s satisfaction on export-import registration in the Department of Customs in Ba Ria – Vung Tau”. The author aimed to explore the satisfaction level of businesses at the registration phase, and then proposed several solutions improve the service quality of the customs department of Ba Ria – Vung Tau.
1.2. Research Purposes
- Identifying the satisfaction level of businesses toward the general registration phase and every factor related to this phase
- Identifying the significance of every factor to the satisfaction of businesses - Comparing the satisfaction of different business groups.
- Proposing several solutions to improve the satisfaction of businesses in the registration phase at the Department of Customs in Ba Ria – Vung Tau.
1.3. Research Scope
This research was conducted to evaluate the satisfaction level of business on the registration phase of the customs department of Ba Ria – Vung Tau and find out factors influencing the satisfaction. The research target was representatives of businesses coming to do the registration of export-import activity at the customs department of Ba Ria – Vung Tau. The study was conducted from July, 2015 to November, 2015.
1.4. Research Methodology
The author applied the quantitative method into this research. A survey was conducted with 150 questionnaires delivered to customers coming to the customs department of Ba Ria – Vung Tau to do the registration.
Collected data were analyzed by the statistical software SPSS 18 with the different analytical methods including T-test, ANOVA, and regression analysis.
1.5. Research Questions
Question 1: What factors can contribute to the quality of the customs registration
phase ? What are the level of significance of each factor influencing the business’s satisfaction?
Question2:Are businesses satisfied with the quality of the customs registration at the
Department of Customs of Ba Ria – Vung Tau? What factors should be improved to increase the customs registration quality?
Question3:What are the effective solutions to improve the customs registration quality
at the Department of Customs of Ba Ria – Vung Tau ?
1.6. Research Significance
This study provided insights of the satisfaction level of businesses toward the customs registration quality, as well as factors influencing their satisfaction. From these insights, leaders of the customs departments, including the customs department of Ba Ria – Vung Tau, can have better understanding about the current situation of the registration phase and make suitable solutions to improve the satisfaction of businesses.
The findings of this research can also serve as the references on future studies on the business’s satisfaction on registration quality of the customs department of Ba Ria – Vung Tau.
1.7. Structure of the Research
The thesis was divided into 5 chapters:
Chapter 1: Introduction Chapter 2: Literature Review Chapter 3: Research Methodology Chapter 4: Results and Analysis
Chapter 5: Conclusions and Recommendations
.
CHAPTER 2 LITERATURE REVIEW
This chapter reviewed the theories and previous findings of service quality, customer’s satisfaction and theoretical framework of assessing customer’s satisfaction on service quality. The chapter also introduced the Customs Department of Ba Ria – Vung Tau, its duties and the procedures of registration. Finally, the author also mentioned several models of Customs registration management in other countries to provide some references for the Customs Department of Ba Ria – Vung Tau to study.
2.1. Concepts of service
Zeithaml & Bitner (2000) considered services as deeds, processes and performance on a certain task to create value for customers to satisfy their needs and expectations.
According to Kotler & Keller (2007), service is different from normal goods because of the four key characteristics: (1) intangibility; (2) inseparability; (3) variability and (4) perishability. It is difficult to quantify and perceive these characteristics. Kotler & Keller (2007) described the characteristics as the following:
Intangibility: Service is not like physical products. People cannot feel, see, hear, smell or taste them before they make the buy decisions.
Variability: Services are variable because they are driven by the difference in the mental and ability of each employee. Besides, the difference in the customer’s perception also contributes to the variability of service.
Inseparability: Services are produced and consumed simultaneously. This is not true for the physical products that are produced then distributed through various channels and then consumed. For the physical product, customers only use them at the last stage. But for services, customers will follow the whole or part of the process of producing service.
Perishability: Services cannot be stored for later use or sale like other goods. When the demand is stable, the perishability of service is not a big problem, however, when the demand fluctuates, the perishability becomes a big challenge for business.
In general, services are immaterial goods which do not have shape, and the service quality is variable and cannot be stored. Those are the biggest distinction between services and normal goods.
The structure of service sector is very complex. Normally, the service sector is divided into three groups:
Business service group: including transportation, communication, finance, insurance, real estate business, etc.;
Consuming service group: including wholesale, retailing, tourism, personal services such as medical service, education, or sport;
Public service: including public administrative service or organizational service.
2.2. Concepts of public service
There are many viewpoints on the concept of public service, but in general, public services can be understood as the services provided by a government through its own agencies or by hiring non-governmental organization/private organization. In Vietnam, public service can be divided into three groups:
- Public administrative service;
-Public educational, medical and cultural service; and
-Social welfare.
Service quality
There are many studies on the assessment of service quality. One of the well-known models of service quality assessment is the model of Parasuraman. Parasuraman first proposed 10 determinants to service quality in 1985 and 1988, and then he generalized them into 5 factors. They are: - Reliability - Responsiveness - Tangibles - Assurance - Empathy
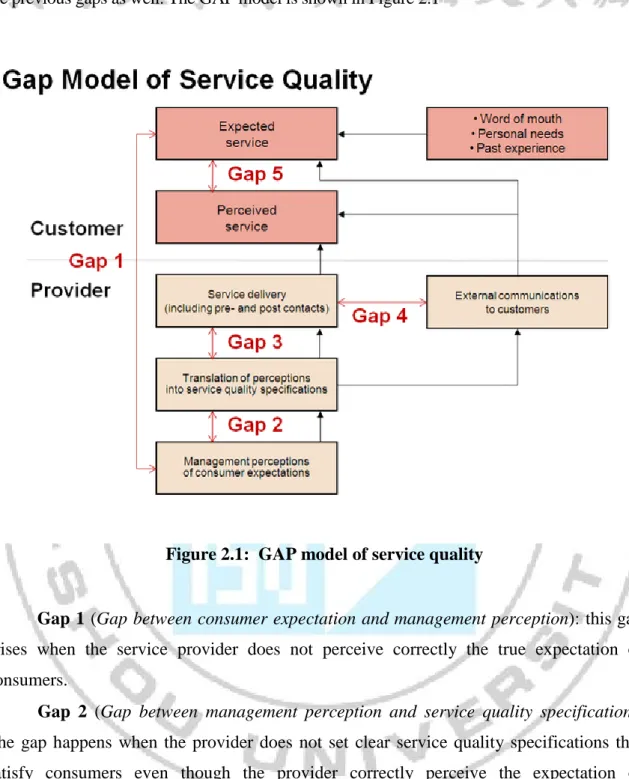
Parasuraman et al. (1985) proposed the GAP model of service quality. Parasuraman et al. (1985) claimed that the fifth gap of this model (which is the gap between expected service and perceived service) is the most important gap and this gap relies on the previous gaps of the
model. Thus, to reduce the fifth gap and improve the service quality, the manager must reduce the previous gaps as well. The GAP model is shown in Figure 2.1
Figure 2.1: GAP model of service quality
Gap 1 (Gap between consumer expectation and management perception): this gap
arises when the service provider does not perceive correctly the true expectation of consumers.
Gap 2 (Gap between management perception and service quality specification):
The gap happens when the provider does not set clear service quality specifications that satisfy consumers even though the provider correctly perceive the expectation of consumers.
Gap 3 (Gap between service quality specification and service delivery): This gap
occurs when the service deliver personnels who have direct contact with customers do not provide the standardized service quality. The reasons could be poor training, unfitted job or weak teamwork. At this stage, the role of training and human resources manager is very important to reduce the gap.
Gap 4 (Gap between service delivery and external communication): The reasons
may be the information, advertisements, or marketing efforts to customers do not match the real service quality. The expectation of customers is highly influenced by the advertising statements of service providers, and customers will rely on the advertising statement to judge the quality of service.
Gap 5 (Gap between expected service and perceived service): This gap occurs when
customers do not correctly perceive the service quality. The reasons may be the external impacts on customer expectations such as personal experience with similar products or services, advises from friends, etc. These impacts create the “perception” of customers about the service they will receive even though they may be in a different context.
2.3. Theories on Satisfaction
2.3.1. Concepts of Customer Satisfaction
There are many definitions for the term “customer satisfaction”. Kotler (2003) defined satisfaction as “a person’s feeling of pleasure or disappointment resulting from comparing a product’s perceived performance (or outcome) in relation to his or her expectations” (p.36). According to Smith (1969), satisfaction with a service is the feeling a person has on a service. Hansemark and Albinsson (2004) defined satisfaction as “anoverall customer attitude towards a service provider, or an emotional reaction to the difference between what customers anticipate and what they receive, regarding the fulfillment of some need, goal or desire”.
Kotler & Keller (2006) suggested that there are three levels of satisfaction: (1) if customer perceptions are lower than customer expectations, they feel dissatisfied; (2) if customer perceptions are equal to customer expectations, they feel satisfied; (3) if customer perceptions are higher than customer expectation, they feel satisfied and excited.
Although there are many concepts of satisfaction, the satisfaction is usually attached to the following factors: attitude toward the service provider; customer expectations on the services; service performance result, or the values that a service can provide customers; intention to keep using a service or not.
In marketing, there are also many definitions of customer satisfaction. Banchelet (1995) defined customer satisfaction as an “emotional reaction by the consumer in response to an experience with a product or service” (p.81). According to Hoffman & Bateson (2006), customer satisfaction is the comparison of customer expectations to perceptions on service. If perceptions are equal or higher than expectations, customers will feel satisfied.
Thus, service quality refers to the characteristics satisfying customer, and satisfaction refers to emotional reaction to using a service or product. From the above definitions, it can be said that managing customer expectations and increasing customer perception are very important tasks in improving customer satisfaction. Customer expectations play a central role in affecting customer satisfaction upon a service. Thus, it is important to identify factors that influence customer expectations. According to Public Service Renovation Department of England, customer expectations consist of 5 factors: (1) personal needs; (2) word of mouth; (3) previous experience; (4) explicit service promise; (5) implicit service promise.
Personal needs are what customers expect to be satisfied. Different individuals will have different expectations on different services. Therefore, it is difficult to understand all the personal needs on service.
Previous experiences on a service will affect future customer expectations on service. Customers who are experienced in using services tend to not put high expectation on service quality, thus, they tend to have higher satisfaction.
Word of mouth: the communication between relatives, friends or coworkers will spread information quickly and affect customer expectations.
Explicit service promise: all statements or promises of organization on their services, along with the public relation, will directly influence customer expectations.
Implicit service promise: all tangible identifications such as infrastructure, logo, etc. that may lead to higher expectation on service quality.
Understanding customer expectations is very important for service providers to address how to satisfy customers. For marketers, this is a topic that is frequently studied to better manage customer expectation and customer perception, thus, improving customer satisfaction.
2.3.2. Distinction between customer satisfaction and service quality
Customer satisfaction refers to the emotional reactions appear when customers use a service; service quality refers to providing service and concentrating on specific elements of service (Zeithaml& Bitner, 2000). Customer satisfaction is a short-term reaction while service quality usually a long-term experience.
Studies showed that there is a causal relationship between service quality and customer satisfaction (Cronin & Taylor, 1992; Kotler, 2006; Zeithaml& Bitner, 2000). Nguyen (2006) claimed that higher service quality will lead to higher customer satisfaction.
2.3.3 Assessment model of customer satisfaction and service qualitySERVQUAL model
Parasuraman et al. (1985) proposed the GAP model of service quality. They claimed that the service gap is the gap between service expectations and service perception. Parasuraman et al. (1985) suggested that service expectations are affected by 3 factors: (1) word of mouth; (2) personal needs; (3) past experience. Customers who have high expectation on service will normall have lower satisfaction with the service provided.
Based on the GAP model, Parasuraman et al. (1988) introduced the SERVQUAL quality scale with 10 determinants including reliability, access, credibility, communication, competence, responsiveness, understanding, courtesy, security and tangibles. Although these 10 determinants can cover most of the aspects of service, it is difficult to measure or apply all these determinants in many cases. Thus, Parasuraman et al. (1988) modified their original model into a new model with 5 factors: (1) tangibility; (2) reliability; (3) responsiveness; (4) assurance; (5) empathy. Parasuraman et al. (1988) divided these 5 factors into 44 variables for customer expectations and 22 variables for customer perceptions. Then, they proposed the formulation of service quality as the follow:
Service quality = Perceptions - Expectations
After various tests, Parasuraman et al. (1988) finally reduced the number of variables to 21 observed variables for their model. Parasuraman et al. (1988) claimed that SERVQUAL is a proper scale for service quality and it can be used in different service fields.
ACSI model
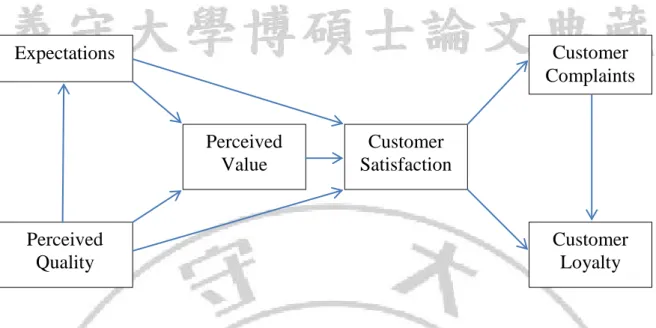
The American Customer Satisfaction Index was developed by Fornell et al. (1996). This is a popular index for customer satisfaction in 10 different economic sectors. ACSI model includes 17 questions related to customers’ perceptions of the value and quality of a product or service in comparison to their ideal expectations. The ACSI model is shown in Figure 2.2
Figure 2.2 Customer satisfaction measurement model for public service in England In 2004, the Public Service Renovation Department of England introduced the customer satisfaction measurement model as shown in Figure 2.3
Figure 2.3: Customer satisfaction measurement model for public service in England Expectations Perceived Quality Perceived Value Customer Satisfaction Customer Complaints Customer Loyalty Service Delivery Time Information Profesionalism Employees’ Attitude Customer Satisfaction 10
This model accurately explained 67% of the factors influencing customer satisfaction on public service. Service delivery is the factor affecting customer satisfaction the most, followed by time, information, professionalism, and employees’ attitude.
2.4. Overview on Customs Activities and the Customs
Department of Ba Ria – Vung Tau
2.4.1. Overview on the Customs activities
Concept of Customs department
Customs department is a government agency established to manage export-import, entry – transit – exit, smuggling, and illegal transportation of goods through the border.
Le (2003) claimed that Customs service is a type of public service. Customs service has the following characteristics:
- Serving the country’s benefit, and ensuring citizen rights and duties; - Founded by the State to conduct a certain task of State management; - Fees paid by recipients of the service are transferred into the State budget.
Registration procedure in Customs departments
Registration procedure is the time when the Customs department receives and checks the all the registration documents. It is the first stage of the Customs activities.
Through checking the documents, the Customs authorities can decide the status of the goods and make decision whether the goods are passed, held for further check, or required for modification. The steps of checking documents relies on the following factors:
- Results of the risk management system; - Customs personnel’s professional ability;
- Data processing system of the Customs network; - Internet line;
- Professional software for Customs departments; - Professionalism and knowledge of the applicants.
12
2.4.2. Introduction to the Customs Department of Ba Ria – Vung Tau
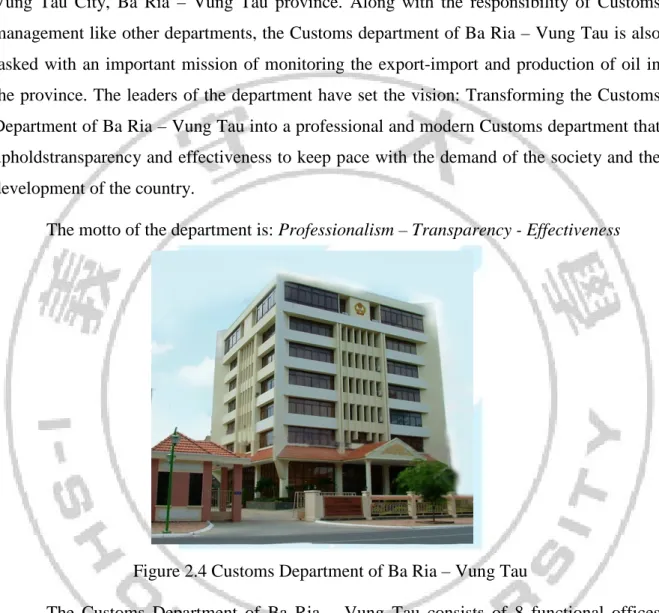
The Customs Department of Ba Ria – Vung Tau was founded in 1979, located in Vung Tau City, Ba Ria – Vung Tau province. Along with the responsibility of Customs management like other departments, the Customs department of Ba Ria – Vung Tau is also tasked with an important mission of monitoring the export-import and production of oil in the province. The leaders of the department have set the vision: Transforming the Customs Department of Ba Ria – Vung Tau into a professional and modern Customs department that upholdstransparency and effectiveness to keep pace with the demand of the society and the development of the country.
The motto of the department is: Professionalism – Transparency - Effectiveness
Figure 2.4 Customs Department of Ba Ria – Vung Tau
The Customs Department of Ba Ria – Vung Tau consists of 8 functional offices supporting the leaders of the department; 5 Customs branches and 3 specialist units. The department is currently employing 275 official employees and 39 contract employees. For the educational background, the department has 11 employees have Master degree, 206 employees have university bachelor degree, 37 employees have college bachelor degree, 14 employees have vocational degree, and 7 employees graduated from high school.
The organizational structure of the Customs Department of Ba Ria – Vung Tau is shown in Figure 2.5.
Figure 2.5 Organizational Structure of Customs Department of Ba Ria – Vung Tau
The number of registration document sets applied to the department is shown in Table 2.1
CUSTOM DEPARTMENT OF BARIA – VUNG TAU
CUSTOMS BRANCHES CONSULTING OFFICES
FIELD TEAM
General office
Human resources office
Inspection office
Management office
Smuggling prevention and law violation management
Export – Import tax
Centra of data and IT
Communist Party Activities
Finance
Department activity management Risk Management
Customs branch of Phu My Port
Customs branch of Cai Mep Port
Customs branch of Vung Tau Port
Customs branch of Cat Lo Port
Customs branch of Con Dao
Customs branch for post-clearance
Customs Monitoring Team
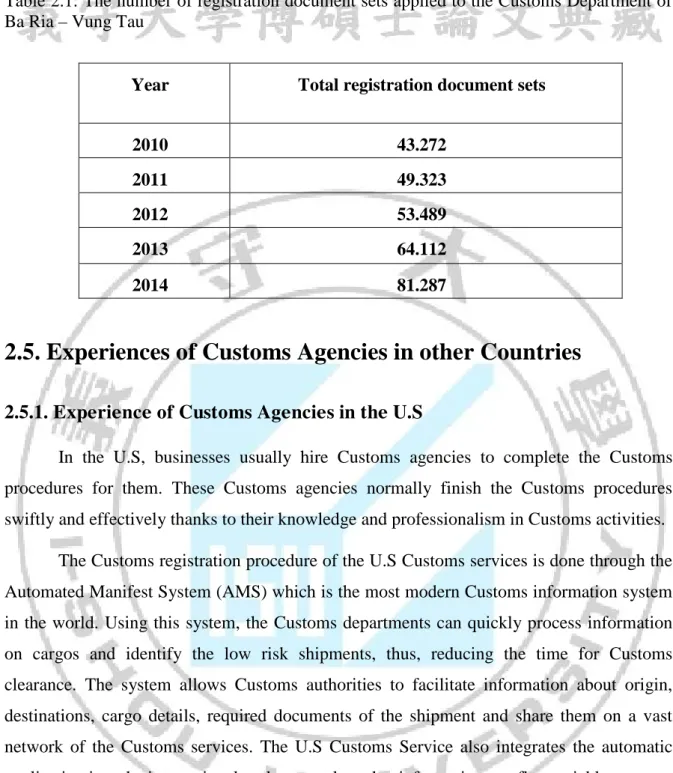
Table 2.1: The number of registration document sets applied to the Customs Department of Ba Ria – Vung Tau
Year Total registration document sets
2010 43.272
2011 49.323
2012 53.489
2013 64.112
2014 81.287
2.5. Experiences of Customs Agencies in other Countries
2.5.1. Experience of Customs Agencies in the U.S
In the U.S, businesses usually hire Customs agencies to complete the Customs procedures for them. These Customs agencies normally finish the Customs procedures swiftly and effectively thanks to their knowledge and professionalism in Customs activities.
The Customs registration procedure of the U.S Customs services is done through the Automated Manifest System (AMS) which is the most modern Customs information system in the world. Using this system, the Customs departments can quickly process information on cargos and identify the low risk shipments, thus, reducing the time for Customs clearance. The system allows Customs authorities to facilitate information about origin, destinations, cargo details, required documents of the shipment and share them on a vast network of the Customs services. The U.S Customs Service also integrates the automatic application into the international trade network so that information can flow quickly.
To increase the satisfaction of registration applicants, the Customs Service considers employees training as its first priority to maintain a competent and professional workforce for the Customs service. The information technology is utilized to improve the service quality. Huge database is built to provide updated and precise information for every Customs agency and government office to quickly recognize and identify a shipment detail and decide the following procedures for that shipment. The database also helps custom agencies to assess the risk in a complete way to ensure the homeland security. The
procedures are standardized and unified at high level to make Customs procedures run more effectively.
2.5.2. Experience of Customs Agencies in South Korea
With the aim to build a Customs service at the highest quality, the Customs Department of South Korea considers customer satisfaction as the highest quality of the Customs agencies. In South Korea, 100% of imported goods are processed through the electronic Customs network, of which 80% of the cases do not need to submit documents in hard copies. To achieve that result, the Customs Department of South Korea has built the automatic clearance system to reduce the unnecessary steps in clearance process and the waste of time. At the present, it only takes about 90 minutes for a cargo to get the clearance. Even with that short time, the application of information technology allow the Custom Department of South Korea have detailed information on the shipments coming in and out of the country.
The Customs Department of South Korea hire Samsung to build and run its Customs network. To keep the clearance procedure effective and efficient, the Customs Departments of South Korea divide businesses into different categories for better management. For example, businesses that are put in high ranking category normally get the Customs procedures done quickly while those in low ranking category will be a target for detail checkup.
To improve customer satisfaction, the Customs Department of South Korea has built the Customs Charter to display their commitment to the following statements:
- The business satisfaction to the Customs services is the first priority;
- The Customs Service of South Korea always strives to make the Customs service more friendly, convenient and effective;
- Time and assets of businesses are the priorities, thus, Customs officers are required to fulfill their tasks rapidly and precisely;
- The Customs Department ensures the transparency and convenience in the Customs service;
Business orientation is the aim of the Customs Service. The Customs Department always listen to the opinions of businesses to make the Customs service more effective and completed.
2.5.3. Experience of Customs Agencies in Singapore
The Customs Service of Singapore is considered as the best Customs service in South East Asia with modern technology and convenient procedures. The Customs Service of Singapore has long used a nation-wide electronic trade network called Trade Net. Applicants can provide their information such as shipment detail, tax, code, etc. on this network.
By using Trade Net, the documents of a shipment can be transferred at any time of the day. The time required for getting a clearance reduces from 2-7 days to only 10 minutes. Owing to the Trade Net, both government and businesses can cut a huge cost in processing Customs documents. The application of information technology also helps Singaporean government manage the export-import activities much more effectively and conveniently.
2.5.4. Experience of Customs Agencies in Thailand
In the past, the Customs procedures of Thailand were quite similar to those of Vietnam. However, the Customs Service of Thailand has realized the importance of information technology in Customs management and increasingly utilize this tool.
Customs agencies of Thailand used to exchange information with each other through their electronic data network since 2000. In the recent years, the Customs Service of Thailand switches to a new automated Customs system call “e-Customs” to better manage Customs activities. The new automated system is deeply integrated into the network of government, banks, and businesses. It can facilitate and process information with higher security and faster response time. In the future, the system will be integrated into ASEAN Customs System to fulfill the ASEAN Customs Development Plan.
2.5.5. Lessons for the Customs Department of Vietnam
Through the experiences from the Customs Service of the U.S, South Korea, Singapore and Thailand, there are some good lessons for the Customs Department of Vietnam
First, the electronic Customs system is a must-have system nowadays if the Customs department wants to improve the effectiveness of Customs activities and customer satisfaction.
Second, hiring a company with appropriate capability to establish Customs network, software and computer network may be a good solution to help the Customs department to apply information technology into its activity.
Third, integrating the clearance system with the network of the relevant management agencies, bank and businesses to reduce time of registration and improve management ability. The Customs procedures should be standardized based on the international standard.
Fourth, the opinion and attitude of frontline employees are important to improve the management.
Fifth, the Customs department should deliver information through different channel to make businesses understand the benefit of electronic Customs systems.
Sixth, gradually adapting the old database into the new one. Building a unified database system for the Customs service.
Seventh, displaying a strong commitment in serving customers, especially businesses.
Eighth, improving the checking activities after clearance.
CHAPTER 3: RESEARCH METHODOLOGY
In this chapter, the author mentioned the research method used in this study to investigate the relationship between factors of the proposed research model. The author also introduced the research process, questionnaire design and data analysis of the thesis.
3.1. RESEARCH DESIGN
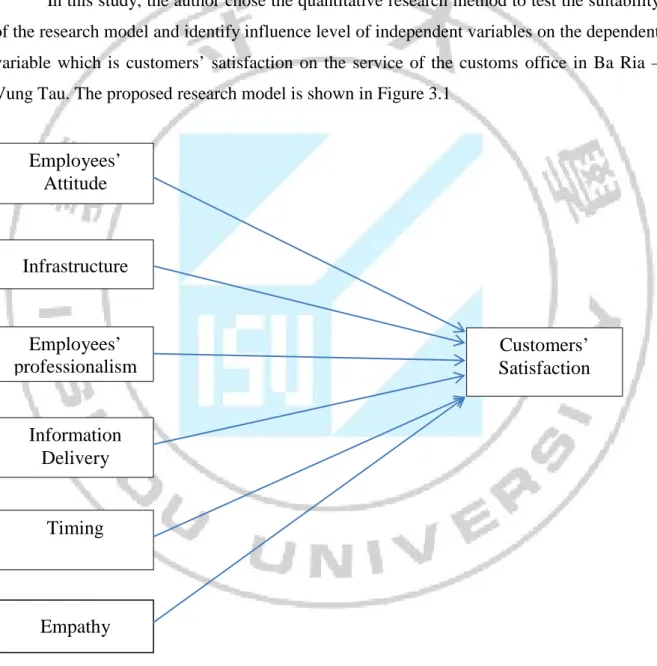
In this study, the author chose the quantitative research method to test the suitability of the research model and identify influence level of independent variables on the dependent variable which is customers’ satisfaction on the service of the customs office in Ba Ria – Vung Tau. The proposed research model is shown in Figure 3.1
Figure 3.1 Proposed Research Model
Employees’ Attitude Employees’ professionalism Information Delivery Infrastructure Customers’ Satisfaction Timing Empathy 18
Based on the proposed research model, there are 6 hypotheses in this thesis:
H1: There is a positive relationship between employees’ attitude and customers’ satisfaction
H2: There is a positive relationship between infrastructure and customers’ satisfaction
H3: There is a positive relationship between employees’ professionalism and customers’ satisfaction
H4: There is a positive relationship between information delivery and customers’ satisfaction
H5:There is a positive relationship between timing and customers’ satisfaction
H6:There is a positive relationship between empathy and customers’ satisfaction
3.2. RESEARCH PROCESS
The research process consists of 5 steps:
Step 1: Reviewing literature to find the potential factors for the model and the questionnaire. Along with the existing factors and observed variables of the previous studies, the author may add the items or factors deemed suitable for the thesis.
Step 2: Running the pilot test for the proposed questionnaire to check the reliability and correction of the items in the questionnaire. The author adjusts the items based on the results of the pilot test and comes up with the official questionnaire
Step 3: The author runs the EFA test to explore the convergence of the data and thus, identifying the underlying constructs of the data. After the EFA test, the author comes up with the official research framework and hypotheses.
Step 4: The author runs the descriptive statistics to investigate the categories of customers. Then, the author runs the correlation analysis and regression analysis. Through the result of the regression analysis, the author may find the influence of each factor and the relationship between independent variables and dependent variable.
Step 5: The author also runs the ANOVA analysis and T-test to compare the different groups of participants.
3.3. QUESTIONNAIRE DESIGN
The factors and questionnaire items are drawn from the literature review of studies on customers’ satisfaction of other scholars. To fit the situation in the context of the customs field in Vietnam, the author adds some items deemed suitable in the case of this study. The preliminary questionnaire is put in a pilot test to check the meaningfulness and the reliability of each item. With the Cronbach’s Alpha value and suggestion from participants in the preliminary survey, the author corrects the items and forms the official survey.
In the questionnaire, there are two parts: (1) Part 1: Demographic Information, (2) Part 2: Survey on Customers’ Satisfaction. In the first part of the questionnaire, the author used the nominal scale to categorize the students into groups (gender, age, business types…). In the second part of the questionnaire, the author used 5-point Likert scale to measure the observed variables. (1 – Totally Disagree, 2 – Disagree, 3 – Neutral, 4 – Agree, 5 – Totally Agree). As Likert scale is a type of interval scale, it is possible to collect and analyze the collected data to identify the correlation, and the regression relationship between independent variables and dependent variable.
The content of the second part of the questionnaire is shown in Table 3.1
Table 3.1: Survey on Customers’ Satisfaction
No. Code Description
Infrastructure
1 IF1 The computer network of the customs office is strong enough to receive and process registration data
2 IF2 The customs registration software functions smoothly and stably.
3 IF3 The wifi, newspaper and customs documents are always available at the customs office for people waiting for their turn.
4 IF4 The customs office is clean and comfortable
5 IF5 The office arrangement is convenient for registration 6 IF6 The parking area and waiting room are arranged nicely.
Employees’ Attitude
7 EA1 The employees carefully and patiently guide you to do registration process
8 EA2 The employees care about your demands
9 EA3 The employees are polite when communicating with you 10 EA4 The employees understand your problems
Employees’ Professionalism
11 EP1 The employees have good knowledge about the documents related to their profession
12 EP2 The employees treat customers equally 13 EP3 The employees are skillful in using computer
14 EP4 The employees are provided with proper equipment to do their job
Information Delivery
15 ID1 You are provided with precise information on registration 16 ID2 You trust the information security of your registration files
17 ID3 All documents related to the registration process are provided to every customer
18 ID4 You can access easily to the related information whenever you need
Timing
19 TM1 You do not have to wait too long until your registration turn
20 TM2 The customs office completes your registration process punctually as promised
21 TM3 The receipt of registration documents is smooth
Customers’ Empathy
22 CE1 The customs office and authorities always listen and learn the needs of businesses
23 CE2 The customs office and authorities are willing to receive complaints, opinions and suggestions from businesses
24 CE3 The customs office and authorities always provide the best conditions for businesses in export – import activities.
25 CE4 The customs office and authorities always offer good advices to businesses in need of consultancy
26 CE5 The customs office and authorities know and understand the needs of businesses
Customers’ Satisfaction
27 CS1 The business is satisfied with the consultancy and support of the 21
customs office upon the customs law
28 CS2 The business is satisfied with the way the customs office handle the problems related to the customs law
29 CS3 The business is satisfied with the service quality of the customs office during the registration time.
3.4. SAMPLING DESIGN
The official survey is conducted on customers who are businesses coming to the customs office of Ba Ria – Vung Tau to register the tax process. There are 150 participants in the study. The sampling method is the convenient sampling as it saves time and cost for the author. The questionnaires are given directly to representatives of businesses who come to the office to register for the tax process.
3.5. DATA ANALYSIS
After collecting data, the author analyzed them using the statistical software SPSS version 20. The analytical tools include reliability test, EFA test, descriptive statistics, regression analysis, ANOVA and T-test.
3.5.1 RELIABILITY TEST
Testing the reliability of the scale was assessed by coefficient Cronbach's alpha (Cronbach, 1951): Cronbach's alpha (α) is the coefficient of reliability used to test scale measuring correlations of observed variables. The purpose of this test is to investigate the reliability of the items in the scale. Variables with the item-total correlation less than 0.3 will be removed and only variables with the item-total correlation higher than 0.65 are chosen. Though there are researchers require the correlation higher than 0.8, however, if the concepts are new to respondents, it is acceptable to have Cronbach’s Alpha value higher than 0.6 (Nunnally, 1978; Peterson, 1994; Slater, 1995).
3.5.2. EXPLORATORY FACTOR ANALYSIS (EFA)
After running Cronbach’s Alpha test, the EFA test is used to reduce the number of items. This method is useful for identifying the groups of variables and exploring the relationship between variables. There are several values needed to look at in the EFA test.
Factor Loadings is the correlation coefficient between variables and factors. System load factor of greater than 0.3 is said to be consistent with a larger sample size of 150 observations.
Bartlett’s Test of Sphericity: The test is used to test the null hypothesis H0. The Barlett’s Test has significant value lower than 0.05, the null hypothesis is rejected.
KMO (Kaiser-Meyer – Olkin) value: The KMO value should range from 0.5 to 1. If it is lower than 0.5, the factor analysis is no longer suitable.
Cumulative of variance is the variance percentage was explained by all the factors. Criteria for acceptance factor analysis with cumulative variance greater than 50% with Eigenvalue must be greater than 1.
Rotated component matrix: Variables that have factor loading value lower than 0.45 will be removed. The study used the principle components method that requires the factor loading higher than 0.45 to fit the model.
3.5.3 REGRESSION ANALYSIS
After analyzing the factors exploring EFA, the multiple regression analysis will be ran to investigate the relationship between the independent constructs and the dependent construct. The regression analysis also provides information on the influence level of each independent construct on the dependent factor. The formula of the regression is:
In which:
SAT: Customers’ satisfaction
F = {F1, ...,Fj}: The variable scale factors affect the SAT β = {β0, ..., βj}: regression coefficient impact on SAT ei: error
CHAPTER 4: RESULTS AND DISCUSSION
In this chapter, the author provided the analysis results including descriptive statistics, reliability test, exploratory factor analysis, and regression analysis. The author also discussed the case of the Custom Department of Ba Ria – Vung Tau based on the results drawn from these analyses.
4.1. Descriptive Statistics
4.1.1. Gender
Table 4.1 shows the percentage of participants based on their gender. The result shows that the majority of the participants are male (71%) while female participants only account for 29 percent of the total participants.
Table 4.1: Descriptive statistics on gender of the participants
Gender N Percentage (%)
Female 44 29
Male 106 71
Total 150 100.0
4.1.2. Working Position
The descriptive statistics result shows that the majority of participants who directly come to the customs department are specialists and staff of companies. These two groups account for 63 percent of the participants. On the other hand, participants at the management level account for 37 percent of the participants as shown in table 4.2.
Table 4.2: Descriptive statistics on working position of the participants
Working Position N Percentage (%)
Director 8 5
Deputy Director 14 10
Head of Department 17 11
Deputy Head of Department 17 11
Specialist 48 32
Staff 46 31
Total 150 100
4.1.3. Experience with Register Customs Procedure
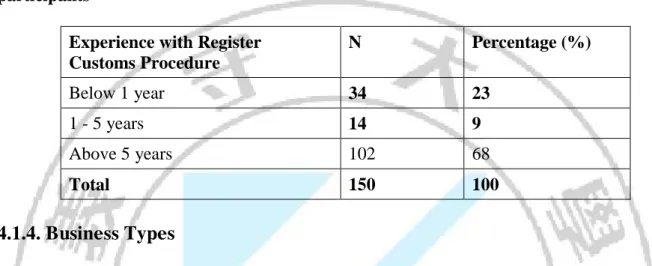
In table 4.3, the result shows that 68 percent of the participants are people who have experience of working on customs register procedures for more than 5 years. In other words, nearly two-thirds of the participants are quite experienced with the register procedure.
Table 4.3: Descriptive statistics on experience with register customs procedure of the participants
Experience with Register Customs Procedure N Percentage (%) Below 1 year 34 23 1 - 5 years 14 9 Above 5 years 102 68 Total 150 100 4.1.4. Business Types
Result of the survey shows that limited company is the business type that account for highest percentage (39%), followed by private company type (29%) and joint stock company (26%) as shown in table 4.4. The result indicates that customs department should study carefully the characteristics of these business types to improve the satisfaction of participants in general.
Table 4.4: Descriptive statistics on business types
Business Type N Percentage (%)
Joint Stock Company 30 26
Limited Company 58 39
Private Company 44 29
Other 18 12
Total 150 100
4.1.5. Industry
The result shows that the manufacturing industry accounts for the highest percentage with 39 percent, followed by the construction industry (27%) and mining industry (20%). The agriculture/forestry/fishery industry takes the lowest percentage with only 4 percent. The result is shown in table 4.5.
Table 4.5: Descriptive statistics on industry Industry N Percentage (%) Manufacturing 59 39 Construction 40 27 Service/Commercial 15 10 Agriculture/Forestry/Fishery 6 4 Mining 30 20 Total 150 100
4.2. Model Assessment
4.2.1. Reliability TestThe requirement of the reliability test was mentioned in Chapter 3. If any observed variable does not meet the requirement of the test, it will be removed from the scale. The result of the first reliability test is shown in Table 4.6
Table 4.6: Reliability Test in the first time
Independent variables and dependent variables Number of Observed variables Cronbach’s Alpha Item-Total Correlation Cronbach’s Alpha if Item deleted Infrastructure 6 0.835 0.194 0.870 Employee’s Attitude 4 0.768 0.315 0.861 Professionalism 4 0.794 0.431 0.827 Information 4 0.777 0.443 0.787 Time 3 0.910 0.800 0.888 Empathy 5 0.854 0.269 0.899 Satisfaction 3 0.961 0.868 0.979
While the Cronbach’s Alpha coefficients of the scale passed the requirement of the reliability test, the Item-Total Correlation of one observed variable in the scale for factor “Infrastructure” did not meet the requirement (0.194 < 0.3). Thus, the author removed that observed variable of the scale for factor “Infrastructure” and ran the reliability test for the second time. The result of the new reliability test is shown in Table 4.7
Table 4.7: Reliability Test in the second time Indepedent variables and dependent variables Number of Observed variables Cronbach’s Alpha Item-Total Correlation Cronbach’s Alpha if Item deleted Infrastructure 5 0.870 0.353 0.864 Employee’s Attitude 4 0.768 0.315 0.861 Professionalism 4 0.794 0.431 0.827 Information 4 0.777 0.443 0.787 Time 3 0.910 0.800 0.888 Empathy 5 0.899 0.680 0.820 Satisfaction 3 0.961 0.868 0.979
Results in Table 4.7 shows that all the Cronbach’s Alpha coefficients are larger than 0.6, and the Item-Total Correlation coefficients are larger than 0.3 for all remaining observed variables . Thus, the author concluded that the scale’s reliability is accepted and could be used for the official survey. The author proceed to the EFA test with the data collected from the survey.
4.2.2. Exploratory Factor Analysis
After conducting the reliability test to form a good scale for the research, the author started doing survey. Data collected from survey were put in the exploratory factor analysis to identify the latent variables in a large set of variables. The EFA was conducted using the SPSS software. The EFA results in the first test are shown in Table 4.8 and Table 4.9
Table 4.8: General EFA results in the first time
Kaiser-Meyer –Olkin Measure of Sampling Adequacy 0.852
Barlett’s Test of Sphericity Approx. Chi-Square 3912.552
df 276
Sig 0.000
Cumulative Percentage 77.619%
Eigenvalue 1.319
Table 4.8 shows that the KMO result satisfied the requirement (KMO = 0.852 > 0.5). It means that it is possible to run the EFA for the test. The result of Barlett’s Test also proved satisfactory for the factor analysis (Sig. = 0.000 < 0.05). In the total variance explained results, there are 5 factors have the eigenvalue higher than 1 and the cumulative percentage at 77.619 percent.
Table 4.9: Rotated Component Matrixa in the first time
Component 1 2 3 4 5 Q2 0.895 Q3 0.887 Q1 0.826 Q13 0.786 Q5 0.762 Q14 0.748 Q11 0.636 Q22 0.479 Q23 0.810 Q17 0.752 Q9 0.744 Q8 0.721 Q7 0.717 Q26 0.712 Q24 0.697 Q12 0.909 Q18 0.894 Q16 0.872 Q15 0.401 Q21 0.920 Q19 0.898 Q20 0.848 Q10 0.916 Q4 0.911 28
Table 4.9 shows the result of rotated component matrix with 5 components extracted from the EFA test. The result shows that the observed variables Q22 and Q15 have the factor loadings value lower than 0.05. Thus, the author removed these two observed variables from the data and conducted the EFA again. The EFA result in the second time is shown in Table 4.10 and Table 4.11
Table 4.10: General EFA results in the second time
Kaiser-Meyer –Olkin Measure of Sampling Adequacy 0.844
Barlett’s Test of Sphericity Approx. Chi-Square 3626.146
df 231
Sig 0.000
Cumulative Percentage 80.625%
Eigenvalue 1.307
Table 4.10 shows that the KMO result satisfied the requirement (KMO = 0.844 > 0.5). It means that it is possible to run the EFA for the test. The result of Barlett’s Test also proved satisfactory for the factor analysis (Sig. = 0.000 < 0.05). In the total variance explained results, there are 5 factors have the eigenvalue higher than 1 and the cumulative percentage at 80.625 percent.
Table 4.11: Rotated Component Matrixa in the second time Component 1 2 3 4 5 Q2 0.898 Q3 0.884 Q1 0.834 Q13 0.775 Q5 0.760 Q14 0.733 Q11 0.632 Q23 0.826 Q17 0.771 Q9 0.764 Q8 0.745 Q7 0.734 Q26 0.718 Q24 0.704 Q12 0.917 Q18 0.894 Q16 0.879 Q21 0.925 Q19 0.910 Q20 0.859 Q10 0.920 Q4 0.913
Table 4.11 shows the rotated component matrix with 5 component extracted. The result show that the factor loadings of all variables satisfied the conditions. However, as the component 5 only have 2 observed variables, the author decided not to use this component in the model.
4.2.3. Adjusted Research Model
With the new component extracted from the EFA, the author reconstructed the research model with 4 independent variables and 1 dependent variable. The new research model is shown in Figure 4.1.
Figure 4.1: Official Research Model
With the new component extracted from the EFA, the author reconstructed the research model with 4 independent variables and 1 dependent variable. The new research model is shown in Figure 4.1.
The new hypotheses are listed as the following:
H1: Infrastructure positively influence business’s satisfaction
H2: Employee’s Attitude positively influence business’s satisfaction
H3: Information positively influence business’s satisfaction
H4: Time positively influence business’s satisfaction
4.3. Correlation Analysis
The correlation analysis result is shown in Table 4.12. The result shows that the depedent variable was correlated with the independent variables with the significant value lower than 0.05 in all cases. This result means that the regression analysis may be used to explain the relationship between factors. However, as the independent variables are also correlated to each other, it is important to check whether the collinearity occurs or not.
H1
Infrastructure
Employee’s Attitude
Business’s Satisfaction
H3Information
H4Time
H2 31Table 4.12: Correlation Analysis Results
Satisfaction Infrastructure Attitude Information Time Satisfaction Pearson Correlation 1 .654** .872** .410** .400** Sig.(2-tailed) .000 .000 .000 .000 N 150 150 150 150 150 Infrastructure Pearson Correlation .654** 1 .680** .400** .197* Sig.(2-tailed) .000 .000 .000 .015 N 150 150 150 150 150 Attitude Pearson Correlation .872** . .680** 1 .527** .325** Sig.(2-tailed) .000 .000 .000 000 N 150 150 150 150 150 Information Pearson Correlation .410** .400** 527** 1 .158 Sig.(2-tailed) .000 .021 000 .053 N 150 150 150 150 150 Time Pearson Correlation 400** .197* .325** .158 1 Sig.(2-tailed) .000 .015 .000 .053 N 150 150 150 150 150
**. Correlation is significant at the 0.01 level (2-tailed). *. Correlation is significant at the 0.05 level (2-tailed).
4.4. Regression Analysis
In Table 4.13, the Adjusted R2 of the model is 0.782, satisfying the condition of R2 (larger than 0.6). The result means that the constructed regression model can explain for 78.2 percent of the data. In the ANOVA test, the p-value is 0.000 (smaller than 0.05), indicating that the variance is not equal and it is possible to proceed to the regression analysis.
Table 4.13: Model Summary
R .887
R2 0.788
Adjusted R2 0.782
ANOVA Sig. 0.000b
In Table 4.14, the VIF coefficients of all independent variables are lower than 10, thus, it can be concluded that the collinearity do not occur. The p-value of X1, X2, X4 are lower than 0.05 (Sig. X1 = 0.19 < 0.05; Sig. X2 = 0.000 < 0.05; Sig. X4 = 0.001 < 0.05), indicating that these independent variables have relationship with the dependent variable. Only X3 has the p-value higher than 0.05 which signifies that there is no relationship between X3 and the dependent variable.
Table 4.14: Regression Analysis
Factors B Standardized
Beta
Sig. Tolerance VIF
Constant -.646 .011 X1 .157 .124 .019 .534 1.873 X2 .936 .784 .000 .431 2.322 X3 -.078 -.074 .105 .719 1.390 X4 .144 .133 .001 .893 1.120
Based on the result of the Table 4.14, the regression formula can be written as follow: Y = - 0.646 + 0.157X1+ 0.936X2 + 0.144X4. Y: Businees’ Satisfaction X1: Infrastructure X2 : Employee’s Attitude X4 : Time
Based on the regression analysis result, the hypotheses are stated as following:
H1: Infrastructure positively influence business’s satisfaction =>Accepted
H2: Employee’s Attitude positively influence business’s satisfaction =>Accepted
H3: Information positively influence business’s satisfaction =>Rejected
H4: Time positively influence business’s satisfaction =>Accepted
Based on the standardized beta coefficients, the influence level of each independent variable on the dependent variable is shown in Figure 4.2. Accordingly, Employee’s Attitude has the highest influence on the business’ satisfaction, then Time and Infrastructure.
Figure 4.2: Influence level of Independent Variables on Dependent Variable
4.5. T-test and ANOVA analysis
T-test and ANOVA analysis are two analytical tools used to check whether there is difference among groups upon the satisfaction toward the customs register service. The groups put in the T-test and ANOVA analysis are Gender (T-test), Working Position (ANOVA), Experience with Register Service (ANOVA), Business Types (ANOVA), Industry (ANOVA). The results of T-test and ANOVA are shown in Table 4.15
Infrastructure
Time
Employee’s Attitude
β2= 0.784
Business Satisfaction
β3= 0.133
β1= 0.124
Table 4.15: T-test and ANOVA results
Groups Sig.F Conclusion
1 Gender F=5.448, Sig.F=0.021 Different
2 Working Position F=7.463, Sig.F=0.000 Different 3 Experience with Register
Service
F=0.725, Sig.F=0.473 Not different
4 Business Types F=0.941, Sig.F=0.422 Not different
5 Industry F=0.631, Sig.F=0.641 Not different
Results from Table 4.15 show that there is no difference in the categories of Experience with Register Service, Business Types and Industry. However, there is difference among the Gender and Working Position categories on the satisfaction with the customs register service. Regarding the Working Position, participants who are staff and specialists displayed higher satisfaction toward the customs register service, while participants at the management level seemed to have lower satisfaction (Staff: Mean = 3.82; Specialist: Mean = 3.74; Vice Head of Department: Mean = 3.29; Head of Department: Mean = 2.9; Vice Director: Mean = 2.9; Director: Mean = 2.54). It could be that participants at the management level are more demanding and stricter toward the customs service. For the Gender group, male participants (Mean = 3.57) displayed higher satisfaction than female participants (Mean = 3.24).
CHAPTER 5: CONCLUSION AND
RECOMMENDATION
5.1. Research Summary
This study was conducted to evaluate the satisfaction of customers coming to the Customs office of Ba Ria – Vung Tau to register the Customs documents. The scale first included 6 independent variables and 1 dependent variable. After the reliability test and EFA, the number of independent variables reduced to 4 variables (Infrastructure, Employee’s Attitude, Information, and Time) and the dependent variable remained the same. 200 questionnaires were delivered to participants, after inputting and cleaning data, the author removed 50 questionnaires and accepted 150 questionnaires. Data were analyzed by the software SPSS version 20.
Answering the first and second research questions, the analysis result shows that the customer’s satisfaction is influenced by three factors: (1) Employee’s Attitude (Standardized Beta = 0.784), (2) Time (Standardized Beta = 0.133) and (3) Infrastructure (Standardized Beta = 0.124). This result is understandable as the frontline Customs employees are the ones who directly work with customers. Thus, their attitude may have substantial influence on the satisfaction of customers. Besides, as customers of the Customs office are businesses, they really care about how fast their customs procedures could be completed as it directly affects the performance of their companies. This concern is displayed through the fact that Time is the second factor that has the highest influence on the satisfaction. Aside from Employee’s Attitude and Time, customers also considered Infrastructure of a Customs office as a significant factor. It could be said that a Customs office with modern facilities and equipment can really help improve the work effectiveness of customs employees. It also helps businesses to look for information and register their customs documents more easily with the help of technology. With the rapid growth of Vietnam’s economy, the number of business is rapidly growing. Thus, the application of technology in customs activities is unavoidable and significantly helpful.
5.2. Contributions of the Research
The author has tested and explored factors influencing the customer’s satisfaction when doing register service at the Customs Office of Ba Ria – Vung Tau. The study provided insights on customer’s satisfaction which helps leaders of the office come up with better plan to improve customer’s satisfaction. Findings from this research can also serve as a reference for future researchers who want to study the similar topic.
5.3. Limitations of the Research
First of all, the research is limited in the scale of research. The author only conducted the survey only in the Customs Office of Ba Ria – Vung Tau. Thus, the study lacks the comparison between the participants in Ba Ria – Vung Tau and other locations. Besides, the author only applied the quantitative research method in this study. If a qualitative research was also conducted, the data could revealed more insights on the customer’s satisfaction and factors influencing the satisfaction.
5.4. Recommendations
Among the influencing factors, Employee’s Attitude was rated as the most significant one by the participants. It is understandable as the frontline Customs employees are the ones who directly work with customers. Thus, their attitude may have remarkable influence on the satisfaction of customers. Therefore, the Customs office should frequently check and improve the attitude of Customs employees to improve the satisfaction. The Customs office managers may consider issuing a code of conduct or a guideline that displays proper steps and manner of employees when working with customers. The Customs office should also provide training to employees based on the content of the guideline or code of conduct so that Customs employees really understand how they should respond and work with customers. The training may come from internal training source or external training source. Besides, the Customs office should also employ different communication channels such as call center or website to receive the opinions and suggestions of customers to better improve the service quality of Customs office.
The second factor influencing customer’s satisfaction is time. Because customers of the Customs office are businesses, time is very valuable for them. Thus, the Customs office should try to reduce the wasting time when working on the register documents of customers.
The office may set a policy on how long a register document should be finished. The office should also frequently review the processing time of the Customs service and come up with plan to reduce the unnecessary time.
Finally, Infrastructure is the third factor influencing customer’s satisfaction. Although the Customs office had invested to increase the quality of infrastructure of the office in the recent years, it still needs to be improved a lot as more businesses are opnening in Vietnam. Thus, the current infrastructure may not be able to meet the actual demand. While the budget for the Customs office is limited, the officials may consider investing in the practical things such as online register system or register software first. If the online system function well, both businesses and Customs officers can save a lot of time and money to do the register phase like before. In the author’s view, computerizing register procedure should be the priority in the investment plan in Customs office.
5.5. Suggestions for Future Researches
First of all, future researchers who want to study the similar field may consider extend the scale of the research to other provinces with larger number of participants. The extension of research scale can increase the generalizability and application of their studies. Secondly, future researches should also apply the qualitative research methods such as focus group or interviews with Customs officers or businesses representative to explore more insights on the customer’s satisfaction and factors influencing the satisfaction.