~
Pergamon
0043-1354(95)00310-X
War. Res. Vol. 30. No. 11, pp. 2723-2727, 1996
Copyright © 1996 Elsevier Science Ltd Printed in Great Britain. All rights reserved 0043-1354/96 $15.00 + 0.00
USE OF THE FIBER-OPTICAL M O N I T O R IN E V A L U A T I N G
T H E STATE OF F L O C C U L A T I O N
C H I H P I N H U A N G *@ and G W O - S H A N G C H E N
Institute of Environmental Engineering, National Chiao Tung University, Hsinchu, Taiwan, R.O.C.
(First received January 1995; accepted in revised form November 1995)
Abstract--On-line monitoring the state of coagulation/flocculation enables automatic control of coagulation process concerning the condition of the chemical additive. In this study, a new optical monitoring technique is employed to evaluate the extent of flocculation, which involves measuring the fluctuating light intensity transmitted through a flowing suspension. This technique functions as a sensitive monitor providing an empirical index related to the state of aggregation, and could form the basis of an on-line technique. The assessment for feasible application in monitoring the flocculation through this technique is the primary objective of this study. Also, a series of batch tlocculation tests is performed under different conditions. These results indicate that the fiber-optical technique is useful in monitoring the state of aggregation with different coagulants and the variation of turbidity conditions. Furthermore, a reliable index related to the floc size is provided and can be applied in determining the optimal dosage of coagulant. Copyright © 1996 Elsevier Science Ltd
Key words--coagulation, flocculation, optical monitor, floc size, alum, polymer
INTRODUCTION
The coagulant dose in water treatment plants in Taiwan is determined on the basis o f the historical data collected by the operators or the trial-and-error data of periodic jar tests. However, excess develop- ment in the proximity o f water sources has subsequently resulted in high concentration of suspended solid in the river, lake, and reservoirs. The water turbidities may vary from 10 N T U to thousands of N T U in a few hours when heavy rainfall occurs within the area of an upstream watershed. The influent turbidities and subsequently the coagulant demand are time-variant. Therefore, recent attempts to determine the chemical dosage in the coagulation process has frequently failed to adapt to the turbidity variation in the effluent of water treatment plant, such as delayed judgment or inattention during off-duty hours at night. Such an occurrence would result in inefficient settling as well as shortening the filtration run. The dosage determined by these leads to both poor, in real-time, dose control for the highly changeable quality of raw water and the inefficient use of expensive chemicals without an actual dose.
Several methods available to determine the coagulation dose are based on either turbidity measurements or particle counting. Turbidity measurements are relatively easy to take but fail in characterizing the size of floc as well as the state of aggregation. Particle counting is effective only for the *Author to whom all correspondence should be addressed.
highly diluted suspension in order to avoid a coincidental effect and fail to provide real-time responses during the operation. Therefore, an on-line method is required for controlling the chemical dose in the coagulation/flocculation.
A simple but sensitive optical technique has been developed to monitor the state of aggregation of coagulation/flocculation (Gregory, 1985, 1986), which is based on the measurement of fluctuations in the intensity of light transmitted through a flowing suspension. The fluctuations arising from random variations with the mean number of particles in the sample that follow the Poisson distribution, and the root mean square (rms) value of the intensity fluctuations are dependent on the scattering co- efficient and the square root o f the concentration. By measuring the rms value of the fluctuation signal (V~,,) and the average transmitted light intensity (de), the aggregation or deaggregation in the suspension can be quantified regarding the ratio o f V~, to dc (ratio). This ratio value is also represented as flocculation index (F-index) in this study.
The fiber-optical technique has been first intro- duced by Gregory and Nelson (1984). In their investigation, a comparison has been made of the measured rms of kaolin suspension with varying coagulant dosing. However, the effect of particle concentration and coagulant dose for those different coagulants has not been discussed here. Jackson and Tomlinson (1986) successfully applied this technique in automatic coagulation control. Some other approaches involve characterizing the condition on 2723
2724 C. Huang and G.-S. Chen a l u m sludge d e w a t e r i n g ( K a y o d e a n d G r e g o r y , 1988),
e v a l u a t i n g floc size with on-line m o d e ( M a t s u i a n d T a m b o , 1991) as well as d e s c r i b i n g d y n a m i c s a n d mechanisms, o f c o a g u l a t i o n ( C h i n g et al., 1994).
T h e specific objective o f this w o r k is to e v a l u a t e a n d refine this optical m o n i t o r i n g t e c h n i q u e whilst c o n s i d e r i n g the t u r b i d i t y v a r i a t i o n . T h r e e types o f c o a g u l a n t h a v e b e e n applied here to e v a l u a t e its feasibility for w i d e s p r e a d application. By c h a n g i n g the c o a g u l a n t ' s dosage, different ratio o u t p u t s (F- index) c o r r e s p o n d i n g to v a r i o u s flocculation/settling states h a v e b e e n investigated for the d e v e l o p m e n t o f in-site o p e r a t i o n i n f o r m a t i o n .
MATERIALS AND METHODS
Synthetic suspension
A given amount of kaolin in powder form (Nacalai Tesque) was mixed with tap water (ionic strength = 3 x
10 -3 N) to prepare a test suspension with desired turbidity. The 20, 80, and 200 NTU turbidity of test suspensions were prepared to simulate the low, middle, and high turbidity conditions in raw water. The size distribution of the kaolin suspension was measured by Coulter Counter (Chennelyzer 256, USA) with a 20-/1m aperture tube (effective range = 0.4--12 #m). Particles in the suspension had a mean volume diameter of 2.1/~m with a relatively wide size distribution.
Preparation of coagulant solution
The chemicals used as coagulants in this study include aluminum sulfate (Alum, Merck), polyaluminum chloride (PAC1), and cationic polymer (Dimethyl Diallyl Am- monium Chloride "Catfloc", Calgone). Stock solutions of alum with various concentrations were prepared according to the experimental need of dosage. The test solutions of PACI and polymer were prepared by diluting the liquid chemicals to a desired concentration just prior to the addition into the test suspension.
Experimental setup
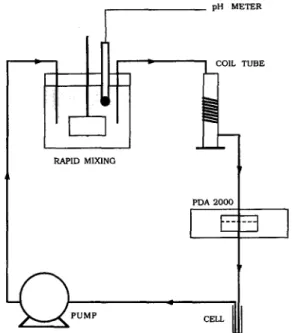
An optical analyzer, photometric dispersion analyser (PDA, Rank Bros., Cambridge, UK), was used to monitor the state of coagulation/flocculation of suspension. A schematic diagram of the experimental apparatus is shown in Fig. 1. The mixing device was an acrylic vessel (15cm x 12cm) with four bafflers. A 11 volume of suspension in the vessel was agitated by an 80- x 13-mm rectangular flat blade at 300 rpm. The velocity gradient in the mixing vessel was calculated to be around 900 s ~. A 2 m length of 1-mm (id) Tygon tube coiled around cylinder (28 mm) was used to siphon the suspension from the mixing vessel to the flow-through detector of PDA, where the ratios of the fluctuations in transmitted light intensity to the average transmitted light intensity were monitored continu- ously. After flowing through the detector, the suspension flow into a cell was located downstream of the PDA for a short stay and was ready to pump back to the mixing vessel by a peristaltic pump (Waterson, USA). The flow rate in the conveying tube was 2.5 ml/min, and the Gt value in the tube was calculated to be around 104 based on the formula derived from Gregory (1987a).
Experimental development
Prior to the experiment, the raw samples with different turbidities were prepared and were strongly mixed for over one hour to homogenize the suspension. The initial PDA setup was the adjustment of de output to 10 volts by flowing distilled water through the PDA. The suspension without
. , l
I I lRAPID MIXING
pH METER
~ T U B E
PDA 2000
F =
a
PUMPCELL
Fig. 1. Schematic diagram of experimental arrangement.
coagulant addition was then flowed through the detector and the rms output was adjusted to around 0.5 volts.
The pH value was maintained at around 7 while adding a strong base (0.1 M NaOH) or acid (0.1 M NaC104) in the suspension throughout the experiment. The agitation of mixing vessel was maintained at 300 rpm (G = 900 s -~) in order to provide well contacts for chemicals and particles. Considering the time for mixing, flowing, and stability of PDA reading, the ratio reading was determined at 5 minutes after coagulant was added into the mixing vessel. The major function in the mixing vessel is to complete the contact of chemical with particles. However, a duration of around 4 minutes may cause a slight flocculation in the mixing vessel. Thereafter, the coagulated particles in the mixing vessel were flowed through the coiled tube. In the tube, the particles were aggregated as a result of the shear force of laminar flow in the coiled tube. Flow rate in the conveying tube was 2.5 ml/min, and the Gt value in the tube was calculated to be about l04 based on the formula derived from Gregory 0987). This particle aggregation can be indicated by a marked increase in the rms value, therefore, also the ratio value of PDA. The coagulated particles in the mixing vessel were then taken to measure their zeta potential with zeta meter (Zeter-Meter System 3.0, Zeter-Meter Inc., U.S.A.). After recording the ratio value, the suspension in the mixing vessel was taken to run the jar tests (Jar Tester, Phips & Bird, USA) for slow mixing (17-20rpm, 20min) and quiescent settling (20 min). Consequently, zeta potential (as measured previously), residual turbidity (turbidimeter, HACH, USA) and ratio output of PDA (represented as F-index) corresponding to various dosages of alum were obtained. The same procedure was repeated for the testing of PAC1 and polymer (Catfloc).
RESULTS AND DISCUSSION
Optimal dosage of coagulants
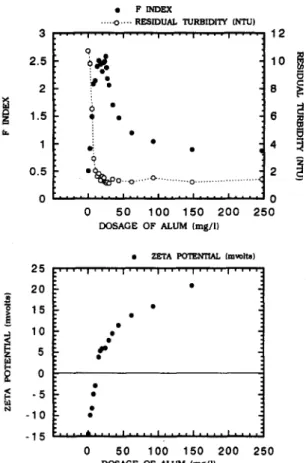
(I) Aluminum sulfate. T h e c h a n g e o f F - i n d e x w i t h
the a l u m d o s a g e for the 20 N T U t u r b i d i t y o f k a o l i n s u s p e n s i o n is s h o w n in Fig. 2. T h e residual t u r b i d i t y o f these suspensions, m e a s u r e d after m i x i n g a n d settling, is included in this figure. W i t h the increase
Fiber-optical monitor in evaluating the state of flocculation 2725 3 2.5 2 1.5 1 0.5 0 • F I N D E X . . . . - o . . - . R E S I D U A L T U R B I D I T Y C N T U ) . . . . i . . . . i . . . . i . . . . i . . . . i . . . . q o • e • o ~ i ~ O o , P L , ~ o . , , , , c " . . . O . . . i . * I . . . . n . . . . i . . . . i . . . . i . . . . 0 50 100 150 200 D O S A G E O F A L U M { r a g / l ) 4 2 0 2 5 0 12 8 2 5 2 0 1 5 5 m 0 - 5 -10 - 1 5 • Z E T A P O T E N T I A L ( r e v o l t s ) . . . . I . . . . I . . . . I . . . . I . . . . I . . . . l . . . . dk . . . . I . . . . I . . . . I . . . . I . . . . 0 50 100 150 200 250 D O S A G E O F A L U M ( r a g / l } . . . . °
Fig. 2. Typical F-index curve corresponding to the residual turbidity and zeta potential with varying alum dosage at
pH 7.
of dosage, the F-index is increased from the initial value of 0.5 up to a maximum value of 2.5, and then declines to a stable value of 1. The maximum of the F-index corresponds to the lowest value of the residual turbidity, thereby verifying the effectiveness of the F-index for the determination of optimal coagulant's dosage. The results for the suspension with either 80 or 200 N T U turbidity also exhibit a similar relationship between the F-index and the residual turbidity (data is not shown). Notably, the raise of residual turbidity of water is insignificant when the alum is dosed beyond the optimal condition. Dentel (1991) has pointed out that the mechanism of alum coagulation at neutral pH is the charge neutralization and enmeshment or the enmeshment in major. Although the overdose of coagulant may result in the re-stabilization of particles, the floc formed by those particles is still large and sufficiently dense to settle in the jar tests. Figure 2 also shows the F-index of flocculated particles corresponding to the zeta potential of coagulated particles. This figure reveals that, in spite of initial turbidity, the coagulated particles possessing isoelectric point of zeta potential on the surface produce the maximum ratio value (F-index). This occurrence indicates that when the alum coagulation reaches the optimal state, at which the surface charge
of kaolin may be neutralized, the optimal floc is then formed. Beyond the optimal state, the reversal of the surface charge of coagulated particles occurs as too much alum interacts with kaolin, in which the F-index of flocculated particles decreases with an increase in the coagulant dosage. We can expect that the peak or plateau of the ratio curve may offer a reliable index to determine the optimal dosage of alum.
(2) PACI. The trend of F-index curves for PAC1 is
theoretically similar to those for alum as shown in Fig. 3. According to the zeta potential of coagulated particles, the coagulated particles possess the net positive charge as the F-index reaches a maximum value. Dentel (1991) points out that the colloidal PAC1 particles possess a relatively high area-to- volume ratio, thereby resulting in the effective adsorption onto the negatively charged particles through the charge neutralization. Therefore, the surfaces of particles coated with PAC1 still offer some sites which are available for the adsorption of polynuclear alum complex. This results in the continuous growth of aggregated particles until the saturation of adsorption. Furthermore, the coagu- lated particles bring the positive charge as the growth of floc reaches the maximum state.
The required dosage for PAC1 in the coagulation/ flocculation process is only about half of that for
• F I N D E X - - . @ - * - - R E S I D U A L T U R B I D I T Y ( N T U . . . . I~l . . . . I . . . . I . . . . u . . . . u . . . . o . . . . I ' ' x | • • 2 • • | ( l ~ l l l : l m ~ J = = _ _ ~ l l L , . _ . ~ , l ~ _ . | . o . 4 ~ , m l . . . . , I k . n i 0 0 100 200 300 400 500 600 700 DOSAGE OF PAC (ppm} 1 6 12 ~ 25 20
i '°
5 0 N -10 -15, " • Z E T A P O T E N T I A L ( m v o l t s I " " I . . . . I . . . . I_ . . . . I . . . . I ' ' " @ ' , , 0 100 200 300 400 500 600 D O S A G E O F P A C ( p p m } '00 Fig. 3. Typical F-index curve corresponding to the residual turbidity and zeta potential with varying PAC1 dosage at2726 C. Huang and G.-S. Chen 1.5 0.5 • F I N D E X . - . . . . o - - R E S I D U A L T U R B I D I T Y ( N ' r U ) ' ' ' ' 1 . . . . I ' ' ' ' 1 . . . . I ' ' ' ' 1 . . . . I ' ' ' 2 0 I o ,o 18
:
/
o ~ o 14I.o o
• • • 8 ~"
" . . . ';"6
, , , & , , , , I , , , , I , , , , 0 1 2 3 4 5 6 D O S A G E O F C F T ( p p m l 40 3 0]
2o
I ,°
o ~ - l o -20 • Z E T A P O T E N T I A L ( m v o l U . . . . I . . . . I ' ' ' ' l . . . . I . . . . I ' ' I ' ' '/
!
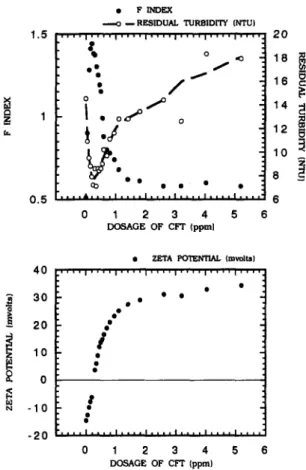
g . . . . I , , , , I , , , , . . . . I . . . . I , , 0 1 2 3 4 D O S A G E ; O F C F I " ( p p m ) I . . . . 5 6Fig. 4. Typical F-index curve corresponding to the residual turbidity and zeta potential with varying Cat Floc-T (CFT)
dosage at pH 7.
alum according to the results from real-plant study of Kaeding et al. (1992). However, our results indicate that the dosage of PAC1 with respect to the maximum value of the F-index is higher than alum. In the case of 20 NTU, 1.4 mg/1 as A1 of alum is required to reach a maximum of F-index (Fig. 2). However, 7.3 mg/l as A1 of PACI is required to obtain an optimum state of flocculation (Fig. 3). Due to the better floc formation of PAC1 than alum, the required dosage of PACI to form the floc, i.e., sumciently large to settle, is much less than the dosage required for the formation of the largest floc. This fact infers that the F-index of PACI coagulation with the optimal dosage corresponding to the effective settling is less than the maximum value of the F-index curve as shown in the figure. Therefore, it is expected that the control strategy for P D A by measuring the F-index for alum is different from that for PACI. However, the ratio value of P D A is undoubtedly an effective index to evaluate the state of either alum or PACI coagulation.
(3) Polymer. The changes of F-index with the
dosage of polymer for the 20 NTU, 80 N T U and 200 N T U turbidity of kaolin suspensions have been investigated with the same procedure as alum. The typical result for 20 N T U turbidity of suspension is shown in Fig. 4. The curve for the F-index corresponding to the polymer dosage exhibits a
sharper peak than those to the alum dosage. According to the residual turbidity of supernatant after jar-mixing/settling, the maximum of the F-index corresponds to the lowest of residual turbidity. Once the polymer dosage is over the saturation of polymer bridging, surplus polymer has a tendency to destroy the polymer bridging between particles. This would consequently result in the decrease of floc size as well as the increase of residual turbidity after settlement. Zeta potential results indicate that the particles are coagulated by a certain amount of polymer to form the largest floc, on which the surface still brings a slight negative charge. More negative charges occur on this so called "largest floc" as original particle concentration (initial turbidity) of suspension is increased. This phenomenon can be accounted schematically as Fig. 5. For dilute suspensions, the particles are coated by the polymer with an optimal dosage to neutralize their surface charges, thereby resulting in zero electrophoretic mobility of the coagulated particle. As Gregory (1987b) has indi- cated, for cationic polymer and negative particles, charge neutralization plays a large part in the flocculation process. However, in the case of high particle concentration (that is 200 N T U of turbidity in this study), an optimal dosage of polymer to form the largest floc is unnecessary to neutralize surface charges of original particles. Unlike alum and PACI, the raise of residual turbidity of supernatant after sedimentation is observed to be significant when the polymer is overdosed in the suspensions. This phenomenon occurs since the coagulation mechan- isms for polymer are adsorption and bridging rather than surface precipitation for aluminum salt. The
Low turbidity
High turbidity
Medium turbidity
Fig. 5. Schematic representation of floc formation by the optimal dosage of polymer for suspensions with low,
Fiber-optical monitor in evaluating the state of flocculation
Table I. The maximum of F-index of PDA monitoring and corresponding turbidity of supernatant in the jar-test with three different coagulants; alum, PACI, and polymer, at three different turbid
conditions
Alum PAC1 Polymer
Turbid conditions Residual Residual Residual
(Initial turbidity) F-index turbidity F-index turbidity F-index turbidity
20 NTU 2.50 1.80 5.21 0.40 1.44 7.90
80 NTU 2.94 8.90 25.93 2.60 3.29 10.60
200 NTU 3.06 9.70 6.44 3.10 4.35 8.40
2727
overdose of polymer produces restabilized particles since no sites are available for the formation of bridge, thereby resulting in the rupture of floc by extending mixing (Weber, 1972).
Coagulant effect
Table 1 summarizes the maximum of the F-index with three different coagulants; alum, PAC1, and polymer at three different turbid conditions. The residual turbidity of supernatants corresponding to each optimal dosing o f coagulants after jar-mixing /settling are also included. The PAC1 clearly has the largest value of maximum at each turbid condition among the three coagulants. This result infers that the flocs produced by PAC1 are larger than the other two coagulants. This phenomenon results from the polynuclear aluminum complexation of PAC1 during flocculation, ultimately enhancing particle aggrega- tion, flocs formation and settling. The measurements of residual turbidity in the supernatant after jar-mixing/settling also provide this evidence, for which the value of residual turbidity corresponding to the maximum of the F-index for PACI coagulation is lower than the residual turbidity while using alum or polymer as a coagulant. This table also indicates that F-index value for the polymer coagulation is lower than alum coagulation only under the 20-NTU condition. However, the values are higher than alum coagulation under 80 and 200-NTU conditions. The optimal conditions for the alum and polymer coagulation with middling turbid water produce the similar size of floc. The size of the largest floc formed by polymer coagulation with highly turbid water is significantly larger than that formed by alum coagulation, and conversely that size is smaller than that formed by alum coagulation for the low turbidity (20 NTU) condition. Gregory (1987b) has indicated that the flocs produced by polymers are considerably stronger and larger than aggregates formed by alum coagulation. Under the low turbidity condition, there are insufficient particles to provide adequate collision among particles, thereby resulting in excess segment of polymer folding back onto the particle surface. Therefore, this insignificant action of polymer bridging produces small floc during the flocculation.
CONCLUSION
The output value of P D A can accurately reflect the state of initial formation of floc. The maximum
of this ratio value related to the best formation of floc is a reliable index for the determination o f the optimal dosage for alum and polymer coagulation. The ratio value of PAC1 coagulation with the optimal dosage corresponding to the effective settling is less than the maximum of ratio value. Results obtained in this study indicate that this fiber-optical technique is a feasible tool in monitoring the flocculation behavior as well as in determining the dosage of alum, PAC1 and polymer for the varying turbid water.
Acknowledgements--This work is fully supported by the grant of National Science Council, R.O.C. (NSC-83-0410- E-009-027). Sincerely thanks are expressed to Dr J. Gregory, University College London U.K., for valuable suggestions.
REFERENCES
Ching H. W. (1994a) Dynamics of coagulation of clay particles with aluminum sulfate. Env. Eng. ASCE 28, 169-189.
Ching H. W. (1994b) Dynamics of coagulation of kaolin particles with ferric chloride. ;Vat. Res. 28, 559-569. Dentel S. K. (1991) Coagulation control in water treatment.
Crticial Rev. in Env. Control 21, 41-135.
Gregory J. (1985) Turbidity fluctuations in flowing suspension. J. Colloid Interface Sci. 105, 357-372. Gregory J. (1987a) Laminar dispersion and monitoring of
flocculation processes. J. Colloid Interface Sci. 118, 297-409.
Gregory J. (1987b) Flocculation by polymers and polyelec- trolytes. In Solid/Liquid Dispersion (Edited by Tadors T. F.), Academic Press, London, pp 163-181.
Gregory J. and Nelson D. M. (1984) A new optical method for flocculation monitoring. In Solid-Liquid Separation
(Edited by Gregory J.) pp. 172-182. Ellis Horwood, Chichester.
Gregory J. and Nelson W. D. (1986) Monitoring of aggregates in flowing suspension. Colloid and Surf. 18, 175--188.
Jackson P. J. and Tomlinson E. J. (1986) Automatic coagulation control---evaluation of strategies and tech- niques. Wat. Supply 4, 55-67.
Kaeding U. W. (1992) A direct comparison between aluminum sulfate and polyaluminum chloride as coagulants in a water treatment plant. War. Supply 10, 119-132.
Kayode T. O. and Gregory J. (1988) A new technique for monitoring alum sludge conditioning. Wat. Res. 22, 85-90.
Matsui Y. and Tambo N. (1991) Online ttoc size evaluation by photometric dispersion analyzer. Wat. Supply 9,
71-78.
Weber W. J. Jr. (1972) Physicochemical Processes pp. 75, John Wiley & Sons, New York.