Department of Business Administration
I-Shou University
Master Thesis
Research on the relationship between role conflict,
role ambiguity, organizational justice and job
satisfaction of public servants: an empirical study of
tax department of Ho Chi Minh City
Advisor: Wen Huei Yang, Ph.D
Co-advisor: Ho Sy Tan, Ph.D
Graduate Student: Khoi Pham Thanh
ACKNOWLEDGEMENTS
Organizational behavior course, Human Resource Management course, Organizational Management Course, Science Research method course, Statistical Analysis,… always be interested by researchers and management all over the world which are applied in management in order to improve the performance of organizations, agencies and enterprises.
During the time being instructed the knowledge about management by Professors and Experts from Ishou School, Hong Bang International University, University of Electric Power; it has a valuable meaning in managerial activities, especially in states owned organizations and enterprises.
By that reason, I have chosen the topic of “Research on the relationship between role, organizational justice and job satisfaction of public servants: an empirical study of tax department of Ho Chi Minh City.”
I strongly appreciate the instruction of Professor – Dr. Wen Huei Yang, Dr. Ho Sy Tan and other instructors, my classmates support. You opinion would help us improve more.
ABSTRACT
During last period, in Vietnam, there lacks the attention and research on the relationship between role conflict, organizational fairness and job satisfaction in general tax organizations and tax bureaus in Ho Chi Minh City in particular, therefore this research have the main purpose is to review the above relationship.
Researches have collected the officers serving at the Department of Taxation offices in Ho Chi Minh City to investigate personal characteristics which will have a huge difference in the role conflict, fairness in the organization and the job satisfaction; as well as considering what is the connection between the role conflict, fairness in the organization with job satisfaction.
There are 300 people in the sample choosing for a survey question.
The data collection is performed for statistical analysis using SPSS 17.0. Many major hypotheses were tested by methods like descriptive statistics, reliability analysis, t-test, correlation analysis and linear regression.
The results showed that personal characteristics will make a significant difference on the variables, indicate how the variables will have strong relationship between the role conflict, organizational justice and the job satisfaction.
Keywords: job satisfaction, organizational justice, role conflict, role ambiguity
TABLE OF CONTENTS
ACKNOWLEDGEMENTS ... I ABSTRACT ... II TABLE OF CONTENTS ... III LIST OF FIGURES ... VII LIST OF TABLES ... VIII
CHAPTER 1 INTRODUCTION ... 1
1.1 CONCERN SETTING ... 1
1.2 PURPOSE AND SIGNIFICANCE OF THE STUDY ... 2
1.3 SCOPE OF THE STUDY ... 2
CHAPTER 2 LITERATURE REVIEW ... 4
2.1 RESEARCH ESTABLISHMENT’S ROLE CONFLICT AND ROLE AMBIGUITY ... 4
2.1.1 Definition ... 4
2.1.2 The theory of role conflict and role ambiguity ... 4
2.1.3 The scale conflict/role ambiguity ... 11
2.2 JUSTICE IN THE ORGANIZATION ... 12
2.2.1 Definition ... 12
2.2.2 Characteristics of justice/fairness ... 13
2.2.3 Factors affecting the perception of organizational justice ... 15
2.2.4 Scales of justice ... 15
2.3 JOB SATISFACTION ... 17
2.3.1 Job satisfaction in works ... 17
2.3.2 Theory of Maslow's hierarchy of needs ... 18
2.3.3 ERG Theory ... 19
2.3.4 Adams fairness theory ... 20
2.3.5 Achievement motivation theory of Clelland (1988) ... 20
2.3.6 Measurement of job satisfaction ... 21
2.3.7 Influential factor affect to job satisfaction ... 21
CHAPTER 3 RESEARCH METHODOLOGY ... 24
3.1 RESEARCH MODEL AND THEORIES... 24
3.2 RESEARCH SAMPLE ... 30
3.3 RESEARCH TOOLS ... 30
3.3.1 Assessment scale of conflict and role ambiguity ... 30
3.3.2 Assessment scales of justice in organizations. ... 30
3.3.3 Assessment scales of job satisfaction ... 31
3.3.4 Assessment scales of personal characteristics ... 31
3.4 DATA ANALYSIS ... 31
3.4.1 Descriptive Statistics ... 31
3.4.2 Reliability analysis ... 31
3.4.3 T-test analysis ... 32
3.4.4 Regression Analysis ... 33
CHAPTER 4 RESEARCH RESULT ... 34
4.1 DEMOGRAPHIC ELEMENTS ... 34
4.2 REDEFINE DEMOGRAPHIC FACTOR’S GROUPS ... 35
4.2.1 Gender information ... 36 4.2.2 Age ... 37 4.2.3 Education ... 38 4.2.4 Experience ... 39 4.2.5 Working position ... 40 4.2.6 Working department ... 41 v
4.3 RELIABILITY ANALYZING ROLE CONFLICT, ROLE AMBIGUITY, ORGANIZATION JUSTICE -DISTRIBUTIVE/INTERACTIVE AND JOB
SATISFACTION... 42
4.4 ANALYSING DIFFERENCES ... 45
4.5 ANALYZING CORRELATION AND REGRESSION ... 57
CHAPTER 5 CONCLUSIONS AND RECOMMENDATIONS ... 64
5.1 RESEARCH CONCLUSIONS: ... 64 5.2 PRACTICAL MEANINGS ... 70 5.3 RECOMMENDATIONS ... 73 REFERENCE ... 76 APPENDIX ... 79 vi
LIST OF FIGURES
Figure 1 Maslow's hierarchy of needs ... 18
Figure 2 Clayton Alderfer‘s ERG theory ... 19
Figure 3 Research framework ... 24
Figure 4 Gender ... 37
Figure 5 Age ... 38
Figure 6 Education ... 39
Figure 7 Experience ... 40
Figure 8 Working position ... 41
Figure 9 Working department ... 42
LIST OF TABLES
Table 1 The statistics describe the demographic factors-frequency analysis ... 34
Table 2 The statistics describe the demographic factors-mean analysis ... 35
Table 3 The statistics describe gender ... 36
Table 4 Age Statistics ... 37
Table 5 Education Statistics ... 38
Table 6 Experience Statistics ... 39
Table 7 Working position Statistics ... 40
Table 8 Working department Statistics ... 41
Table 9 Reliable statistics for role conflict (C1 -> C3) ... 43
Table 10 Reliable statistics for role conflict (C1 -> C3) ... 43
Table 11 Reliable statistics for role conflict (C1 -> C2) ... 44
Table 12 Reliability statistics of role ambiguity, distribution justice, procedural justice, interactive justice, organization justice and job satisfaction. ... 44
Table 13 Group of t-test statistics by gender ... 46
Table 14 Group of t-test statistics by age ... 48
Table 15 Group statistics by Education ... 50
Table 16 Group statistics by Experience/Number of working years ... 52
Table 17 Group statistics by Working Position ... 53
Table 18 Group statistics by Working department ... 55
Table 19 descriptive statistics ... 57
Table 20 Pearson correlation ... 58
Table 21 Sample Overview ... 60
Table 22 ANOVAa ... 60
Table 23 ANOVAb ... 61
Table 24 Coefficientsa ... 62
Table 25 Summary of Research Results (Rejected; Accepted) ... 64
CHAPTER 1 INTRODUCTION
1.1 CONCERN SETTING
The taxation is one of the important sectors in the development process of the economy, in any country. Just imagine if there is no revenue, how the country can survive and develop.
Increasingly, the society is developing to integrate with the outside world, therefore, it requires Taxation Officers have to be more professional to meet the economic-social development and ensure the revenue for our nation in terms of integration.
Similar to other fields in our nation, leaders of Financial Ministry, General Department of Taxation, Taxation Departments, are interested in planning and implementing administrative reform of the country to provide public services in the best way for all organizations and individuals, in accordance with the quality policy “dedicated transparency, accuracy and efficiency". Organizing the operational structure and human resource is one of core content of Reform Plan in which human is the goal as well as the motivation to proceed.
Therefore, in addition to other resources, human resource is factors that are critical to the success of the reform. To manage well the human resource, management should have appropriate solutions to helps the officers feel satisfied with their works, by that, they will have better behavior and serving quality. It contributes to the state administrative efficiency and effectiveness. With these positions, I chose the topic of “Research on the relationship between role
conflict, organizational justice and job satisfaction of public servants: an empirical study of Tax department in Ho Chi Minh City.”
1.2 PURPOSE AND SIGNIFICANCE OF THE STUDY
The purpose of my study is to figure out the effects of characteristics on job satisfaction; check theories about the relationships and clarify them which helps management do well in conflicts, ensure the transparency, fairness in organizations, in order to find the solutions in job satisfaction of officers. Hence, the leaders will build human resource management plans for the state offices, manage and contribute tasks reasonably.
1.3 SCOPE OF THE STUDY
The study was conducted on 300 workers, in which 53 % are male/47 % female, nearly 27 % were managed/unmanaged over 73 %, 100 % full-time, more than 70 % of the officials - officials/near 30 %.
However, due to conditions and working condition, when proposing solutions to improve the efficiency of human resource management, the study can only be implemented in the agencies of state organizations which is serving the national activities in over the country.
On the basis of considering the individual characteristics affect how the variables (role conflict, role ambiguity, organizational justice, job satisfaction) study focused analysis relationships by turning the role conflict, ambiguous role in organizing the fair for job satisfaction.
On the basis of considering how the individual characteristics affect the variables (role conflict, role ambiguity, organizational justice, job satisfaction) study focused analysis relationships by turning the role conflict, role ambiguity in organizing the fair for job satisfaction.
CHAPTER 2 LITERATURE REVIEW
2.1 RESEARCH ESTABLISHMENT’S ROLE CONFLICT AND ROLE AMBIGUITY
2.1.1 Definition
Conflict is a fundamental change; confuse the operation with the previous balance of organization. Often, it will be the concerns related to personal rights, prestige, honor, and moral values ... between members or groups.
Conflict is a process in which one party feels that their rights are against by the other party or affected negatively by the actions of the other party.
The ambiguous role: If you are not sure about the role that you are undertaking, you will be easily confused and work ineffectively.
2.1.2 The theory of role conflict and role ambiguity
2.1.2.1 Conflicts
a. The nature of conflict
In an organization, leaders always are afraid of the conflicts, they consider that conflicts need to be avoided and solved soon.
According to the prospect of "human relations in administration" thought that the organization always has the possibility of conflict, conflict between the goals of the separate individuals and organizations, between the department level being in charge and ability of each person, and so on.
According to modern views on the management, it is was found in a well-organized can still appear conflict , negative conflict will cause more problems as reducing labor productivity, affect the mental state and health of everyone, even the group disintegrated..
But there are also positive effects if the conflict creates different perspective, provide important additional information for the other views that the normal organization cannot display. It lays out the scientific evidence, forms different options suitable for more realistic conditions.
By the way, it creates conditions to show off the emotion and willingness of people. Conflict is considered positive if it leads to improvement of the organization.
b. Conflict reason
There are many reasons leading to conflicts in the organization. One of them can be
• Incomplete organization, not tightly organized, not good discipline, unclear tasks contribution.
• Informal groups in organizations, appears negative leaders, individual extremists or many excitable people
• Difficult operating conditions like the lack of resource, technical equipment, the lack of workers, the unemployment.
• The unknowlege members, the lack of necessary harmony due to the age gap, education, experience, communication.
• Unfairness in welfare and communication.
• Inappropriate leadership, no agreement in leading…
• Besides, there are many different reasons such as: The goal inconsistency, disparity in resources, other obstacles, psychological stress from many people, the ambiguity of authority, communication is skewed...
c. Types of conflicts
Generally there are two types of conflicts:
• Functional conflict: is the one which have weak density. They can make people more active, creative and create necessary stress for work efficiency.
• Unfunctional conflict: negatively affects to organization groups, it destroys relationships of both parties.
d. Individual conflict
The most common type of conflicts is between the assigned tasks and the ability of individuals, it would be a conflict between job requirements and individual needs. There are situations, due to the requirements that staff have to work on weekends and holidays. That often conflicts with individual demands of them to entertain or rest with their family in these occasions.
The individual conflicts also appear when overworking, job unsatisfaction, stressful working.
e. Conflict among individuals
Individuals in organizations always have differences because their value and willingness are affected by socialization and depended on family traditions, education level, and experience…Therefore the explanations about events and expectation about the relationship with other people in their organization is the huge difference. Conflict comes from the difference of value and demand of individuals.
Main reasons for these individuals include:
• Discrimation or unfair treatment in the company
• The lack of information in organization
• Conflict between members which have works depending each other but are in contradictory roles.
• Difficulties creating by surrounding environment.
Besides, there is also a form of individuals’ conflict, but this is the peak of positive conflict, it can be outside of the organization, between external relationships. Individuals in this situation will always launch a question is that: How we can do better him/her? A typical story for this case is Steve Jobs. He criticized all other outstanding individuals in the field of technology alone, turning around Bill Gates, Microsoft and Google, Dell, everything is in the eye of Steve Jobs seems really difficult to do well. There used to explode a war of technology between Apple and Microsoft Corporates, but now, let’s try to take a look back to what they brought to our modern livers.
f. Conflict between individuals and groups
The type the conflict between individuals and group perspectives or rights does not match. For example, in a majority of the sales team members consider that they should decrease the price for that product to consume more goods and faster. But the group has an individual does not endorse to reduce their prices will affect profits and customers may think that they offer low qualified products. The two sides do not agree and conflicts may occur.
g. Conflict between groups
In an organization, there are many groups existing. Their interests and perspectives of the group do not unite, because the task assignment is not reasonable cooperation , lack of respect or understand each other .
Conflict between groups often come from the following reasons:
• Dependence on each other with work completion, it can happen when they work together, the dependence can be serial nature or reliance through together.
• The goal is not similar. The inherent similarities sometimes exist between groups by their personal goals.
• Threat. If there is no threath, both parties seem to cooperate better and lead to effective relationship. When one party realizes the threath against with another, they often do not announce, and use it.
• The commitment of the team. When the group becomes attached, the conflict between groups is increasing.
• Attitude of win - lose.
Conflict will happen when there is an existance of the following conditions:
• When a person identify or express conflict situations as win - lose.
• When a group decides to pursue their separated goals.
• When a group understands their needs but trying to hide them up.
• When a group effort to increase its position.
• When a group uses intimidation to achieve obedience or submission.
• When a group overpays attention to the target, the location of it.
• When a group intends to take advantage of the other group, whenever possible.
• When an isolated group by other groups.
When conflicts occur between groups will make the information is reduced, distorted perception, creating suspicion and prevent proper understanding of human behavior and motivations of the other side.
2.1.2.2 Ambiguous role
Ambiguous role happens when labors meet the following situations:
+ Responsibility: not clear about their responsibility in certain situation, such as to be distributed a task without a clear instruction.
+ Expecting work results: work with a person who do not unite in standards set or methods used to evaluate work results.
+ Development direction: labors do not know what direction they should develop from the beginning point.
There are some reasons for aambiguous roles:
a. Ambiguous in roles
When what people expect others in this role as opposed to what we expect to see them in other roles are considered conflicting roles. This often brings confusion, frustration for workers because it is difficult to reconcile multiple levels of power and behavior, especially when they conflict themselves.
b. Incompatibility in the role
As different people have different expectations of a person in the same role that is incompatible with the role. For example, team members who wish to grant you easy- on, while your boss then want you to be strict with your staff. It is hard to satisfy both different wishes, especially when they are so different.
Incompatibility of roles can also occur when the standards and goals of individual employees is not consistent with the standards and goals of the business; or image that they envision themselves is not coincide with the image that other people think of them.
c. “Overload” situation
Labors have to be in charge of so many roles that may lead to overloading situations. It is an extreme form of conflict in the role.
d. “Lack of load” situation
In contrast to the overload that workers may fall into a "lack of load situation." This occurs when an individual feels that he can actually take on more roles over or a few roles larger.
“Lack of load” also cause the stressful situation because it will afftect personal image. A person will feel unreliable, unrespected and right value. They will be bored and work uneffectively when working tasks they feel so low with their ability.
2.1.3 The scale conflict/role ambiguity
The scale conflict / role ambiguity is devised by Peterson and his colleagues (1995), including 8 sections. And using five-point Likert scale (that is : strongly disagree, disagree, neutral, agree, strongly agree ) to point answers and questions no.4,5,6,7,8 are pointed in the opposite way . The entry form is as follows:
1. I often fall into the situation where there are conflicting requirements.
2. I receive conflicting requests from two or more people.
3. I have to do what needs to be done differently in different conditions.
4. I have goals and a clear object for my work.
5. I know what I was expecting.
6. I know what my responsibilities are.
7. I feel sure about my level of competence.
8. My responsibility is clearly defined.
This is the scale used in this research. Sections 4, 5, 6, 7 and 8 will be reversed when the value scale assessing role ambiguity.
2.2 JUSTICE IN THE ORGANIZATION
2.2.1 Definition
Justice can also be understood in two different senses: objective and subjective. According to the subjective perstect, justice depends on the feeling and evaluation, judgment of each individual. Each person will have their own assessment how fair or unfair. In objective sense, justice is understood as the right values, rules, common standards or how to act accordingly, recognized by the community. For example: The good thing always wins the evel thing. Or the more people work, the more they can enjoy the results. Who make less will receive less, who has been rewarded, the guilty must be punished; who has the bigger result the bigger the reward they receive. The more severe the sin, the penalty will be more severe. It is the justice.
Justice does not mean leveling from above, equate, and require everyone to be the same. Continuing to look at the facts, in the market economy is opening; the rich-poor gap is not entirely a manifestation of inequity.
2.2.2 Characteristics of justice/fairness
According to the theory of economics, scholars distinguish two different concepts of social justice are: horizontal equity, means equal treatment for those who have contributed equally and fairly under vertical means that treat differently with people who have instinct gaps, education, ability or different living conditions.
For example, in the policy development of personal income tax: Those who have equal incomes should pay a similar personal income tax (horizontal justice), and those who have different income need to have different tax amount (vertical justice). For example, employees have the similar education, experience years have to be paid similarly. We cannot require a long experienced officer who contributed in many years to be paid equally with a free graduate.
Justice is also shown vertically in the State to facilitate and expand access for the poor, the vulnerable groups to services, health care, education, jobs , resources, social benefits. Such policies that add more scores for the current university entrance exam based on living area, support for the disabled, elderly and helpless is also a manifestation of justice if the justice vertically is understand. These policies work to ensure the fair and equitable living conditions for growth opportunities in the society.
Equality is a composition factor of justive. There is no law degines that everyone is equal, because it is imposible. However, almost regulation in every nations considers “everyone is equal in front of regislation.” Equal in front of regislation is a basic condition to get to the justice.
American Declaration of Independence in 1776, the Universal Declaration of Human Rights and Civil Rights in France in 1789 were a high value on equality, justice, the purpose is against discrimination based on differences in origin background, race, color, gender, sexual orientation, language, religion, political worldviews, backgrounds, assets or other conditions. The principle of equality in the front of legistration is violated when authorities act arbitrarily, unfairly treats over to a group of people from a different group of people, not based on any legal basis, although between two of groups does not have any difference in terms of legal status. These laws violate the principle of equality should be declared invalid. The administrative decision or judgment of the Court violates the principle of equality should be canceled.
In nowadays modern society, to ensure justice, the legislature plays a very important role. Legislators have a duty to optimize the benefits of all sectors of society. For this, there must be accountability mechanism, test, monitor and ensure information transparency. People should have the right to know and comment on the formation, as well as monitoring the implementation of the law. Operations executive and the judiciary should also be based on the law and ensure impartial, and consistent with the nature and extent of each particular legal relationship.
These days, the justice is not only the general trend in the contemporary world, but also the conditions for economic growth, is the criteria, measure the level of development of a sustainable society. Although there are many ways the concept and theory of justice, however, this theory is not enough to create a unified understanding of justice, because every culture, in different space and time, there
is the appearance of understanding, evaluating in different ways towards justice. Nowadays in front of the trend of globalization, integration, justice gradually be recognized in a wider scope, not only to understand the fairness of national scope, but rather, it often is out of range internationally.
2.2.3 Factors affecting the perception of organizational justice
One of the important structures have been proven influential factor in shaping public perceptions of the organization, which is a form of emotional factors to be checked (emotion, mood, layout) as well as the context and type of justice is measured. Influence can serve as a premise, results, or even a mediator of awareness within the organization.
A recent analysis by Barsky and Kaplan (2007) condenses many studies on this topic and explained that the state and characteristics can affect the perceived justice of a person. The findings of Barsky and Kaplan showed that the negative affect both state and trait can work as a prerequisite of a justice perception. And state level characteristics affect negatively related to negative interactions, perceptions of fairness and distribution procedures. In contrast, the state and the positive emotional factors relate to higher ratings of justice, interactive justice and distribution procedures.
2.2.4 Scales of justice
Criteria of justice in organizations includes 17 items (Moorman, 1991; NIEHOFF & Moorman, 1993), and used five-point Likert scale (including strongly disagree, disagree, neutral, agree, agree) to the point answers. The example sections are:
1. My working schedule is fair
2. I think my salary is reasonable
3. I think that my workload relative fair
4. Overall, the rewards I receive here are quite fair
5. I feel that my job responsibilities are properly
6. My leader does no bias when making decisions at work
7. My supervisor ensures that the concerns of employees are considered
before making a decision on the job.
8. When the official decision-making, my supervisor gathers sufficient
information correctly
9. My supervisor decides to clarify and provide additional information as
requested by staff
10. All the work is applied uniformly over the entire relevant staff
11. Staff are allowed to challenge or appeal the decision by a supervisor or
manager out
12. My supervisor considers my opinion
13. My supervisor can prevent personal bias
14. My superviser provides me timely feedback about the decision and its
impact
15. Level 15 in a caring and concerned about me
16. My rights are paid attention by my supervisor as an employee
17. My supervisor treats me with honest attitude
This is the scale used in this research.
2.3 JOB SATISFACTION
2.3.1 Job satisfaction in works
Encyclopedia dictionary wikipedia.com defines job satisfaction is the personal satisfaction of his/her job. Meanwhile, in Oxford Advance Learner's Dictionary, the definition of 'satisfaction' is to meet a need or desire to do it and so can understand the job satisfaction that the employee needs or their desire to work.
One of the first definition of job satisfaction is defined by Robert Hoppock (1935, cited by Scott et al, 1960). The author argues that the measurement of job satisfaction in two ways: (a) measuring job satisfaction in general and (b) to measure job satisfaction in various aspects related to job. The author emphasizes that the general job satisfaction is not merely the total satisfaction of the different aspects, but the general job satisfaction can be considered as a separate variable.
According to Spector (1997) job satisfaction is simply how people feel like their work and other aspects of their work looks like. Because it is the general evaluation, it is an attitudinal variable. As Ellickson and Logsdon (2001) said that job satisfaction is generally defined as the level of staff favorites with their works. It is based on the attitude of the staff perceptions (negative or positive) about their work or their work environment. More simply, the more the work environment to
meet the needs, values and personality of the employees, the level of job satisfaction higher.
2.3.2 Theory of Maslow's hierarchy of needs
According to Maslow, people work to satisfy their own needs. Those have been divided into 5 categories and are arranged hierarchically from low to high to the following: physiological needs, safety needs, social needs, esteem and self-expression. According to Maslow, the order to satisfy the demand goes from low to high, while the lower-level needs are met, the higher needs will appear. Therefore, to effectively encourage for achieving the highest level of employees’ satisfaction, managers need to know which demand their employees are in to be supplied in order to make the necessary solution to satisfy their needs, thereby ensuring that the objectives of the organization are made.
Figure 1Maslow's hierarchy of needs
Self-expression Self-esteem demand Social demand Safety demand Physiological demand 18
2.3.3 ERG Theory
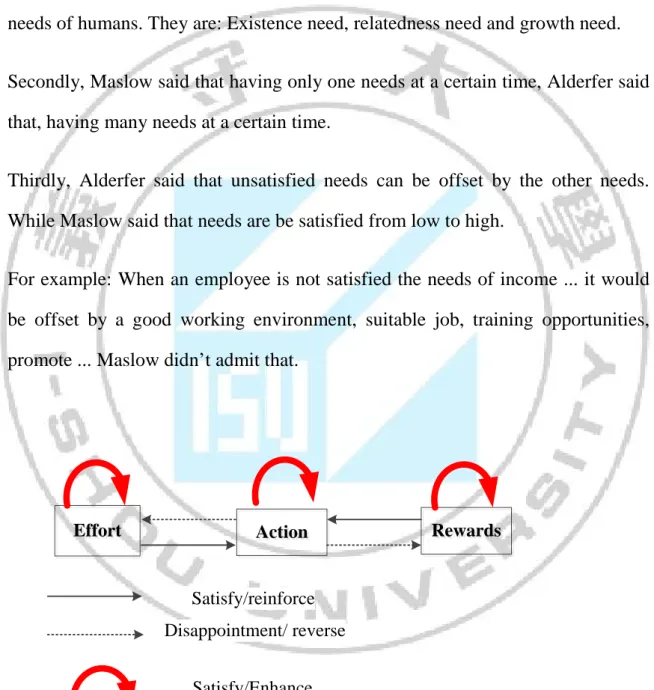
Generally, this theory is like Maslow's hierarchy of needs theory. However, there are some differences as follows:
Firstly, according to Maslow, have 5 needs of humans, but for this theory has 3 needs of humans. They are: Existence need, relatedness need and growth need.
Secondly, Maslow said that having only one needs at a certain time, Alderfer said that, having many needs at a certain time.
Thirdly, Alderfer said that unsatisfied needs can be offset by the other needs. While Maslow said that needs are be satisfied from low to high.
For example: When an employee is not satisfied the needs of income ... it would be offset by a good working environment, suitable job, training opportunities, promote ... Maslow didn’t admit that.
Rewards
Rewards
Effort
Effort ActionAction
Satisfy/reinforce Disappointment/ reverse
Satisfy/Enhance
Figure 2Clayton Alderfer‘s ERG theory
2.3.4 Adams fairness theory
This theory said that people assess equity by comparing what they contribute to the work (such as qualifications, experience, effort, skills) and what they get (such as wages, recognition, reward, promotion) with the others in the same group or the average level of the group.
If the results are comparable with each other, they believe they have been treated fairly. So, they will be assured the job, continuing efforts to maintain and strive.
If the results are not comparable with each other, they believe they have not been treated fairly. Therefore, they will have a feeling of insecurity and stress at work. So they will take action: reducing their contributions to the work, reduced striving effort, reduced hours of working, resign.
2.3.5 Achievement motivation theory of Clelland (1988)
Theory of Clelland (1988, quoted by Robbins, 2002) concentrated on 3 human needs: need for achievement, need for power and need for affiliation. Need for achievement are efforts to achieve excellence, to win results in pursuance with some standards, as well as strong determination to reach success. The need for power is the request for other people to behave in the ways that you are looking for. The need for affiliation is the wish to establish friendly and close relations with others. The need for achievement proposed by Clelland is reflected in this study in the fields of the job characteristics, working environment. The job should be designed in a way that enables workers to “achieve” what they are looking for. The need for power is reflected in promotion opportunities and win some
positions in the company and organization. Finally, the affiliation need is reflected in the relations with senior bosses and colleagues.
2.3.6 Measurement of job satisfaction
The survey about the index of job satisfaction (Brief Index of Affective Job satisfaction) by Thompson and Phua (2012s proposed to measure the self-satisfied in their jobs. It uses 5 points Likert scale ("1. Strongly disagree", "2. Disagree", "3. Accept", "4.Agree", "5. Strongly agree") and 04 questions, as follows: "I found real joy in work", "I like my job better than others", "I am always enthusiastic about the job," "I feel quite satisfied with my work."
This is the scale that we use to evaluate job satisfaction of employees.
2.3.7 Influential factor affect to job satisfaction
Factors that affect job satisfaction include:
The nature of work: Includes factors, the nature of the work that these factors affect working results of workers.
Salaries: the satisfaction of wages related to employees' sense of fairness in payment. Salary satisfaction is measured based on the following indicators:
- The high-paid workers.
- Workers can live solely on the income from the company.
- Salary commensurate with employment outcomes.
- Wages and income are paid fairly.
Colleagues: the perception-related behaviors, relationships with work colleagues at work, coordination and support each other in their work with colleagues. Colleague’s factors include:
- Comfortable and pleasant co-workers.
- The cooperation between employers and work colleagues.
- The friendliness of colleagues.
- The mutual assistance among colleagues.
Leadership: perception-related behaviors, relationships with leaders in the workplace, the encouragement and support of leaders to be able to know the scope of their responsibilities and complete the good work. The elements of leadership include:
- Superiors ask staff when problems related to the work.
- The support of higher-level employees.
- Leadership styles are polite, gracious.
- Employees are treated fairly, without discrimination.
Training opportunities and promotion: training opportunities and promotion are those related to employee perceptions of training opportunities, develop personal capacity and opportunities for promotion within the organization. Employees are willing to know the information about the conditions and opportunities, promotion policies of the company, the opportunity to train and develop the skills necessary for their career direction.
Work environment: involving employees' perceived safety work: working office, working desks, meeting rooms, medical rooms to ensure hygiene; machinery, equipment and support for job security; the elements of light, temperature, noise...
CHAPTER 3 RESEARCH METHODOLOGY
3.1 RESEARCH MODEL AND THEORIES
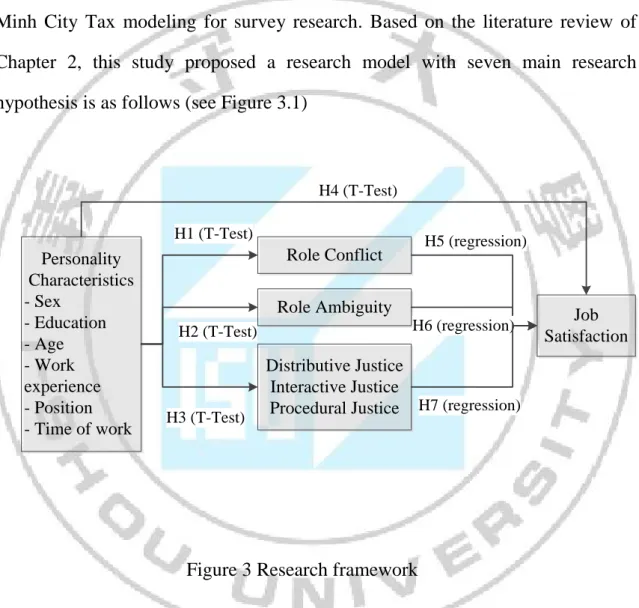
This study attempted to examine the relationship of role conflict, role ambiguity, organizational fairness and job satisfaction, and public agencies taking Ho Chi Minh City Tax modeling for survey research. Based on the literature review of Chapter 2, this study proposed a research model with seven main research hypothesis is as follows (see Figure 3.1)
Role Conflict Job Satisfaction H5 (regression) Role Ambiguity Distributive Justice Interactive Justice Procedural Justice H6 (regression) H7 (regression) Personality Characteristics - Sex - Education - Age - Work experience - Position - Time of work H1 (T-Test) H2 (T-Test) H3 (T-Test) H4 (T-Test)
Figure 3 Research framework
Hypothesis H1: Personal characteristics will make a significant difference in the role conflict
H1a: Gender will make a significant difference in the role conflict
H1b. Ages will make a significant difference in the role conflict
H1c. Education will make a significant difference in the role conflict
H1d. Work experience will make a significant difference in the role conflict
H1e. Position will make a significant difference in the role conflict
H1f. Department you are working will make a significant difference in the role conflict
H1g. Area will make a significant difference in the role conflict
H1h. Field you are working will make a significant difference in the role conflict
H1i. Time of work will make a significant difference in the role conflict
Hypothesis H2: Personal characteristics will make a significant difference in the role ambiguity.
H2a: Gender will make a significant difference in the role ambiguity
H2b. Ages will make a significant difference in the role ambiguity
H2c. Education will make a significant difference in the role ambiguity
H2d. Work experience will make a significant difference in the role ambiguity
H2e. Position will make a significant difference in the role ambiguity
H2f. Department you are working will make a significant difference in the role ambiguity
H2g. Area will make a significant difference in the role ambiguity
H2h. Field you are working will make a significant difference in the role ambiguity
H2i. Time of work will make a significant difference in the role ambiguity
Hypothesis H3: Personal characteristics will make a significant difference to the organizational justice
H3a: Gender will make a significant difference to the fairness of the organization
H3b. Ages will make a significant difference to the fairness of the organization
H3c. Education will make a significant difference to the fairness of the organization
H3d. Work experience will make a significant difference to the fairness of the organization
H3e. Position will make a significant difference to the fairness of the organization
H3f. Department you are working will make a significant difference to the fairness of the organization
H3g. Area will make a significant difference to the fairness of the organization
H3h. Field you are working will make a significant difference to the fairness of the organization
H3i. Time of work will make a significant difference to the fairness of the organization
H3.1. Personal characteristics will make a significant difference in the distributive justice
H3.1a: Gender will make a significant difference in the fair division
H3.1b. Ages will make a significant difference in the fair division
H3.1c. Education will make a significant difference in the fair division
H3.1d. Work experience will make a significant difference in the fair division
H3.1e. Position will make a significant difference in the fair division
H3.1f. Department you are working will make a significant difference in the fair division
H3.1g. Area will make a significant difference in the fair division
H3.1h. Field you are working will make a significant difference in the fair division
H3.1i. Time of work will make a significant difference in the fair division
H3.2.Personal characteristics will make a significant difference in procedural fairness
H3.2a: Gender will make a significant difference in procedural fairness
H3.2b. Ages will make a significant difference in procedural fairness
H3.2c. Education will make a significant difference in procedural fairness
H3.2d. Work experience will make a significant difference in procedural fairness
H3.2e. Position will make a significant difference in procedural fairness
H3.2f. Department you are working will make a significant difference in procedural fairness
H3.2g. Area will make a significant difference in procedural fairness
H3.2h. Field you are working will make a significant difference in procedural fairness
H3.2i. Time of work will make a significant difference in procedural fairness
H3.3. Personal characteristics will make a significant difference in the interaction of justice
H3.3a: Gender will make a significant difference in the interaction of justice
H3.3b. Ages will make a significant difference in the interaction of justice
H3.3c. Education will make a significant difference in the interaction of justice
H3.3d. Work experience will make a significant difference in the interaction of justice
H3.3e. Position will make a significant difference in the interaction of justice
H3.3f. Department you are working will make a significant difference in the interaction of justice
H3.3g. Area will make a significant difference in the interaction of justice
H3.3h. Field you are working will make a significant difference in the interaction of justice
H3.3i. Time of work will make a significant difference in the interaction of justice
Hypothesis H4: Personal characteristics will make a significant difference in job satisfaction
H4a. Gender will make a significant difference in job satisfaction.
H4b. Ages will make a significant difference in job satisfaction.
H4c. Education will make a significant difference in job satisfaction.
H4d. Work experience will make a significant difference in job satisfaction.
H4e. Position will make a significant difference in job satisfaction.
H4f. Department you are working will make a significant difference in job satisfaction.
H4g. Area will make a significant difference in job satisfaction.
H4h. Field you are working will make a significant difference in job satisfaction.
H4i. Time of work will make a significant difference in job satisfaction.
Hypothesis H5: Role Conflict has a significant negative impact on the job satisfaction.
Hypothesis H6: Role Ambiguity has a significant negative impact on the job satisfaction.
Hypothesis H7: Organzational Justice has a significant positive impact on the job satisfaction.
3.2 RESEARCH SAMPLE
This study sampled from the people who work with location management and agency management in the Tax Department of Ho Chi Minh City, Vietnam. 300 people were sampled with a survey by questionnaires which are translated from English into Vietnamese by the researcher. Survey questions are directly conducted by the researcher and distributed to each person. The total of 300 valid questionnaires were collected, the rate of 100%.
3.3 RESEARCH TOOLS
Based on the framework of this study, as shown in Figure 3.1, four variables were measured as personal characteristics, role conflict and role ambiguity, organizational fairness and job satisfaction. The scale used to measure the four variables are described as follows.
3.3.1 Assessment scale of conflict and role ambiguity
The scale conflict / role ambiguity by Peterson and colleagues (1995) devised, consisting of 8 items, and use the Likert five-point scale (that is: strongly disagree, disagree, neutral, and agree, strongly agree) to score the answers and the questions are scored 4,5,6,7,8 oppositely.
3.3.2 Assessment scales of justice in organizations.
Scales of justice in organizations with 17 items (Moorman, 1991; NIEHOFF & Moorman, 1993), and used Likert five-point scale (ie: strongly disagree, disagree, neutral, agree, and strongly agree) was used for evaluation.
3.3.3 Assessment scales of job satisfaction
The survey index of job satisfaction (Brief Index of Affective Job satisfaction) by Thompson and Phua (2012) proposes to measure the self-satisfied in their work, using 5-point scale in order to collect data.
3.3.4 Assessment scales of personal characteristics
Gender, age, highest educational level, number of years on the current job, working experience, department / public works departments, industry, location, industry, time employment (full-time / part-time) is the demographic factor is to gather information about the characteristics of each individual.
3.4 DATA ANALYSIS
The data will be collected after cleaning and processing by SPSS 17.0 software. Some analytical methods used in the study are as follows:
3.4.1 Descriptive Statistics
Descriptive statistics such as frequencies and percentages were used to collect a group of personal characteristics. And the average deviation is used to calculate different variables.
3.4.2 Reliability analysis
Cronbach's Alpha model is among of critical correlation method (also known as internal reliability assessment). General thoughts of this method are to find the absurdity of the answers if any have, for example if someone has a answer that "X is a good policy and score the highest point to X: but in questions B were asked
about the benefits of X, admit that "X useless" data, so the correlation is inconsistent with logic. That leads to the discrepancies when data mining.
Reliability analysis is used for both self-assessment and job satisfaction scales to examine the items used to assess these variables are reliable. Reliability denotes difference quantity in case assessment, and the coefficient of reliability (Cronbach's alpha) can be calculated ranged from 0.0 (not reliability and high fluctuation) to 1.0 (completely reliable and consistent).
3.4.3 T-test analysis
.To assess the differences between the two groups, we often use the t-test method (or t-test). T-test is probably one of the simplest methods of statistical, as can be calculated manually, without computer or data analysis software.
Although simple, but t-test method is also very easy to make mistake. The most common mistake is to ignore the assumptions behind this method. T-test method is only appropriate if the data meets the conditions or following assumptions:
+ Two compared groups are completely independent;
+ Comparing variables must follow normal distribution (Gaussian distribution);
+ The variances of the two groups are equal, or nearly equal;
+ The object must be selected at random (random sample).
In this research, t-test analyzes were calculated to test whether the differences in attitudes and behavior between the two groups have different. Three different
levels of p <.05, p <.01, and P <.001 was given for value t. To test the hypothesis H1, H2, H3 and H4 of this research, t-test analysis was used to find results.
3.4.4 Regression Analysis
Hypothesis H5, H6 and H7 of this study were test correlation regression analysis to test the relationship between the study variables. Pearson correlation coefficient (symbol p) was calculated to quantify the degree of linear relationship between two quantitative variables. If p-value is less than 0.05, it can be concluded that there is a relationship between the independent variable and the dependent variable
CHAPTER 4 RESEARCH RESULT
4.1 DEMOGRAPHIC ELEMENTS
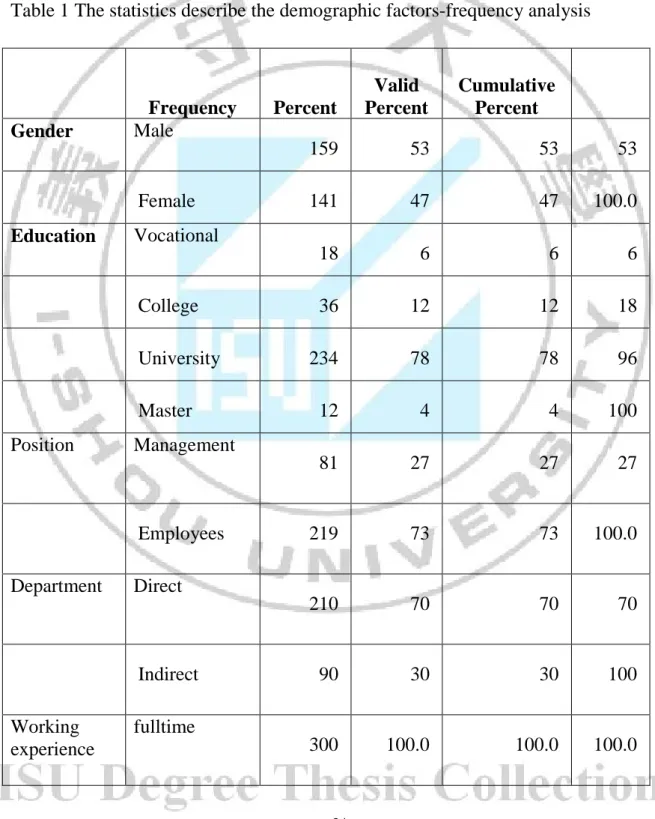
There were 300 persons choosen to take sample. Their demographic details are described in Table 1
Table 1 The statistics describe the demographic factors-frequency analysis
Frequency Percent Valid Percent Cumulative Percent Gender Male 159 53 53 53 Female 141 47 47 100.0 Education Vocational 18 6 6 6 College 36 12 12 18 University 234 78 78 96 Master 12 4 4 100 Position Management 81 27 27 27 Employees 219 73 73 100.0 Department Direct 210 70 70 70 Indirect 90 30 30 100 Working experience fulltime 300 100.0 100.0 100.0 34
In addition, descriptive statistics resulting average value was also used to examine the average age and experience/working years for 300 valid research objects. The results were shown in Table 2. As Table 2 shows, the average age is 35, average experience/number of working years is 14.
Table 2 The statistics describe the demographic factors-mean analysis
N Minimum Maximum Mean
Standard deviation Age 300 21 59 35.15 8.852 Experience/working 300 0 38 13.95 8.769 N 300
According to Table 1, the four demographic factors such as department, location, industry, and working time cannot be analyzed for each element which only a single group. Thus, six demographic characteristics (gender, age, education, experience/work year, position, and working department) were selected to test Hypothesis 1, 2, 3, 4, 5, 6 and Hypothesis 7 in this study.
4.2 REDEFINE DEMOGRAPHIC FACTOR’S GROUPS
Because of statistical purposes, this study should be conducted to determine the groups to ensure that every demographic characteristics group must contain more than 30 observations
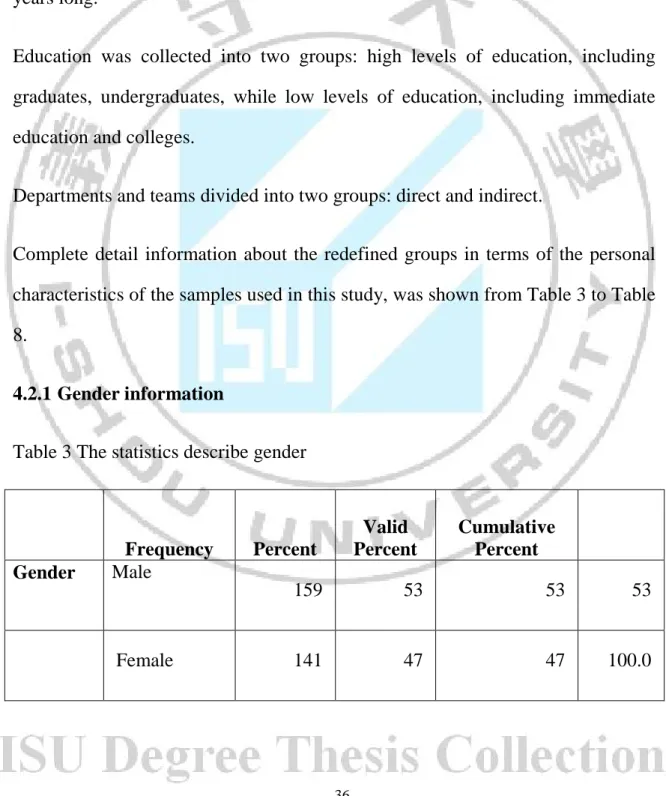
Two demographic characteristics, age and experience/years of service, were collected into two groups according to the average values shown in Table 2. For example, subjects aged 35 years and younger are collected into a group of children, while subjects over the age of 35 was collected on age group; experienced subjects/number of working years of 14 or less are collected into groups of five short works, while more than 14 are collected into groups working years long.
Education was collected into two groups: high levels of education, including graduates, undergraduates, while low levels of education, including immediate education and colleges.
Departments and teams divided into two groups: direct and indirect.
Complete detail information about the redefined groups in terms of the personal characteristics of the samples used in this study, was shown from Table 3 to Table 8.
4.2.1 Gender information
Table 3 The statistics describe gender
Frequency Percent Valid Percent Cumulative Percent Gender Male 159 53 53 53 Female 141 47 47 100.0 36
Total 300 100.0 100.0
In gender group, males account for 53% (159 employees) and females accounted for 47% (141 employees).
Figure 4 Gender
4.2.2 Age
Table 4 Age Statistics
Frequency Percent Valid Percent Cumulative Percent Age Children 177 59 59 59 Ageing 123 41 41 100.0 Total 300 100.0 100.0 37
The age of the study samples was divided into two groups, Children (from 35 years and younger) accounted for 59% (177 employees) and the Ageing group (greater than 35 years) accounted for 41% (123 employees).
Figure 5 Age
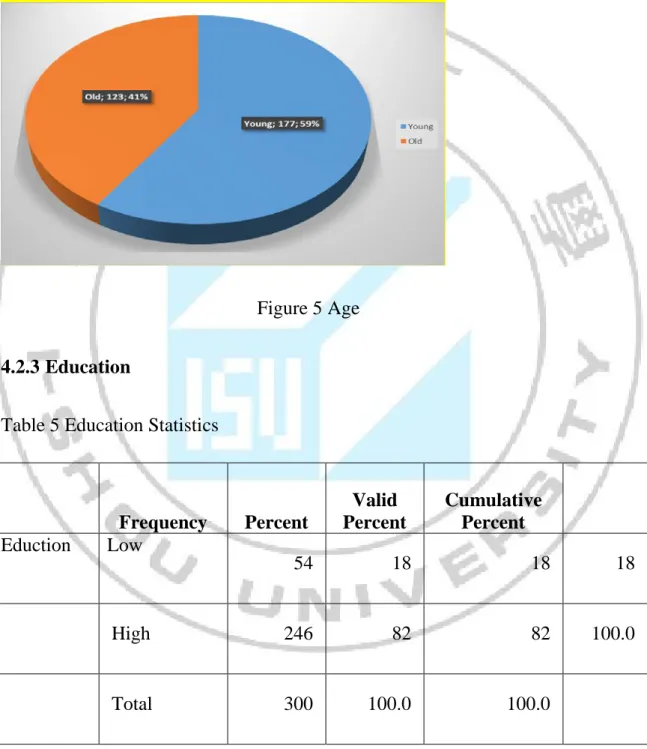
4.2.3 Education
Table 5 Education Statistics
Frequency Percent Valid Percent Cumulative Percent Eduction Low 54 18 18 18 High 246 82 82 100.0 Total 300 100.0 100.0 38
Education was also divided into two groups: group had lower levels (immediate education and colleges) accounted for 18% (54 employees) and those with high levels (undergraduates and graduates) accounted for 82% (246 employees).
Figure 6 Education
4.2.4 Experience
Table 6 Experience Statistics
Frequency Percent Valid Percent Cumulative Percent Experience Short-time 180 60 60 60 Long-time 120 40 40 100.0 Total 300 100.0 100.0 39
The group having short-time in working (14 years or smaller) accounted for 60%, 180 employees, and the other group with long-time in working (over 14 years) accounted for 40%, 120 employees.
Figure 7 Experience
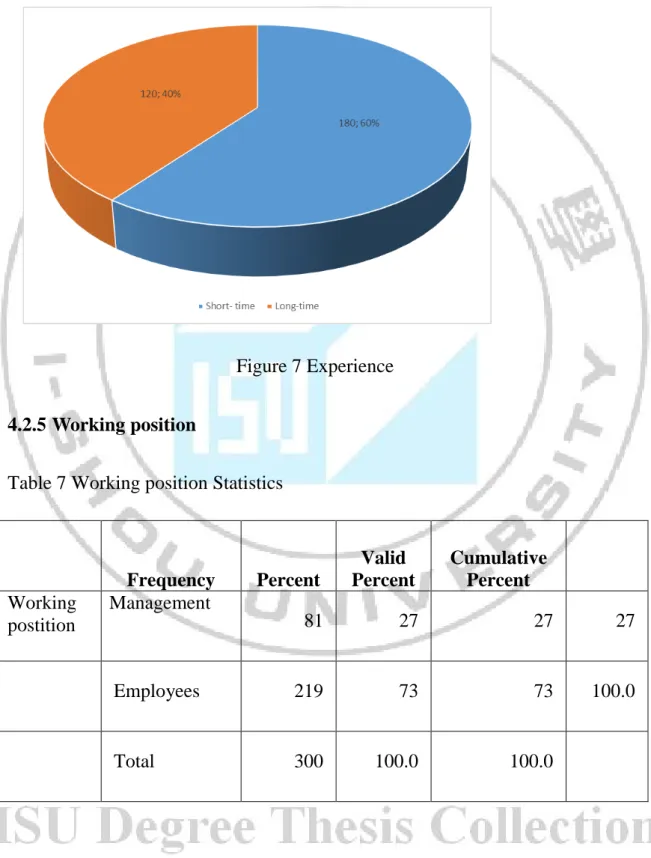
4.2.5 Working position
Table 7 Working position Statistics
Frequency Percent Valid Percent Cumulative Percent Working postition Management 81 27 27 27 Employees 219 73 73 100.0 Total 300 100.0 100.0 40
The management group accounted 27% proportion with 81 employees and non-management group accounted 73% proportion with 219 employees.
Figure 8 Working position
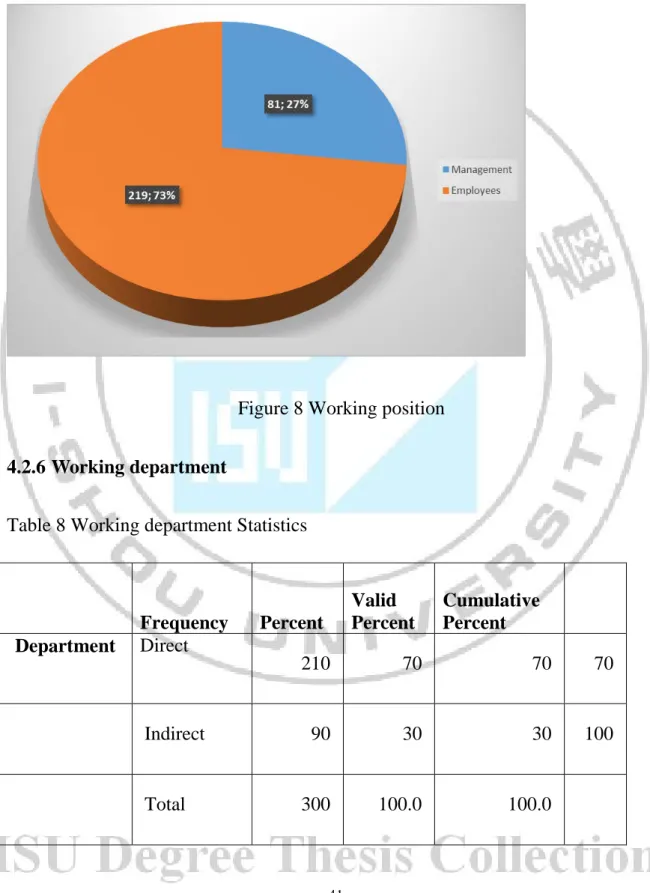
4.2.6 Working department
Table 8 Working department Statistics
Frequency Percent Valid Percent Cumulative Percent Department Direct 210 70 70 70 Indirect 90 30 30 100 Total 300 100.0 100.0 41
The group with employees working in direct department occupied 70%, 210 employees, and the group with employees working in indirect departments occupied 30%, 90 employees.
Figure 9 Working department
4.3 RELIABILITY ANALYZING ROLE CONFLICT, ROLE AMBIGUITY, ORGANIZATION JUSTICE -DISTRIBUTIVE/INTERACTIVE AND JOB SATISFACTION
Reliability analyzing which was performed to test seven scales: role conflict, role ambiguity, organization justice, and job satisfaction. Results are showed in Table 9 to Table 16.
This research calculates role conflict with average values of three sections. Role ambiguity with five sections, organization justice- distributive with 5 sections /procesdural with 6 sections/interactive with 6 sections, general organization justice is with average scope of 17 sections and job satisfaction with 4 sections.
Table 9 Reliable statistics for role conflict (C1 -> C3)
Cronbach's Alpha
Cronbach's Alpha Based
on Standardized Items N of Items
.552 .553 3
As Table 9 shows, Cronbach’s alpha (= 0,552) makes role conflict’s have low reliability. It will increase from 0,552 to 0,619 if section C3 is deleted. As table 4.9.1, despite low reliability, it can be accepted; therefore, this research will calculate Role conflict with average value of 2 sections: C1 and C2, like in table 11.
Table 10 Reliable statistics for role conflict (C1 -> C3)
Scale Mean if Item Deleted Scale Variance if Item Deleted Corrected Item-Total Correlation Squared Multiple Correlation Cronbach's Alpha if Item Deleted C1 6.6750 2.214 .432 .231 .375 C2 6.5250 2.103 .427 .227 .382 C3 6.3920 2.414 .271 .087 .619 43
Table 11 Reliable statistics for role conflict (C1 -> C2) Cronbach's Alpha Cronbach's Alpha Based on Standardized Items N of Items .619 .619 2
As table 11, Reliability coefficient (Cronbach’s Alpha = 0.907) of role ambiguity, (= 0,745) distributive justice section, (= 0,808) procedural justice section, (= 0,819), (= 0.892) justice oganization section and (= 0,696) job satisfaction, all are from near 0.7 to 0.9, show that they are appreciated and reliable, which can be used to test theories.
Table 12 Reliability statistics of role ambiguity, distribution justice, procedural justice, interactive justice, organization justice and job satisfaction.
Cronbach's Alpha Cronbach's Alpha Based on Standardized Items N of Items Role ambiguity .907 .906 5 (C4C8) 44
Distributive justice .745 .744 5 (D1D5) Procedural justice .808 .807 6 (D6D11) Interactive justice .819 .819 6 (D12D17) Organization justice .892 .892 17 (D1D17) Job satifaction .696 .696 4 (G4G4) 4.4 ANALYSING DIFFERENCES
To test hypothesis 1, 2, 3 and 4, this study applies t-tests to examine differences between groups. Six demographic characteristics, including gender, age, qualifications, experience years of job position and department, they are used for grouping and testing T-test. T-test results show from table 13 to table 18
Table 13 Group of t-test statistics by gender gender N Mean Std. Deviation Std. Error Mean t value
Role conflict male 159 3.2453 .77992 .05704 .127
female 141 3.2354 .79114 .05432 Role ambiguity male 159 3.4581 .77995 .05704 -.125 female 141 3.4701 .79112 .05421 Distributive justice male 159 3.5576 .66041 .04830 -.314 female 141 3.5681 .65540 .04485 Procedural justice male 159 3.6034 .63681 .04657 1.159 female 141 3.5290 .64250 .04402 Interactive justice male 159 3.6693 .58365 .04269 1.394 46
female 141 3.5822 .65789 .04505 Organizational justice male 159 3.6168 .51884 .03794 .857 female 141 3.5697 .57442 .03936 Job satisfaction male 159 4.0611 .59597 .04352 1.230 female 141 3.9783 .65866 .04513 * p <.05, ** p<.01, *** p<.001.
Table 13 shows that gender isn’t different in role ambiguity, role conflict, organization justice- distributive/procedural/interactive and job satisfaction. Furthermore, all evaluations is above average between male and female (Role conflict (Male = 3.25, female = 3.24), role ambiguity (male = 3.46, female = 3.47), distributive justice (male = 3.56, female = 3.57), procedural justice (male = 3.60, female = 3.53), especially job satisfaction is positive evaluation: (Male = 4:06, female = 3.98). H1a, H2a, H3a and H4a are accepted.
Table 14 Group of t-test statistics by age Age N Mean Std. Deviation Std. Error Mean t value
Role conflict young 177 3.3177 .70977 .04255 3.387**
old 123 3.0325 .90487 .08158
Role ambiguity young 177
3.2881
.81528 .04899
-5.287***
old 123 3.8293 1.18507 .10688
Distributive justice young 177 3.5755 .66331 .03985 .776
old 123 3.5203 .64363 .05803
Procedural justice young 177 3.6155 .61366 .03686 2.452*
old 123 3.4472 .68430 .06170
Interactive justice young 177 3.6594 .59836 .03595 1.764
old 123 3.5407 .67661 .06101
Organizationaljustice young 177 3.6168 .54304 .03253 1.921
old 123 3.5027 .55628 .05015
Job satisfaction young 177 4.0099 .61983 .03724 .117
old 123 4.0020 .65726 .05925
* p <.05, ** p<.01, *** p<.001.
Table 14 shows that the age of employees is related to research criteria but just low level. All evaluation is above averge (M >=3). Four of them have no evaluation differences between age groups: job satisfaction is highly appreciated (Young = 4.01, old = 4.00), distribution justice (young = 3.57, old = 3.52), interation justice (young = 3.65, old = 3.54), especially procedure justice has a little difference in the evaluation between groups of young workers and older workers (young = 3.62, old = 3.45, t = 2.452, p < 0.05), the young group agree more on procedure justice than the older group. About the invidual role in organization, there are different between the the young and the older: Role conflict (young = 3.32, old = 3.03, t = 3.387, p < 0.01), role ambiguity (young = 3.29, old = 3.83, t = -5.287, p < 0.001). The hypotheses: H4b, H3b, H3.1b và H3.3b are denied, the hypotheses: H1B, H2b and H3.2b are accepted.
Table 15 Group statistics by Education Education N Mean Std. Deviation Std. Error Mean t value
Role conflict Low 54 3.3736 .69417 .04929 3.422***
High 3.0940 .84687 .05952 Role ambiguity Low 54 2.0928 .59778 .04244 -8.137*** High 246 2.8288 1.12801 .07932 Distributive justice Low 54 3.6746 .60421 .04289 3.241*** High 246 3.4645 .69181 .04868 Procedural justice Low 54 3.5826 .57315 .04075 .890 High 246 3.5355 .70002 .04935 Interactive justice Low 54 3.7289 .58422 .04252 3.071** 50
High 246 3.5389 .65040 .04676 Organizational justice Low 54 3.6687 .50812 .03621 2.810** High 246 3.5163 .57749 .04164 Job satisfaction Low 54 4.0990 .59866 .04234 2.872** High 246 3.9185 .64992 .04580 * p <.05, ** p<.01, *** p<.001.
Table 15 shows that H1c, H2c, H3c and H4c are accepted, there is different between the high education and the less education groups (Mean difference > = 0.15, p <.01 or less). However, particularly review the procedure justice, the education level isn’t different from the evaluations (low = 3.58, high = 3.54, p >.05), only the hypothesis is denied.
Table 16 Group statistics by Experience/Number of working years Working Experience N Mean Std. Deviation Std. Error Mean t value
Role conflict Short 180 3.3373 .72449 .04312 4.350***
Long 120 2.9890 .86554 .07925
Role ambiguity Short 180 2.2961 .85160 .05079
-5.158***
Long 120 2.8286 1.13882 .10440
Distributive justice Short 180 3.5301 .66238 .03851 1.006
Long 120 3.5096 .64403 .05904
Procedural justice Short 180 3.6335 .62340 .03713 3.392***
Long 120 3.3992 .65491 .05974
Interactive justice Short 180 3.6916 .59426 .03545 3.411***
Long 120 3.4608 .66727 .06137
Organizationaljustice Short 180 3.6350 .53659 .03195 3.015**
Long 120 3.4558 .56274 .05149
Job satisfaction Short 180 4.0001 .60937 .03735 -.402
Long 120 4.1273 .68110 .06243
* p <.05, ** p<.01, *** p<.001.
Table 16 shows that H1d, H2d and H3d ( in that H3.12, H3.3d) are accepted, there is different between the short term and long term working years groups (Mean difference> = 0.2, p <.01 or less). However, particularly review the procedure justice, the 4.4.4 Experience/Number of working years level isn’t different from the evaluations (short = 3.53, long = 3.51, p >.05), therefore hypothesis H3.2d and H4d is denied.
Table 17 Group statistics by Working Position
Title N Mean Std. Deviation Std. Error Mean t value
Role conflict Managerial 81 3.0617 .91259 .08716 -2.623*
Non – managerial 219 3.2912 .71928 .04251 Role ambiguity Managerial 81 2.6459 1.11235 .10772 2.382* 53
Non – managerial 219 2.3850 .92145 .05315 Distributive justice Managerial 81 3.4430 .71096 .06786 -2.234* Non – managerial 219 3.6117 .63523 .03717 Procedural justice Managerial 81 3.3811 .70925 .06857 -3.527*** Non – managerial 219 3.6308 .60041 .03518 Interactive justice Managerial 81 3.5489 .69183 .06678 -1.627 Non – managerial 219 3.5636 .59753 .03481 Organizational justice Managerial 81 3.4570 .60181 .05819 -2.817** Non – managerial 219 3.6284 .52173 .03047 Job Managerial 81 3.9886 .68664 .06638 -.984 54
satisfaction
Non -
managerial
219 4.0295 .60927 .03569
* p <.05, ** p<.01, *** p<.001.
Table 17 shows that the hypotheses H1e, H2e, H3e (including H3.1e, H3.2e) are accepted, (Mean difference> = 0.15, p <.01 or less). However, particularly review the interaction justice, there isn’t diffirent from the managerial team and non managerial team in the evaluations. (Managerial =3.55, Non-managerial =3.56, p>.05). On the other hand, in job statisfaction, both groups are fairly appropriated as the same (managerial = 3.99, non- managerial = 4.03, p>.05). Therefore, the hypotheses H3.3e 2 and H4e are denied.
Table 18 Group statistics by Working department
Department N Mean Std. Deviation Std. Error Mean t value
Role conflict Direct 210 3.2006 .86112 .06941 -2.637*
Indirect 90 3.4110 .72400 .04617
Role ambiguity
Direct 210 3.0601 1.13472 .09144 8.514***
Indirect 90 3.8502 .71231 .04561 Distributive justice Direct 210 3.5187 .64737 .05216 -1.450 Indirect 90 3.5859 .66169 .04318 Procedural justice Direct 210 3.5446 .69469 .05597 -.724 Indirect 90 3.5820 .60446 .03873 Interactive justice Direct 210 3.6104 .63177 .05091 -.317 Indirect 90 3.6208 .62183 .03865 Organizational justice Direct 210 3.6000 .55767 .04594 -.990 Indirect 90 3.6129 .54360 .03465 Job satisfaction Direct 210 3.9989 .64703 .05244 -.371 Indirect 90 4.0103 .62343 .03962 * p <.05, ** p<.01, *** p<.001. 56
Table 18 show that the only hypotheses H1f and H2f are accepted (staff of direct and indirect divisons are different from their roles in organization: role conflict (Direct = 3.20, Indirect = 3.41 Indirect, t = -2637, p < .05), role ambiguity (Administrative-office = 3.06, service crees = 3.85, t = -8.514, p < .001). The hypotheses H3f (including H3.1f, H3.2f, H3.3f) and H4f are denied.
4.5 ANALYZING CORRELATION AND REGRESSION
Decriptive statistical data in Table 19 shows that staffs evaluate distribution justice, procedure justice, interaction justice (M> 3,57) and job satisfaction (M = 4.1) highly with a positive feeling. Exept for role conflict (M = 3.24), the staffs don’t evaluate highly. Role ambiguity (M = 2,4015), the almost staffs are negative attitude.
Table 19 descriptive statistics
Mean Std. Deviation N Role conflict 3.2400 .78485 300 Role ambuguity 2.4015 .97566 300 Distributive justice 3.5785 .65691 300 Procedural justice 3.5738 .64116 300 57
Interactive justice 3.6329 .62513 300
Organization justice
3.5817 .54886 300
Job satisfaction 4.1005 .63172 300
Table 20 Pearson correlation
Pearson Correlation Role confli ct Role ambigu ity Distribut ive justice Procedu ral justice Interacti ve justice Organizati onal justice Role ambiguity -.254* * Distributiv e justice .181* * -.204** Procedural justice .145* * -.067 .573** Interactive justice .148* * -.146** .523** .712** 58
Organizati onal justice .184* * -.160** .819** .887** .863** Job satisfactio n .156* * -.143** .420** .394** .338** .447** * p <.05, ** p<.01, *** p<.001 (2-tailed)
To test the hypotheses H5, H6 and hypothesis H7, this research is used correlation and regression analyses to testing the relationship between role conflict, role ambiguity, organization justice and job satisfaction. The results of analyzing correlation and regression show from Table 19 to 20.
Table 20 shows that Role conflict, role ambiguity, organization justice and job satisfaction have an important relationship: Role conflict (r = 0.420, p < 0.01), role ambiguity (r = - 0.143, p < 0.01), distributive justice (r = 0.420, p < 0.01), procedural justice (r = 0.394, p < 0.01), interactive justice (r = 0.338, p < 0.01) and organization justice (r = 0.447, p < 0.01); this research concludes that there are relationships between role conflict, role ambiguity, organization justice and job satisfaction among the sampled employees. Therefore, a linear regression analysis is done to test the specific relationship, the linear regression resuls are shown from Table 21 to 22
Table 21 Sample Overview Model R R Square Adjusted R Square Std. Error of the Estimate 1 .478a .223 .213 .56026
a. Predictors: (Constant), interactivejustice, roleambuguity, roleconflict, distributivejustice, proceduraljustice
According to the Table 21, R-Square in this table represents to role conflict, role ambiguity, organization justice accounting to 22.3% of job satisfaction variables.
An important test of the regression model in Table 22 also shows that role conflict, role ambiguity, organization justice (independent variables) significantly relate to job satisfaction (dependent variables) (F = 22.501, p <0.001).
Table 22 ANOVAa Model Sum of Squares df Mean Square F Sig. 1 Regression 36.011 5 7.003 22.501 .000a Residual 123.835 294 .313 Total 159.846 299 60
a. Predictors: (Constant), interactive justice, role ambuguity, role conflict, distributive justice, procedural justice
b. Dependent Variable: job satisfaction
Private variables organization, such as table 23 *: F = 100 801
Table 23 ANOVAb Model Sum of Squares df Mean Square F Sig. 1 Regression 33.052 1 32.049 100.801 .000a Residual 126.176 298 .320 Total 159.228 299
a. Predictors: (Constant), organization justice
b. Dependent Variable: job satisfaction
The regression analysis result is shown in Table 24