The Economic Effect of the Graying of the Population
3
0
0
全文
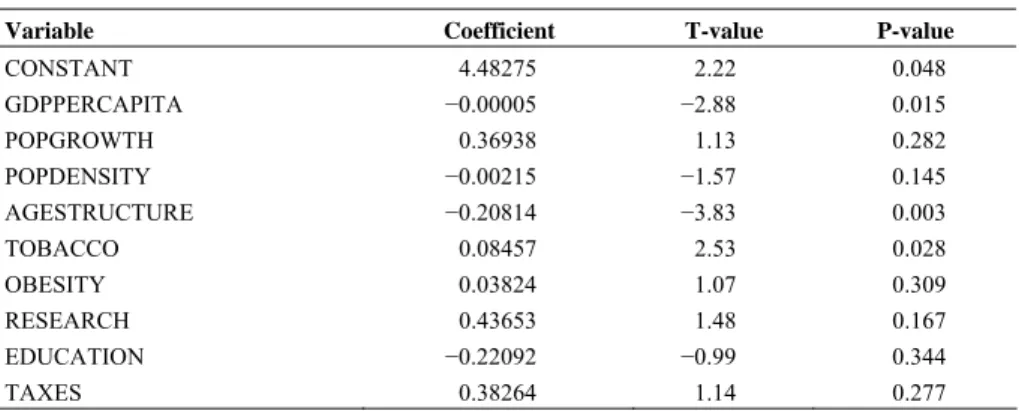
(2) 88. International Journal of Business and Economics. that aging will be problem is Siegel (2005), who claims that since young countries will be the “producers” and the aging countries will be the “consumers” in the future, there will be no problems with the future aging of the world. We examine in this paper a bit of empirical evidence on this vital and challenging question: whether the age structure of a society affects its economic performance. To do this, we model the factors likely to influence economic growth in OECD countries (OECD Observer, 2008). Using the variables described in Table 1, we show the multivariate regression results for the OECD countries in Table 2, where the average per capita growth rate in GDP is the response variable. Table 1. List of Variables Variable. Definition. GDPGROWTH. Average per capita growth rate in GDP from 1997-2007. POPGROWTH. Growth in population from 2005-2006. GDPPERCAPITA. GDP divided by population using current exchange rates, USD. POPDENSITY. Population per Km. AGESTRUCTURE. % total population 65 years and older. TOBACCO. % of adults smoking daily. OBESITY. % of adults with BMI > kg/m2. RESEARCH. Per capita expenditures on research and development, USD. EDUCATION. Public and private expenditures on education as % of GDP. TAXES Total tax receipts as % of GDP Notes: The nongrowth variables are usually for 2006. While 30 OECD countries are in the database, complete data were available for 21 countries. Table 2. Regression Results (Response = GDPGROWTH) Variable CONSTANT GDPPERCAPITA. Coefficient. T-value. P-value. 4.48275. 2.22. 0.048. −0.00005. −2.88. 0.015. POPGROWTH. 0.36938. 1.13. 0.282. POPDENSITY. −0.00215. −1.57. 0.145. AGESTRUCTURE. 0.003. −0.20814. −3.83. TOBACCO. 0.08457. 2.53. 0.028. OBESITY. 0.03824. 1.07. 0.309. RESEARCH EDUCATION. 0.43653. 1.48. 0.167. −0.22092. −0.99. 0.344. TAXES 0.38264 1.14 Notes: The OLS linear regression results based on robust standard errors. R 2 = 0.82 .. 0.277. The only three variables of interest that are statistically significant at the conventional 5% significance level are age structure (i.e., the percent of the population 65 years and older), tobacco use, and the level of per capita GDP. For this study, three variables are especially important. That population density and the population growth rate are not significantly associated with GDP growth but that old.
(3) David R. Kamerschen. 89. age is significantly associated with GDP growth is crucial. The significance levels of these three variables support the graying theory that the age structure of the population, not the relative size or growth of the population, is important in attaining faster economic growth. It is not surprising that there is a significant negative relationship between the level of per capita GDP and the growth of per capita GDP. This means that the higher the starting level of per capita GDP, the slower the rate of growth of per capita GDP. This conforms to the usual dictum that big is bad in the sense that more opulent nations have a hard time sustaining economic growth and similarly bigger mutual funds find it more different to get high percent growth rates than do smaller or mutual funds. It is probably not surprising that the predictor variable obesity was not significantly associated with GDP growth in these countries. This is not usually regarded as a crucial engine of economic growth, although some feel there is a relationship between the general health of an economy and its rate of economic growth. It is surprising that expenditures on research and development, education, and taxes had no significant associated with GDP growth. We usually postulate that these factors should positively influence economic growth. However, some of this is no doubt the result of the relatively short time frame for our analysis. The significant positive relationship between tobacco use and GDP growth, meaning that higher levels of tobacco use is associated with higher levels of economic growth, is also unexpected. For the purposes of this study, the most interesting result, besides the insignificance of population density and the population growth rate, is that the age structure had the biggest impact of all the explanatory variables on GDP growth. Age has a decidedly negative impact on economic growth, being significant at the 0.3% level. This result suggests that those who are concerned about how an aging population will harm future growth may be correct. But this paper is only a step toward further research. References Bloom, D., D. Canning, G. Fink, and J. Findlay, (2009), “The Cost of Low Fertility in Europe,” NBER Working Paper, No. 14820. Jackson, R. and N. Howe, (2008), The Graying of the Great Powers: Demography and Geopolitics in the 21st Century, Washington, DC: Center for Strategic International Studies. OECD Observer, (2008), Supplement 1, Paris, France: OECD Publications, 2. http://www.oecd.org/statistics. Siegel, J. J., (2005), The Future for Investors: Why the Tried and the True Triumph Over the Bold and the New, New York, NY: Crown Business..
(4)
數據
相關文件
volume suppressed mass: (TeV) 2 /M P ∼ 10 −4 eV → mm range can be experimentally tested for any number of extra dimensions - Light U(1) gauge bosons: no derivative couplings. =>
For pedagogical purposes, let us start consideration from a simple one-dimensional (1D) system, where electrons are confined to a chain parallel to the x axis. As it is well known
The observed small neutrino masses strongly suggest the presence of super heavy Majorana neutrinos N. Out-of-thermal equilibrium processes may be easily realized around the
Define instead the imaginary.. potential, magnetic field, lattice…) Dirac-BdG Hamiltonian:. with small, and matrix
incapable to extract any quantities from QCD, nor to tackle the most interesting physics, namely, the spontaneously chiral symmetry breaking and the color confinement..
(1) Determine a hypersurface on which matching condition is given.. (2) Determine a
• Formation of massive primordial stars as origin of objects in the early universe. • Supernova explosions might be visible to the most
The difference resulted from the co- existence of two kinds of words in Buddhist scriptures a foreign words in which di- syllabic words are dominant, and most of them are the
