The anomalous behavior of the density of water
in the range 30 K <
T < 373 K
Francesco Mallamace*†‡, Caterina Branca*, Matteo Broccio*, Carmelo Corsaro*, Chung-Yuan Mou§, and Sow-Hsin Chen†
*Dipartimento di Fisica and CNISM, Universita` di Messina, C. da Papardo, S. ta Sperone 31, 98166 Messina, Italy;†Department of Nuclear Science and Engineering, Massachusetts Institute of Technology, Cambridge, MA 02139; and§Department of Chemistry, National Taiwan University, Taipei 106, Taiwan Edited by H. Eugene Stanley, Boston University, Boston, MA, and approved September 27, 2007 (received for review July 11, 2007)
The temperature dependence of the density of water,(T), is
ob-tained by means of optical scattering data, Raman and Fourier transform infrared, in a very wide temperature range, 30 < T < 373 K. This interval covers three regions: the thermodynamically stable liquid phase, the metastable supercooled phase, and the low-density amorphous solid phase, at very low T. From analyses of the profile of the OH stretching spectra, we determine the fractional weight of the two main spectral components characterized by two different local hydrogen bond structures. They are, as predicted by the liquid–liquid phase transition hypothesis of liquid water, the low- and the high-density liquid phases. We evaluate contributions to the high-density of these two phases and thus are able to calculate the absolute density of water as a function of T. We observe in(T) a complex thermal behavior characterized not only by the well known maximum in the stable liquid phase at Tⴝ 277 K, but also by a well defined minimum
in the deeply supercooled region at 203ⴞ 5 K, in agreement with
suggestions from molecular dynamics simulations. infrared and Raman scattering兩 liquid–liquid phase transition 兩 supercooled and amorphous water兩 Widom line in water
U
nderstanding the fundamental role that water plays onEarth and in all aspects of life phenomena represents one of the most challenging research problems in science and tech-nology. In comparison with other simple molecular liquids, the
thermodynamic properties of water (H2O) are characterized by
a counterintuitive trend as temperature is lowered: examples are the isothermal compressibility, the isobaric heat capacity, the isobaric expansivity, and the density (1–3). The latter quantity, as is well known, exhibits a maximum at 277 K. Such a maximum is the only one occurring in liquids in their stable liquid phases just above the melting point. Over the years, many plausible explanations for these unusual behaviors have been proposed. In all of these explanations, the anomalies of water are invariably attributed to the role played by the hydrogen bond (HB) formation between water molecules (1). More precisely, the formation of HBs governs the overall structure and dynamics (1) of water, giving rise to, on decreasing T, a clustering process from which an open tetrahedrally coordinated HB network around each water molecule is gradually developed. It is such an increase in the HB structure that expands the liquid, compensating for the normal tendency of a liquid to contract as it is cooled. This finding is the basic reason for the occurrence of the density maximum phenomenon at 277 K (1–3).
Among the many theoretical approaches (4–6) developed to explain water properties in a supercooled state, there is the liquid–liquid phase transition (LLPT) hypothesis (6), which has received the most substantial support from various theoretical (7–10) and experimental studies (11, 12). For the LLPT model of water, the liquid state of water above the critical point is a mixture of two different local structures, characterized by dif-ferent densities, namely, the low-density liquid (LDL) and the high-density liquid (HDL). In the HDL, the local tetrahedrally coordinated HB network is not fully developed, whereas in the LDL, a more open, locally ‘‘ice-like’’ HB network is fully realized (1–3). Water has within it regions that are locally more LDL-like
and others that are locally more HDL-like (6–9). In addition, LDL and HDL correspond to the high-temperature continuation of the low- and high-density amorphous solid water phases, LDA (13) and HDA (14, 15), respectively. An important signature of the LLPT model is the prediction of a ‘‘second’’ critical point at
TC⬇ 220 K and PC⬇ 1 kbar.
Actually, by means of molecular dynamics (MD) simulations (10) and spectroscopy experiments (16–18), we have some confirmations of the predictions of the LLPT theory. In these
experiments, water was studied in the range 180⬍ T ⬍ 273 K,
inside a very deeply supercooled region and well below its
nucleation temperature TH ⫽ 231 K. In that case, to avoid
crystallization, water was confined in nanostructures so narrow that the liquid could not freeze. From these experiments, by using both neutron scattering and NMR spectroscopy, a fragile-to-strong dynamic crossover (FSC) and the Stokes–Einstein relation violation (SEV) (17) at and below the crossover tem-peratures were observed (10), as confirmed in simulations (19). The FSC marks a transition from a Vogel–Fulcher–Tamman to an Arrhenius behavior in dynamical parameters (16). Both FSC and SEV take place at ambient pressure at about the same
temperature, TL ⬇ 225 K. Furthermore, on the P-T phase
diagram, the observed FSC line coincides with the so-called Widom line (10, 12). The Widom line is the critical isochore above the LLPT critical point in the one-phase region. The neutron-scattering experiment located the end point of the Widom line, which is the predicted second critical point. In addition, Fourier transform infrared (FTIR) spectroscopy allows us to give direct evidence of the existence of the LDL phase in deeply supercooled, confined water (18). From this latter ex-periment, according to a well established procedure for the analysis of the OH stretching (OHS) vibrational mode, we have been able to measure the spectral contributions of the HB and non-hydrogen-bonded (NHB) water molecules, respectively, ob-taining their relative concentrations. In addition, these FTIR data (18) point out that water evolves with continuity from the supercooled liquid into the LDA phase, as suggested by the liquid–liquid critical point theory.
Another important suggestion coming from the MD simula-tion studies, using both the TIP5P-E and the ST2 potential
models for water, is that water exhibits a density minimum⬇70
K below the temperature of the density maximum (20, 21), TM.
Such a possibility may also be inferred from simple arguments on
Author contributions: F.M. and S.-H.C. designed research; F.M., C.B., M.B., and C.C. per-formed research; C.-Y.M. contributed new reagents/analytic tools; F.M., C.B., M.B., C.C., and S.-H.C. analyzed data; F.M., C.B., M.B., C.C., and S.-H.C. wrote the paper.
The authors declare no conflict of interest. This article is a PNAS Direct Submission.
Abbreviations: FSC, fragile-to-strong dynamic crossover; FTIR, Fourier transform infrared; HB, hydrogen bond; LDA, low-density amorphous solid water phase; LDL, low-density liquid; LLPT, liquid–liquid phase transition; HDA, high-density amorphous solid water phase; HDL, high-density liquid; MD, molecular dynamics; NHB, non-hydrogen-bonded; OHS, OH stretching; PHB, partially HB; RTN, random tetrahedral network; SEV, Stokes– Einstein relation violation.
‡To whom correspondence should be addressed. E-mail: francesco.mallamace@unime.it.
© 2007 by The National Academy of Sciences of the USA
APPLIED
PHYSICAL
considering the density data of supercooled bulk water, ice Ih, and LDA water (22). After the maximum, the density of bulk
water decreases rapidly with decreasing T before TH, whereas the
ice Ih has a smaller density than that of the liquid and, contrary to supercooled bulk water, has a normal positive expansivity, that is, density increases as T decreases. The same behavior is observed for LDA at its highest temperatures. From the struc-tural point of view, ice Ih represents the limiting case of a perfectly ordered tetrahedral network of HB, whereas LDA, which forms from deeply supercooled water, has a structure that very closely approaches that of a random tetrahedral network (RTN). Thus, ice Ih sets a lower bound for the density that the supercooled water could in principle attain. From these argu-ments, if the structure of deeply supercooled water approaches that of a RTN, and if nucleation can be avoided, it is then possible that a density minimum could occur in the deeply supercooled liquid.
Recently, the existence of a density minimum in the
super-cooled phase has been observed in confined D2O by using
neutron diffraction technique at the temperature Tmin⫽ 210 ⫾
5K (23). Motivated by this result, we report here a study on the
density of H2O in a very wide temperature interval that includes
LDA, supercooled confined water, and bulk water in the stable liquid phase. This study is done analyzing the spectra of the OHS vibrational modes obtained by means of Raman and FTIR spectroscopy. In particular, we have considered sound literature
data of OHS Raman spectra of LDA (24) (in the range 30⬍ T ⬍
130 K) and of bulk water (25, 26) (in the range 250⬍ T ⬍ 373
K), whereas for the T interval 183 ⬍ T ⬍ 303 K we have
considered the FTIR spectra of water confined in the same nanopores of the neutron diffraction experiment (18). Experimental
Scattering methods have been largely used to study structural and dynamical properties of water and constitute the most used experimental approach to understand its properties. Indeed, neutron (11, 12), x-ray (27), and Raman and IR (25, 26, 28, 29) scattering, have given evidence that water is characterized by the presence of two coexisting main HB structural phases, involving HB and NHB molecules, respectively. Thus, it became custom-ary to analyze OHS spectra by considering two general classes of O–H oscillators. These classes encompass broad Gaussian com-ponents, each referring to structures that involve a range of bond angles and distances distributed around the component peak position (29).
OHS spectra of water, as measured by Raman scattering and
IR absorption in the range 30⬍ T ⬍ 647 K (i.e., from the LDA
phase to almost the first critical point of water), have been described by the following component Gaussian peak positions
(wavenumbers) (29): (I) 3,120 cm⫺1, (II) 3,220 cm⫺1, (III) 3,400
cm⫺1, (IV) 3,540 cm⫺1, and (V) 3,620 cm⫺1(within an
experi-mental error of⫾20 cm⫺1). All of them have been
unambigu-ously classified as HB or NHB OHS oscillators by considering different scattering orientations (corresponding to the mean
polarizability␣ and the anisotropy ) and, in particular, by their
evolution as a function of temperature. The situation may be summarized as follows:
1. Component I dominates the intensity of the LDA phase (Raman data) (24), so that it represents the OHS contribution of water molecules forming the RTN. An analysis of its experimental FWHM in the T interval 30–303 K (i.e., in both the LDA and supercooled confined water) indicates that this can be identified as the LDL water phase (18). Its magnitude increases as T decreases.
2. Components II and III have been associated with water molecules having an average degree of connectivity larger than that of monomers, but lower than that involved in the HB
networks. Thus, they can be identified as partially HB (PHB) (25, 26, 29) molecules.
3. Components IV and V, being the only ones present in the Raman and IR spectra of bulk water in the T region near the
first critical point (630 ⬍ T ⬍ 647 K), arise from NHB
monomeric water (or to molecules poorly connected to their environment) (25, 29). The integrated intensities of PHB and
NHB water show an opposite temperature behavior for T⬎
300 K. While the intensities of NHB increase with increasing T, intensities of PHB decrease.
The classification of these contributions reflects that used in
the percolation hypothesis for water ( fispecies of water, with i
indicating the number of bonds) (5). Thus, the HB component I is f4, the NHB components IV and V are f0, and, finally, the PHB components II and III are f1, f2, and f3. We have to stress that according to the LLPT hypothesis, the HDL phase is represented by both the NHB and PHB. In Fig. 1 we report, in
the interval 30⬍ T ⬍ 373 K, the relative populations, WLDL, of
the LDL (red symbols) and WHDLof the HDL (green symbols)
water phases, calculated as the ratio of the component integrated area to the total OHS integrated area. For the latter phase, NHB (triangles) and PHB (circles) contributions are reported sepa-rately. According to the scattering theory, the relative
popula-tions are defined as Wi⫽ Ni/N, where Niand N are the number
of the particles of the phase i and the total number of scattering particles, respectively. Data are collected from different exper-iments: for the temperature region 30–130 K, we used the data coming out from the analysis of Raman spectra of LDA (24); for
183 ⬍ T ⬍ 303 K, we used our FTIR data on supercooled
confined water (18); whereas for 253⬍ T ⬍ 373 K, we analyzed
Raman data of bulk water (25, 26, 29). It is apparent that the thermal behavior of all three species is continuous across the different temperature ranges, although coming from different data sets. As it can be observed, the NHB and PHB contributions are present at all temperatures, whereas the LDL phase exists
Fig. 1. The temperature dependence of the relative populations (W) of the three main spectral contributions to OHS vibrational bands of H2O, obtained from Raman and FTIR spectroscopic experiments. PHB (green circles) and NHB (green triangles) refer to partially hydrogen-bonded and free water mole-cules, respectively. Fully tetrahedrally bonded molecules forming the RTN characterizing the LDL phase are reported as LDL (red squares). The different temperature regions where different experiments were performed are indi-cated. Raman data were taken in the two temperature ranges of low-density amorphous solid water (LDA; ref. 24) and bulk water in the thermodynami-cally stable liquid phase (25, 26, 29). FTIR data refer to confined water in the supercooled regime (18). The LDL phase shows up only below 303 K, whereas the other two phases exist over the entire studied temperature range. This latter result agrees with the fact that the water dynamics is not completely frozen even at T⫽ 30 K, in agreement with experimental observations (30).
only in the range 30–303 K. The LDA phase is dominated by the
LDL species, whereas in the stable liquid phase for T⬎ 303 K,
there is only the HDL. PHB population has a maximum at⬇303
K, decreases on decreasing T in the entire supercooled region,
crosses LDL at⬇225 K, and finally becomes stable (W ⬇ 0.29)
in the LDA phase.
From these results, it is evident that the HB RTN is formed essentially inside the metastable supercooled regime. It is also important to note that NHB and PHB are also present in the LDA phase. PHB is of the order of 30% and NHB is a few
percent (⬇6%) of the total water molecules, indicating that the
dynamics of LDA is not completely frozen even at T⫽ 30 K, in
agreement with experimental observations (30). Results and Discussion
Because only water contributes to the reported OHS spectra, its total density can be obtained only from the respective densities of its phases: the LDL and HDL. MD simulations (2) and proper neutron-scattering data give estimated values of the
correspond-ing densities (11):HDL⬇ 1.2 g/cm3andLDL⬇ 0.88 g/cm3. The
density of LDA was experimentally measured (by
decompres-sion and warming to 120 K) as (31): LDA ⬇ 0.94 g/cm3.
According to these results, together with the experimental proof
that the LDL phase exists only for T⬍ 303 K (18), the HDL
water is only given by the remaining spectral contributions classified as NHB and PHB.
Water density can be calculated knowing the fractioned
populations of LDL and HDL (WLDL and WHDL) and their
individual local densities,LDLandHDL. As shown in Fig. 1, W
of different water species has an evident temperature depen-dence in all of the studied liquid regime (180–373 K). Also, the individual densities, because they are related to the local struc-ture, may in principle change with temperature. The latter statement may be verified experimentally, considering, for
in-stance, the region T⬎ 303 K, where only the PHB and NHB
species, whose populations were measured in bulk water,
con-tribute to the OHS spectra (25). Thus, in the interval 303⬍ T ⬍
373 K, the densitiesPHBandNHBcan be obtained from the bulk
water density, according to the simple relationH2O⫽ WPHBPHB
⫹ WNHBNHB, where W represents the relative population of the
two species (plotted in Fig. 1), at different temperatures within
this interval. Because the density of bulk H2O, H2O, is well
known from careful measurements in the range from 239 to 423K
(32–35), by considering all of the WHDL(WPHBand WNHB) data
points measured in that T interval, we obtain the following
values:PHB⬇ 1.10 ⫾ 0.02 g/cm3andNHB⬇ 0.59 ⫾ 0.02 g/cm3.
As a result, these values are temperature-independent within the reported experimental error. This finding is not surprising, considering the literature data on the proton magnetic resonance chemical shift of liquid water in a temperature range 273–363 K. This quantity, which, as is well known, entirely reflects the system local structure, does not exhibit any singularity or dis-continuity in the temperature range above (36).
Two relevant situations emerge from our data analysis: (i) in
the considered T range (303⬍ T ⬍ 373 K), the density depends
on T only through W; (ii)NHB⬇ 0.59 ⫾ 0.02 g/cm3, according
to Kell’s representation (32, 33) of bulk water density as a
function of T, corresponds to the density value at T⬇ 625 K.
Such a value is smaller than that used (0.66 g/cm3for T⫽ 673
K, at a pressure of 800 bar) in a neutron-scattering experiment in the supercritical region, where no distinct HB peaks are
observable in the O–H radial distribution function gOH (37).
Thus, the value of NHB ⬇ 0.59 ⫾ 0.02 g/cm3 reasonably
represents that of NHB water, which dominates Raman spectra
in the region above the critical temperature. In addition,PHB⬇
1.10 ⫾ 0.02 g/cm3 is comparable to the value proposed by
neutron diffraction data for the HDL water (HDL⬇ 1.2 g/cm3;
ref. 11). Therefore, the contribution of HDL to the total H2O
density,⌬HDL, can be obtained in all of the explored T range
(30⬍ T ⬍ 373 K), by extending the calculation made forNHB
andPHBto the lowest temperatures. Fig. 2 Inset reports the
results of this calculation (green data) as a function of T; as it can
be observed, ⌬HDL increases with decreasing T in the range
310–373 K, then decreases continuously, with an inflection point
at⬇250 K and finally, in the LDA phase, shows a slight decrease
from⬇0.38 to an asymptotic value of 0.35 g/cm3.
Analogously, the density contribution of the LDL phase,
⌬LDL, can be obtained by assuming that⌬LDL⫽ WLDLLDL. The
LDL value can be calculated from H2O ⫽ ⌬HDL ⫹ ⌬LDL ⫽
⌬HDL⫹ WLDL LDL. For this calculation we consider the
tem-peratures 273 K and 28 3K (just around the density maximum,
where WLDL has been measured by Raman scattering in bulk
water), whereH2Ois 0.999868 and 0.99972 g/cm
3, respectively
(as reported in ref. 32). In such a way we obtainLDL⫽ 0.87 ⫾
0.02 g/cm3, a value that closely matches that proposed by neutron
diffraction data analysis (11) for LDL water. Using such a value,
we have obtained⌬LDL(T) in all of the temperature intervals
where LDL exists and reported it in Fig. 2 Inset as dark-red
squares. As one can see,⌬LDLincreases with decreasing T and
saturates to a value of⬇0.59 g/cm3 on approaching the LDA
temperature region. At the lowest T (T⬍ 100 K), in the LDA
phase, both⌬LDLand⌬HDLare nearly T-independent.
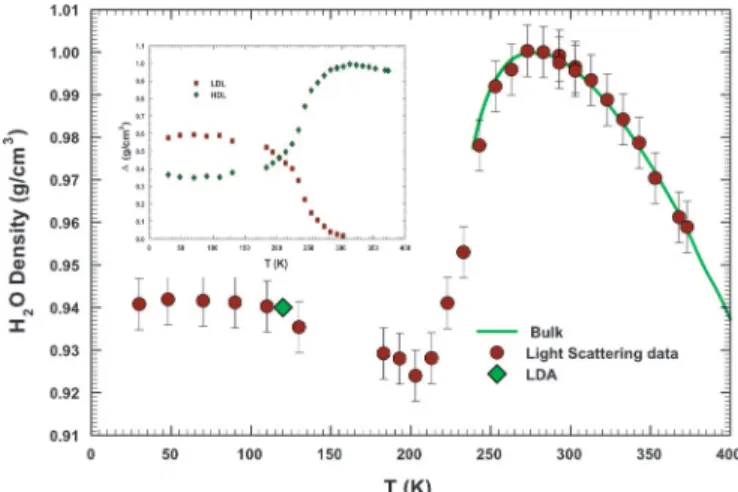
We report in Fig. 2 the temperature dependence ofH2Oas the
sum of the two contributions,⌬HDLand⌬LDL. For comparison,
we also report the values measured in bulk water in the range
239⬍ T ⬍ 423 K (32–34). As it can be observed, there is a good
agreement between our density results and the literature data for
H2Oin the supercooled regime (where, contrary to the range
273–373 K, data were not used to extract the values ofPHB,
NHB, andLDL). Two findings are remarkable: the minimum at
⬇203 ⫾ 5 K and the value of ⫽ 0.940 ⫾ 0.003 g/cm3in the LDA
phase, nearly the same as that measured in the LDA ice at T⫽
120 K (31). This result, together with those obtained for T⬎303
K, confirms that the LDL and HDL local structures are essen-tially temperature-independent so the thermal evolution of
water density comes only from that of WLDLand WHDL. Looking
carefully at the data in the region of deep supercooling (⬇250 K)
Fig. 2. The temperature dependence of calculatedH2O. The density values measured in pure bulk water in the range 239⬍ T ⬍ 423 K (32–34) are reported as a solid line. As one can see, a minimum is evident at TM⫽ 203 ⫾ 5 K. For T ⬍
TMdensity smoothly rounds off to the constant value ⫽ 0.940 ⫾ 0.003 g/cm3 in the LDA phase. Inside this latter phase, by means of the method of decompression and warming, the density has been measured at 120 K, ob-taining a valueLDA⬇ 0.94 g/cm3, plotted as a green diamond (31). (Inset) The contribution⌬ of the HDL (green diamonds) phase and LDL (red squares) phase to H2O density as a function of temperature. The two⌬ cross at ⬇203 K. LDL and HDL are defined according to the LLPT hypothesis (6).
APPLIED
PHYSICAL
it is possible to observe that our data, evaluated in confined water, are slightly lower than those measured in bulk. This finding may be attributed to the confinement effect of water inside the nanotubes, but the difference is not relevant enough to affect the overall result.
Besides the density minimum, an important result emerges from our experiment by estimating the derivative of the density
with respect to temperature (⭸/⭸T)P, shown in Fig. 3A. As it can
be observed, the inflection point between the maximum and the
minimum inH2O(T) is located at temperature TLcorresponding
to crossing of the Widom line at ambient pressure. Different phenomena have been correlated with the existence of the Widom line. Some examples are the SEV (17), a sharp change in the temperature derivative of the mean square displacement (12), and the maximum in the temperature derivative of the number of hydrogen bonds per molecule (18). We recall that SEV is due to the onset of dynamical heterogeneities whose
typical length scale is a few water molecules size. Our finding,
that is, the maximum in (⭸/⭸T)P, is thus not influenced by
possible confinement effects and is closely linked to this latter result found in simulation. Here, we have described the temper-ature behavior of water density, in the supercooled regime, as
mainly driven by the LDL phase. Thus, (⭸/⭸T)P reflects the
change of the local tetrahedral order with respect to tempera-ture. In addition, it is of relevant interest, from a thermodynamic
point of view, that the maximum in (⭸/⭸T)Poccurs at the same
temperature as the Widom line: the temperature TLis the locus
of the correlation length maximum, whereas the density deriv-ative is related with the cross-correlation between the entropy and volume fluctuations.
Fig. 3B reports the density of D2O measured in the confined
water by means of a small-angle neutron-scattering experiment (23) and, for comparison, the corresponding literature data of
bulk heavy water (35). We also report the data for H2O from the
present experiment, which include the densities within the LDA phase, the densities in bulk (32–34), and the results of the quoted
MD simulation of H2O with the TIP5P-E potential (20). As one
can see, there is a good agreement between the experimental
data on H2O and D2O: their density minima have the same
temperature shift as that of the corresponding maxima (⬇7 K);
moreover, the difference between maximum and minimum in
the two cases are about the same (⌬ ⬇ 0.08 g/cm3). Although
there is an observable difference between experimental densities
of H2O and MD simulations (20), this latter study still has the
merit of suggesting and supporting the existence of a minimum in the water density. It is reasonably possible that, with the use of another water potential, MD simulation might give more reliable results than the experimental ones. We also need to highlight that the presented density data result ‘‘indirectly’’ from scattering experiments and may be susceptible of further im-provements. Nevertheless, both experiments and simulations
show unambiguously the existence of a minimum in the H2O
density in the deeply supercooled regime. Methods
Raman data of LDA (24) and pure bulk water (25, 26) are reported
in the literature. Samples of H2O in the LDA phase have been
obtained from vapor deposition on a sapphire substrate mounted on a cold finger. The corresponding OHS spectra have been measured with a double monochromator, excitating samples with an Ar laser source. For the pure bulk water, essentially the same experimental setup has been used. There are numerous data sets concerning this latter phase, which practically coincide regardless of the experimental setup used (25, 26, 29). For this work, we have
used the data of refs. 25 and 26, which cover the range 249⬍ T ⬍
373 K. Refs. 24 and 25 provide the FWHM, the intensities (inte-grated areas), and the frequencies of the aforementioned Gaussian contributions, obtained by means of a best-fit procedure. In the case of ref. 26 spectra (measured by some of us), the data have been complemented with some new measurements and reanalyzed with the same customary procedure.
FTIR absorption measurements were performed as well at ambient pressure by confining water in a micelle-templated nanoporous silica matrix MCM-41-S (having 1D cylindrical tubes arranged in a hexagonal structure with a pore diameter of 1.4 nm) (38). As proven by several experimental methods, this MCM system can be regarded as one of the most suitable adsorbent models currently available (39, 40). In particular, it has been shown that in such a system water dynamics is weakly affected by confinement effects. By confining water, it is possible to probe liquid water at very low temperatures below its
homo-geneous nucleation temperature, TH. In nanoscale confinement,
the water molecules are unable to form a long-range crystalline structure.
Fig. 3. Main properties of water density. (A) Derivative ofH2Owith respect to temperature. The arrow indicates the Widom line temperature, TL, at ambient pressure, that is, the locus of the correlation length maximum in the P–T plane. (B) Densities of H2O (dark-red circles), D2O, and that obtained for H2O from MD simulation with the TIP5P-E potential (ref. 20; red circles) are reported. In the figure densities of D2O measured in confined water by means of neutron scattering (ref. 23; blue triangles) and that of bulk heavy water (ref. 34; dark-green line) are reported. We also report the density data of bulk H2O (light-green line; refs. 34 and 35). There is a good agreement between the experimental data of confined and bulk D2O; these span about the same temperature range covered by MD simulation data. Instead, our density data cover a range including also the LDA temperature region. Between the density minima of H2O and D2O, there is the same temperature shift as that of their maxima (⬇7 K); moreover, the difference between maximum and minimum (density amplitude) is about the same ( ⬇ 0.08 g/cm3) for the two water isotopes.
The host material used in the FTIR experiments is the same as that used in neutron experiments, which were able to
deter-mine the density minimum of D2O (23), having the same
hydration level h⬇ 0.5 (0.5 g of H2O per gram of MCM). The
experimental FTIR setup and the working procedure used are the same as described in ref. 18. In particular, our FTIR spectra of confined water were analyzed with the same deconvolution procedure as used for Raman data.
To calculate the density, we have considered the same approach used in ref. 23, based on the fundamental law of the scattering theory for which the integrated intensity of the scattered spectra I(q,) (where q is the scattering wavevector
and is the frequency) is directly proportional to the number
of the different species of scatterers. Namely, I(q,) ⫽ (N/
V)P(q)S(q,), where P(q) is the scatterer form factor, S(q,) is the dynamic structure factor, whereas N denotes the number of scatterers in the scattering volume V. In the case of the
neutron diffraction experiment of D2O confined in MCM-41-S
nanotubes, also the host material contributes to the scattered intensity I(q), so that the heavy water density was obtained by assuming that the amplitude of the silica pores (temperature-independent in the studied T range) was an indicator of the density of water in the sample (23). In the case of the reported OHS spectra, only water contributes to them. Fig. 1 consists of the relative integrated areas, obtained from all of the afore-mentioned spectroscopic experiments, which cover separate temperature ranges characteristic of different water phases. The research at Massachusetts Institute of Technolgoy is supported by a grant from the Materials Science Division of U.S. Department of Energy. The research at Universita` di Messina is supported by Messina University 2004. We benefited from affiliation with the EU Marie Curie Research and Training Network on Arrested Matter. We thank Professor Eugene H. Stanley for many fruitful discussions on the subject of water anomalies and the LL phase transition.
1. Angell CA (1982) in Water: A Comprehensive Treatise, ed Franks F (Plenum, New York), Vol 7, pp 1–81.
2. Debenedetti PG, Stanley HE (2003) Phys Today 56:40–46. 3. Mishima O, Stanley HE (1998) Nature 396:329–334. 4. Speedy RJ (1982) J. Phys Chem 86:982–991.
5. Stanley HE, Teixeira J (1980) J Chem Phys 73:3404–3422.
6. Poole PH, Sciortino F, Essmann U, Stanley HE (1992) Nature 360:324 – 328.
7. Moynihan CT (1997) Mater Res Soc Symp Proc 455:411–425.
8. Poole PH, Sciortino F, Grande T, Stanley HE, Angell CA (1994) Phys Rev Lett 73:1632–1635.
9. Borick SS, Debenedetti PG, Sastry SA (1995) J Phys Chem 99:3781–3793. 10. Xu LM, Kumar P, Buldyrev SV, Chen SH, Poole PH, Sciortino F, Stanley HE
(2005) Proc Natl Acad Sci USA 102:16558–16562. 11. Soper AK, Ricci MA (2000) Phys Rev Lett 84:2881–2884.
12. Liu L, Chen SH, Faraone A, Yen CW, Mou CY (2005) Phys Rev Lett 95:117802.
13. Burton EF, Oliver WF (1936) Proc R Soc Lond A 153:166–172. 14. Mishima O, Calvert LD, Whalley E (1984) Nature 310:393–395. 15. Mishima O, Calvert LD, Whalley E (1985) Nature 314:76–78.
16. Mallamace F, Broccio M, Corsaro C, Faraone A, Wanderlingh U, Liu L, Mou CY, Chen SH (2006) J Chem Phys 124:161102.
17. Chen SH, Mallamace F, Mou CY, Broccio M, Corsaro C, Faraone A, Liu L (2006) Proc Natl Acad Sci USA 103:12974–12978.
18. Mallamace F, Broccio M, Corsaro C, Faraone A, Majolino D, Venuti V, Liu L, Mou CY, Chen SH (2007) Proc Natl Acad Sci USA 104:424–428. 19. Kumar P, Buldyrev S, Becker SR, Poole PH, Starr FW, Stanley HE (2007) Proc
Natl Acad Sci USA 104:9575–9579.
20. Paschek D (2005) Phys Rev Lett 94:217802.
21. Poole PH, Saika-Voivoid I, Sciortino F (2005) J Phys Condens Matter 17:L431– L437.
22. Angell CA, Bressel RD, Memmati M, Sare EJ, Tucker JC (2000) Phys Chem
Chem Phys 2:1559.
23. Liu D, Zhang Y, Chen CC, Mou CY, Poole PH, Chen SH (2007) Proc Natl Acad
Sci USA 104:9570–9574.
24. Venkatesh CG, Rice SA, Bates JB (1975) J Chem Phys 63:1065–1071. 25. Walrafen GE (1967) J Chem Phys 47:114–126.
26. D’ Arrigo G, Maisano G, Mallamace F, Migliardo P, Wanderlingh F (1985)
J Chem Phys 75:4264–4270.
27. Bosio L, Chen SH, Teixeira J (1983) Phys Rev A 27:1468–1475.
28. Brubach J-B, Mermet A, Filabozzi A, Gerschel A, Roy P (2005) J Chem Phys 122:184509.
29. Walrafen GE (1974) in Structure of Water and Aqueous Solutions, ed Luck WAP (Verlag Chemie, Weinheim, Germany), pp 248–284.
30. Smith RS, Huang C, Kay BD (1997) J Phys Chem B 101:6123–6126. 31. Floriano MA, Handa YP, Klug DD, Whalley E (1989) J Chem Phys 91:7187–
7192.
32. Kell GS (1967) J Chem Eng Data 12:66–69. 33. Kell GS (1975) J Chem Eng Data 20:97–105. 34. Sorensen CM (1983) J Chem Phys 79:1455–1461.
35. Vedamuthu M, Singh S, Robinson GW (1996) J Phys Chem 100:3825– 3827.
36. Modig K, Pfrommer B, Halle B (2003) Phys Rev Lett 90:075502. 37. Soper AK, Bruni F, Ricci MA (1997) J Chem Phys 106:247–254. 38. Shih PC, Lin HP, Mou CY (2003) Stud Surf Sci Catal 146:557–560. 39. Schreiber A, Ketelsen I, Findenegg GH (2001) Phys Chem Chem Phys
3:1185–1195.
40. Morishige K, Nobuoka K (1997) J Chem Phys 107:6965–6969.
APPLIED
PHYSICAL