© The Author 2013. Published by Oxford University Press. All rights reserved. For permissions, please e-mail: journals.permissions@oup.com
Factors Related to Fungiform Papillae Density: The Beaver Dam
Offspring Study
Mary E. Fischer
1, Karen J. Cruickshanks
1,2, Carla R. Schubert
1, Alex Pinto
1, Ronald Klein
1,
Nathan Pankratz
3, James S. Pankow
4and Guan-Hua Huang
51
Department of Ophthalmology and Visual Sciences, University of Wisconsin, 610 Walnut
Street, Madison, WI, USA, 53726
2Department of Population Health Sciences, University
of Wisconsin, 610 Walnut Street, Madison, WI, USA, 53726
3Department of Lab Medicine
and Pathology, University of Minnesota, 515 Delaware Street SE, Minneapolis, MN, USA,
55455
4Division of Epidemiology and Community Health, University of Minnesota, 1300 S
2nd Street, Minneapolis, MN, USA 55454 and
5Institute of Statistics, National Chiao Tung
University, 1001 Ta Hsueh Road, Hsinchu, Hsinchu 300, Taiwan
Correspondence to be sent to: Mary E. Fischer, Department of Ophthalmology and Visual Sciences, University of Wisconsin, Madison,
WI, 53726, USA. e-mail: fischer@episense.wisc.edu
Accepted May 30, 2013
Abstract
The distribution of fungiform papillae density and associated factors were examined in the Beaver Dam Offspring Study. Data were from 2371 participants (mean age = 48.8 years, range = 21–84 years) with 1108 males and 1263 females. Fungiform papillae were highlighted with blue food coloring and the number of fungiform papillae within a standard 6-mm circle was counted. Whole mouth suprathreshold taste intensity was measured. The mean fungiform papillae density was 103.5 papillae/cm2
(range = 0–212.2 papillae/cm2
). For each 5-year increase in age, the mean fungiform papillae density was 2.8 papillae/cm2
lower and the mean density for males was 10.2 papillae/cm2
lower than for females. Smokers had significantly lower mean densities (former smokers: −5.1 papillae/cm2
; current smokers: −9.3 papillae/cm2
) than nonsmokers, and heavy alcohol drinkers had a mean density that was 4.7 papillae/cm2
lower than nonheavy drinkers. Solvent exposure was related to a significantly higher density (+6.8 papillae/cm2
). The heritability estimate for fungiform papillae density was 40.2%. Propylthiouracil taster status, TAS2R38 haplotype, and perceived taste intensity were not related to density. In summary, wide variability in fungiform papillae density was observed and a number of related factors were found including the modifiable factors of smoking and alcohol consumption.
Key words: fungiform papillae, heritability, taste
Introduction
Fungiform papillae (FP), primarily located on the anterior tongue (Miller 1986), house the taste buds and may play an important role in taste functioning and oral sensation. The density of FP varies widely among individuals but it is not clear what factors are associated with the number of FP or with possible changes in FP density over time (Miller and Reedy 1990a; Zhang et al. 2009; Konstantinidis et al. 2010; Pavlidis et al. 2013). The influence of age on FP density has been investigated but in a number of studies, an association has not been found (Kullaa-Mikkonen et al. 1987; Zuniga et al. 1993; Zhang et al. 2009; Konstantinidis et al. 2010; Pavlidis et al. 2013). In some
studies, females had more FP than males (Bartoshuk et al. 1994;
Hayes et al. 2008; Duffy et al. 2010), but there were no gender differences in other investigations (Zuniga et al. 1993; Just et al. 2006; Yeomans et al. 2007; Pavlidis et al. 2013). In studies of the effects of smoking on papillae number and morphology, it was reported that although there were morphologic differences in the FP between smokers and nonsmokers, there was no significant difference in the number of FP (Konstantinidis et al. 2010;
Pavlidis et al. 2013). Finally, damage to the chorda tympani nerve has been reported to be related to a decrease in papillary density (Zuniga et al. 1997; Just et al. 2006).
at National Chiao Tung University Library on April 24, 2014
http://chemse.oxfordjournals.org/
The relationship of FP density with taste measures is also not established. Some previous studies have suggested that individuals highly sensitive to 6-n-propylthiouracil (PROP), termed supertasters, have more FP and taste pores than individuals who do not taste PROP, termed nontasters (Bartoshuk et al. 1994; Yackinous and Guinard 2001; Essick et al. 2003; Duffy et al. 2010). An early study found that the number of taste pores within a region of the tongue tip was associated with the perceived intensity ratings of locally applied suprathreshold concentrations of sweet and salt but not sour and bitter (Miller and Reedy 1990b). More recently, the number of stimulated FP was found to be associated with the perceived intensity of quinine HCl within individu-als but did not explain the difference in perceived intensity between individuals (Delwiche et al. 2001).
The previous work on papillary density has almost exclu-sively been performed in small study cohorts or convenience samples and the results may not be comparable across stud-ies or representative. The purpose of this study was to deter-mine the distribution of FP density in a large cohort study of adults and identify factors associated with FP. In addi-tion, the relationships of FP density with TAS2R38 geno-type, perceived intensity of PROP, and perceived intensity of the 4 basic tastes were determined. Because of the possible link between FP density, taste, nutrition, and health, it is of interest to assess the strength of the association between FP density and taste perception and to determine if any FP den-sity-related factors are modifiable. Finally, the heritability of FP density was estimated.
Materials and methods
Study population
Participants in the Beaver Dam Offspring Study (BOSS) were included in the study. The adult children (ages 21–84 years) of members of the population-based Epidemiology of Hearing Loss Study (EHLS) were eligible to participate in BOSS and the examination took place in 2005–2008 (Cruickshanks et al. 1998; Cruickshanks et al. 2009; Zhan et al. 2010). Methods for measuring taste functioning and for tongue imaging that are applicable for large, epidemiologic field studies were developed and included in the examination (Cruickshanks et al. 2009). There were 2371 BOSS partici-pants with FP density and taste intensity data. Approval of the study was granted by the Health Sciences Institutional Review Board of the University of Wisconsin and informed consent was obtained from the participants.
Measurements
Papillae count
To obtain digital images of the tongue and papillae, the tip of the tongue was stained with blue food coloring (McCormick
& Co., Inc.). Filiform papillae stained dark but FP remained pink (Miller and Reedy 1990a). The digital camera was mounted on a column support on a table equipped with a chin and forehead rest to maintain a fixed distance from the tongue to the camera. After adjustment of the focus, a plastic slide was placed on the tongue tip right of the mid-line, the tongue was compressed, and images were obtained. Additional details of the tongue imaging have been reported (Cruickshanks et al. 2009).
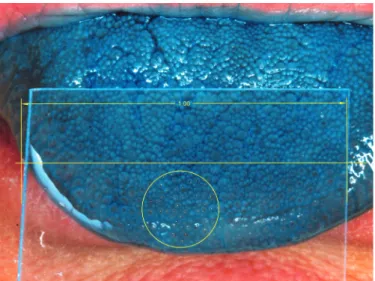
Grading of the digital tongue images was done by count-ing the number of FP within a standard 6-mm diameter cir-cle with the right edge bordering the midline of the tongue and the bottom edge bordering the tongue tip (Figure 1). For the purposes of this study, papillary density was calculated using the following formula: FP density = [FP number/(9 × pi)] × 100.
A protocol was followed for determining whether a papilla was a fungiform papilla using the characteristics of pink or red color, mushroom-shaped or vascularized, and larger size. A standard set of tongue images was used for initial training and certification of the graders and was regraded on a periodic basis during the study. The mean difference and mean absolute difference between the grader’s count and the standard count were required to be within 5. In addition, 60% or more of the differences had to be within 5 and 90% or more within 10. Retraining took place if the requirements were not met. Evaluation of intragrader variability showed that the mean absolute difference between 2 gradings of the same image was 3.1 with 80% having counts within 5 papillae (Cruickshanks et al. 2009).
Taste intensity
Whole mouth taste testing was performed using filter paper disks 3 cm in diameter impregnated with suprathreshold
Figure 1 Image with placement of standard measurement circle on stained
tongue.
at National Chiao Tung University Library on April 24, 2014
http://chemse.oxfordjournals.org/
concentrations of 1.0 M sodium chloride (salt), 1.8 M sucrose (sweet), 0.1 M citric acid (sour), 0.001 M quinine (bitter), and 1.0 M PROP. Disks were supplied by an outside laboratory, and tastes were presented in a standard order beginning with salt followed by sweet, sour, bitter, and PROP (Cruickshanks et al. 2009).
Perceived taste intensity was measured using a general labeled magnitude scale (gLMS) (Bartoshuk et al. 2004). The gLMS scale ranged from 0 denoting “No sensation” to 100 denoting “Strongest imaginable sensation of any kind.” The tongue imaging and taste intensity measurements were conducted only in participants who successfully completed training in the use of the gLMS scale.
TAS2R38 haplotype
DNA, extracted from whole blood, was genotyped for par-ticipants 45 years of age and older using the Illumina IBC chip (Keating et al. 2008). Haplotypes were constructed from the genotype data for the 3 common nonsynonymous SNPs within TAS2R38 (rs713598, rs1726866, and rs10246939) using the PLINK tool set that employs a standard E-M algo-rithm for making haplotype predictions (Purcell et al. 2007). Base pair substitutions at the 3 sites result in the amino acid substitutions of alanine for proline, valine for alanine, and isoleucine for valine. Participants with the common haplo-types of PAV and AVI were included in the TAS2R38 analy-ses, whereas those with other, rare haplotypes were excluded. Those harboring 2 copies of the PAV haplotype are often labeled as “tasters” and those with AVI/AVI are labeled “nontasters.”
Covariates
A number of factors were considered for possible associa-tion with FP number. The demographic variables used were age, sex, and education (college graduate [16+ years of edu-cation]). With respect to behavioral factors, obesity, using height and weight obtained during the examination, was defined as a body mass index (weight in kilograms/[height in meters]2) equal to 30.0 or greater. Smoking history was
self-reported, and participants were grouped into the categories of never, former, and current. Regarding alcohol consump-tion, participants specified the number of servings of beer, wine, and liquor that he/she usually consumed in the average week. The number of servings was converted to grams of ethanol and the following categories were created: 0, 1–14, 15–74, 75–140, and greater than 140 g of ethanol/week. In addition, participants answered the following question, “Has there ever been a time in your life when you drank 4 or more alcoholic beverages daily?”
Among the self-reported health conditions evaluated were history of head injury (broken nose, skull fracture,
concussion, or loss of consciousness due to a head injury), ear infections and surgery, tooth loss due to gum disease, periodontal disease, burning or tingling in the mouth, and pain or tingling in the face or teeth. The San Diego Odor Identification Test (Murphy et al. 2002; Schubert et al. 2009, 2012; Raynor et al. 2010) was used to measure olfaction, and impairment was considered present if less than 6 of the 8 odorants were correctly identified. Exposure to organic sol-vents (styrene, trichloroethylene, tolulene, or xylene) cur-rently and at any time in the past was self-reported.
Prescription and over-the-counter medications used in the past month were recorded at the time of the examination. The medication classes considered in the analyses included any high blood pressure medication, ACE inhibitors sepa-rately, any lipid-lowering medication, statins sepasepa-rately, anti-depressants, and antianxiety medications.
Statistical analyses
All analyses, except heritability estimates, were performed using SAS, version 9.2 (SAS Institute, Inc.). Heritability was estimated twice, with and without the inclusion of signifi-cant covariates, using SOLAR (Almasy and Blangero 1998). To determine the factors related to FP density, analysis of variance testing and multiple linear regression modeling was performed. Generalized additive models, an exploratory nonparametric regression modeling tool, along with linear regression models with squared and cubic terms for age were used to explore any nonlinear patterns in the age–papillary density relationship. Least square mean papillary densities for each category of the putative-related factors were esti-mated with adjustment for age and sex via the SAS pro-cedure, PROC GLM. The OM adjustment was applied to achieve margins observed in our population. For the assess-ment of PROP taster status, the following categories were used: supertasters (≥53 units on gLMS scale), medium tast-ers (>17 and <53 units), and nontasttast-ers (≤17 units).
Factors that were found to be significantly (P < 0.05) related to FP density in the age–sex-adjusted analyses were included in the multivariable linear regression model. In the regression model, age was entered as 5-year increments and other factors were entered as dichotomous or indicator variables. The estimated regression coefficients indicate the change in papillae density associated with the presence of each factor or with an increase of 5 years of age. Ninety-five percent confidence intervals (CIs) were calculated based on the standard errors of the estimated regression coefficients.
The relationship between FP density and the perceived intensity of salt, sweet, sour, and bitter was evaluated using multiple linear regression. Models were first fit with age and sex as covariates. Subsequently, full multivariable models were fit with age, sex, smoking history, heavy alcohol use, and any history of solvent exposure as covariates. To assess a possible nonlinear relationship between papillary density and perceived
at National Chiao Tung University Library on April 24, 2014
http://chemse.oxfordjournals.org/
intensity, a linear regression model was fit with indicator variables representing quartiles of the papillary density.
Factor analysis was used to create a single composite variable(s) representing the common factor(s) underlying the perceived intensity of the 4 tastants. The loadings of each taste on the composite score were salt = 0.249, sweet = 0.191, sour = 0.365, and bitter = 0.277. The relationship between FP density and the standardized composite score was evalu-ated using multiple linear regression modeling.
Results
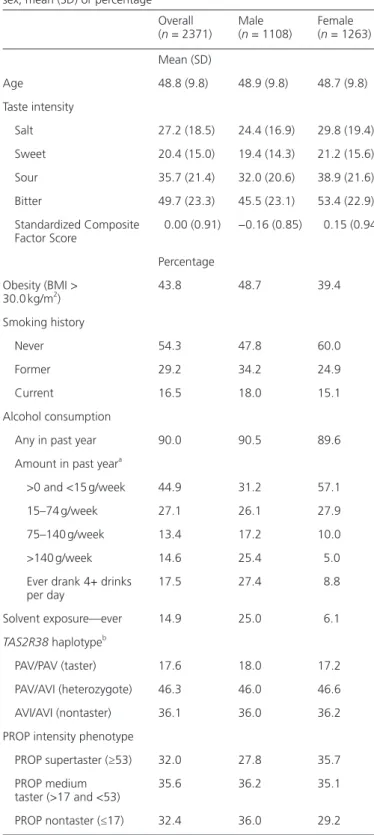
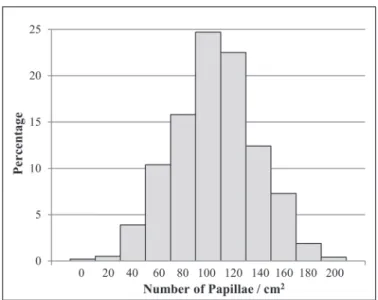
There were 2371 participants with an age range of 21–84 years (mean = 48.8 years) included in this study (Table 1). There were slightly more females (n = 1263) than males (n = 1108), but the mean age was very similar in the 2 groups (mean age: males = 48.9; females = 48.7). The FP density ranged from 0 to 212.2 papillae/cm2 with a mean of 103.5 papillae/cm2
(standard deviation [SD] = 32.8 papillae/cm2) and a median
of 102.6 papillae/cm2 (Figure 2). Approximately 10% of the
participants had less than or equal to 60 papillae/cm2 and
close to 10% had more than 145.0 papillae/cm2.
Papillae density significantly (P < 0.001) decreased as age increased and there was no evidence of a nonlinear relationship between age and FP density (Table 2). Females had a significantly greater FP density than men (age-adjusted means: females = 108.4 papillae/cm2; males = 97.9 papillae/
cm2, P < 0.001; Figure 3). Papillary density was found to be
significantly lower in smokers compared with never smokers (age- and sex-adjusted means: never smokers = 106.6 papillae/cm2;
former smokers = 101.3 papillae/cm2; current smokers = 97.1
papillae/cm2, P < 0.001). No significant association between
FP density and number of cigarettes smoked per day among the current smokers was observed, but there was a marginally significant (P = 0.06) association between FP density and years since last smoked among the former smokers.
Among those who consumed alcohol in the past year, there was a significant dose–response (P < 0.001) relationship between level of alcohol consumed and papillary density. Participants consuming 75–140 g of ethanol per week had an average of 101.0 papillae/cm2 compared with 106.0 papillae/
cm2 among the participants consuming less than 15 g/week.
Participants consuming more than 140 g of ethanol per week had an average of 98.6 papillae/cm2. A history of ever
drink-ing 4 or more alcoholic drinks per day durdrink-ing a period of life was associated with a significantly lower papillary density (P < 0.001). Participants with current solvent exposure or a history of exposure had a significantly greater mean den-sity of FP after adjustment for age and sex (ever exposure: yes = 108.3 papillae/cm2; no = 102.6 papillae/cm2).
There was no significant difference in FP density between the TAS2R38 haplotype groups. The mean FP densities in the PROP intensity phenotype groups also did not dif-fer in the overall study population or in the subgroups of
TAS2R38 homozygotes and TAS2R38 heterozygotes. The
correlation between FP density and perceived intensity of PROP was 0.02 (P = 0.37).
Finally, there were no significant associations between papillary density and a college education, obesity, any of the
Table 1 Distribution of study population characteristics, overall and by
sex; mean (SD) or percentage Overall (n = 2371) Male (n = 1108) Female (n = 1263) Mean (SD) Age 48.8 (9.8) 48.9 (9.8) 48.7 (9.8) Taste intensity Salt 27.2 (18.5) 24.4 (16.9) 29.8 (19.4) Sweet 20.4 (15.0) 19.4 (14.3) 21.2 (15.6) Sour 35.7 (21.4) 32.0 (20.6) 38.9 (21.6) Bitter 49.7 (23.3) 45.5 (23.1) 53.4 (22.9) Standardized Composite Factor Score 0.00 (0.91) −0.16 (0.85) 0.15 (0.94) Percentage Obesity (BMI > 30.0 kg/m2) 43.8 48.7 39.4 Smoking history Never 54.3 47.8 60.0 Former 29.2 34.2 24.9 Current 16.5 18.0 15.1 Alcohol consumption
Any in past year 90.0 90.5 89.6
Amount in past yeara
>0 and <15 g/week 44.9 31.2 57.1
15–74 g/week 27.1 26.1 27.9
75–140 g/week 13.4 17.2 10.0
>140 g/week 14.6 25.4 5.0
Ever drank 4+ drinks
per day 17.5 27.4 8.8 Solvent exposure—ever 14.9 25.0 6.1 TAS2R38 haplotypeb PAV/PAV (taster) 17.6 18.0 17.2 PAV/AVI (heterozygote) 46.3 46.0 46.6 AVI/AVI (nontaster) 36.1 36.0 36.2 PROP intensity phenotype
PROP supertaster (≥53) 32.0 27.8 35.7 PROP medium
taster (>17 and <53) 35.6 36.2 35.1 PROP nontaster (≤17) 32.4 36.0 29.2
a
Among those who consumed alcohol in the past year.
bAvailable for 1272 participants 45 years of age and over.
at National Chiao Tung University Library on April 24, 2014
http://chemse.oxfordjournals.org/
classes of medications, histories of head injury, ear infec-tions or ear surgeries, and reported oral condiinfec-tions including tooth loss due to gum disease, periodontal disease, burning or tingling in the mouth, and pain or tingling in the face or teeth. Impaired olfaction was not related to papillary density and excluding participants with olfactory impairment did not appreciably alter any of the results.
All factors observed to be significantly related to FP den-sity in the age- and sex-adjusted models remained significant in the multivariable model (Table 3). The effect sizes seen in the multivariable model were generally similar to those seen in the univariate models for all variables.
Regarding heritability, there were 2359 individuals with complete data for FP density as well as all significant covari-ates. The analyses included 345 singletons, which only help model the distribution of the trait, and 554 families (mean number of family members = 3.64 ± 3.53, range: 2–48). Without covariates, the heritability estimate was 0.435 ± 0.053 (P = 4.7 × 10⁻²⁰). When including age, sex, heavy alcohol use,
current smoker, ever smoker, and solvent exposure, the herit-ability estimate was 0.402 ± 0.053 (P = 1.2 × 10⁻¹⁷). Residual
kurtosis for both models was less than 0.15. The total pro-portion of the variance accounted for by the 6 covariates was 7.57%.
Table 2 Mean FP density, adjusted for age and sex
Age–sex- adjusted mean Standard error P value Age 21–34 114.2 2.8 <0.001 35–44 107.7 1.2 45–54 104.4 1.1 55–64 95.9 1.5 65–84 93.4 2.6 Sex Male 97.9 1.0 <0.001 Female 108.4 0.9 Obesity (BMI > 30.0 kg/m2) Yes 102.6 1.0 0.27 No 104.1 0.9 Smoking history Never 106.6 0.9 <0.001 Former 101.3 1.2 Current 97.1 1.6
Figure 2 Distribution of FP density.
Age–sex- adjusted mean Standard error P value Alcohol consumption Any in past year
Yes 103.5 0.7 0.69
No 102.7 2.1
Amount in past yeara
>0 and <15 g/week 106.0 1.1 <0.01
15–74 g/week 104.2 1.3
75–140 g/week 101.0 1.9
>140 g/week 98.6 1.9
Ever drank 4+ drinks per day
Yes 98.1 1.6 <0.001 No 104.6 0.7 Solvent exposure—ever Yes 108.3 1.8 <0.01 No 102.6 0.7 TAS2R38 haplotypeb PAV/PAV (taster) 98.0 2.2 0.17 PAV/AVI (heterozygote) 99.8 1.3 AVI/AVI (nontaster) 102.6 1.5 PROP intensity phenotype
PROP supertaster (≥53) 103.3 1.2 0.96 PROP medium taster
(>17 and <53) 103.1 1.1 PROP nontaster (≤17) 103.6 1.2
a
Among those who consumed alcohol in the past year.
bAvailable for 1272 participants 45 years of age and over.
at National Chiao Tung University Library on April 24, 2014
http://chemse.oxfordjournals.org/
There was a weak, inverse relationship between FP den-sity and perceived intenden-sity of salt whereby an increase of 20 papillae/cm2 was associated with a decrease of 0.6 (95%
CI = −1.1, −0.1) units in perceived salt intensity. There was no significant association between FP density and perceived intensity of sweet, sour, or bitter, and there was no sugges-tion of a nonlinear relasugges-tionship between FP density and per-ceived intensity for any of the 4 tastes. Finally, no significant
relationship between FP density and the composite factor score of the perceived intensities was observed.
Discussion
The density of FP (0–212.2 papillae/cm2) located on the
tongue tip varied greatly between individuals. This inter-individual variability has been reported previously with ranges of FP densities (papillae/cm2) of 22–74 (Miller and
Reedy 1990b), 33–156 (Bartoshuk et al. 1994), and 7–233 in a group of male subjects (Zhang et al. 2009) and in a study of females, 33–184 (Essick et al. 2003). The somewhat wider range observed in the present study compared with some of the prior reports may be a reflection that data were available from a considerably larger population with close to an equal number of males and females. A substantial number of fam-ilies were included in this population, allowing for the calcu-lation of the heritability estimate for FP density of 40%. Past investigations have not reported heritability estimates.
The present study found that as age increased, FP density decreased. In a study that included childhood ages and inves-tigated chorda tympani nerve transection, an inverse relation-ship between FP density and age was observed in the control group, which included ages 7–71 (Just et al. 2006). Within adult ages, previous studies have not found strong age effects (Kullaa-Mikkonen et al. 1987; Zuniga et al. 1993; Zhang et al. 2009; Konstantinidis et al. 2010; Pavlidis et al. 2013). But the large substantial interindividual variation in FP density may limit the ability of small studies with narrow age ranges to detect an age effect. The present investigation benefits from a large study population with an age range of 21–84 years. It should be noted that the observed relationship is cross-sectional
Figure 3 FP density by age group and sex. Shaded boxes represent the interquartile range, diamonds within the boxes show the means, horizontal lines
within the boxes indicate the medians, and vertical lines show the range of the data.
Table 3 Association of FP density with demographic, behavioral, and
environmental factors, multivariable model Factors Multivariable model
B (difference in number of papillae/cm2 ) 95% CI P value Demographic Age (+5 years) −2.80 −3.46, −2.14 <0.001 Sex (male) −10.22 −12.95, −7.48 <0.001 Behavioral/environmental Smoking history Never Reference — — Former −5.14 −8.15, −2.13 <0.001 Current −9.34 −13.04, −5.64 <0.001 Alcohol consumption Ever drank 4+
drinks per day −4.68 −8.23, −1.13 <0.01 Solvent
exposure—ever 6.84 3.10, 10.57 <0.001
at National Chiao Tung University Library on April 24, 2014
http://chemse.oxfordjournals.org/
and does not answer the question of how FP density changes with aging. In addition, birth cohort effects and aging effects cannot be disentangled with the cross-sectional data.
Females were found to have significantly greater FP densi-ties than males even after adjusting for the effects of age, smoking, and alcohol consumption. This gender difference has been reported previously in some (Bartoshuk et al. 1994;
Tepper and Nurse 1997; Duffy, Davidson, et al. 2004; Hayes et al. 2008; Duffy et al. 2010; Pavlidis et al. 2013) but not all (Zuniga et al. 1993; Just et al. 2006; Yeomans et al. 2007;
Konstantinidis et al. 2010) studies. Few prior investigations adjusted for age when determining gender differences or adjusted for other covariates.
This study found that environmental exposures, namely smoking, alcohol, and solvents, were associated with FP den-sity. Current smokers had on average fewer FP than former smokers who in turn had fewer FP than never smokers. In contrast, in a limited number of previous studies, no rela-tionship between FP density and smoking history has been reported. In a recent study, although FP density was found to be similar in smokers and nonsmokers, capillary vessel morphology did differ with smokers having poorer micro-circulation (Konstantinidis et al. 2010). In addition, keratin structures on the FP were observed more often in smokers indicating possible atrophy (Nagato et al. 1995). Differences in the average duration of smoking in the present study (aver-age number of years of smoking among former smokers was 13.3 years and among current smokers was 25.2 years) com-pared with the earlier study (smokers averaged 5.5 years of smoking) (Konstantinidis et al. 2010) may have contributed to the dissimilar findings. It should also be noted that because the relationship observed in this study is cross-sectional, it is not possible to determine if smoking leads to the loss of FP or if having fewer FP contributes to acquiring or main-taining a smoking habit. The FP are innervated by the lin-gual (trigeminal) nerve (cranial nerve V), which is involved in somatosensory functions such as the response to the irrita-tion or burn from consumed substances. As a consequence, individuals with fewer FP may not experience as much irrita-tion or somatosensory sensairrita-tions from smoking.
A history of heavy alcohol use was found to be associated with a lower mean FP density, which may reflect that lower FP density is associated with less irritation from alcohol because of the involvement of the trigeminal nerve. In previ-ous work, when the association between FP density and alco-hol intake was estimated independent of a PROP influence, no significant association was observed (Duffy, Davidson, et al. 2004; Duffy, Peterson, et al. 2004). However, subjects with the greatest FP number exhibited the most intense oral burn from alcohol (Duffy, Peterson, et al. 2004).
This study found that a history of solvent exposure was related to a higher mean FP density. Possible explanations for this finding include that solvent exposure may be a marker for other, underlying genetic or environmental differ-ences, that there is a biologic or anatomic relation, which this
study could not elucidate, or that the observed association is a chance finding.
No relationship of FP density with TAS2R38 haplotype and PROP taster status was observed. Previous work has reported no significant association between TAS2R38 haplotype and FP density (Duffy, Davidson, et al. 2004), but there have been a number of investigations suggesting that PROP super-tasters have more FP than nonsuper-tasters (Bartoshuk et al. 1994;
Tepper and Nurse 1997; Essick et al. 2003; Duffy et al. 2010). However, in one report, FP number was found to be related to perceived PROP intensity only in the TAS2R38 homozygote groups and not in the TAS2R38 heterozygote group (Hayes et al. 2008). Varying age distributions may explain part of the inconsistency between the present study and some of the pre-vious reports. Participants in the present study had an aver-age aver-age of close to 49 years, whereas the studies reporting a relationship between PROP taster status and FP number were primarily conducted in young (<40 years) study populations. In the young (21–34) participants of this study, the super-tasters had a greater mean FP density (females: 122.7 papillae/ cm2; males: 112.0 papillae/cm2) compared with the nontasters
(females: 115.6 papillae/cm2; males: 101.6 papillae/cm2), but
these differences were not significant.
It has been hypothesized that FP density is also associated with the perceived intensity of the 4 basic tastes. An early investigation found an association of FP density with per-ceived intensity of sweet and salt but not with sour or bitter (quinine HCl) (Miller and Reedy 1990b). The present study did not find an association between FP density and intensity. This finding is similar to the results of a study reporting spa-tial summation, which refers to a positive correlation between the number of FP stimulated and the perceived intensity of a tastant (Delwiche et al. 2001). Although spatial summa-tion was demonstrated as occurring within subjects, it was not found to be an adequate explanation of between-subject variability in perceived bitter intensity (Delwiche et al. 2001).
It is not likely that the absence of a significant relationship between taste intensity, including PROP, and FP density in the present study was solely a consequence of study meth-odology. A rigorous protocol was followed for the tongue imaging, FP identification and counting, and taste intensity measurements. Extensive training was conducted and peri-odic quality assurance checks were performed to ensure that deviations from protocol were not occurring (Cruickshanks et al. 2009). The gLMS was used to provide valid compari-sons across groups (Bartoshuk et al. 2004), and tastants were introduced in a standard order to minimize context effects. FP were counted within a 6-mm circle located at the tip of the tongue and adjacent to the midline. Previous research has shown that FP are most heavily located on the anterior tongue (Miller 1986) and that papillae density within a small area of the tongue tip provides a reliable estimate of the anterior tongue’s FP density (Shahbake et al. 2005).
We were able to measure the number of FP but not the num-ber of taste pores within each papilla. Because the density of
at National Chiao Tung University Library on April 24, 2014
http://chemse.oxfordjournals.org/
taste pores per gustatory papilla varies (Miller and Reedy 1990a), it is possible that some individuals with a high number of FP have a low number of taste pores per FP or even a large number of FP with no taste pores. However, in the previously cited study of taste pore density, it was observed that the indi-viduals with higher taste pore density had higher FP density and a greater number of taste pores per papillae (Miller and Reedy 1990a).Therefore, FP density probably serves as an adequate surrogate for taste pore and taste bud density.
Because taste buds reside on the FP, the density of these papillae may play an important role in taste functioning and health. In the present study, a number of factors were found to be related to the density of FP including age, gen-der, smoking, alcohol consumption, and solvent exposure. Although FP density was not found to be related to per-ceived intensity of suprathreshold concentrations of the 4 basic tastes or to PROP taster status, it is possible that FP density is associated with one or more of the many other aspects of taste. For example, the FP are innervated by the chorda tympani nerve (cranial nerve VII) and cranial nerve V (trigeminal nerve). The trigeminal nerve is associated with oral somatosensation including the sensations of tempera-ture, pain, irritation (from substances such as capsaicin and ethanol), pungency, texture, and creaminess (Duffy 2007). Some work has been done investigating the relationship between FP density and oral somatosensory measures such as the sensations of creaminess and fat (Hayes and Duffy 2008) and oral burn from alcohol (Duffy, Peterson, et al. 2004), but more information on the role of the density of fungiform and nonfungiform gustatory papillae in oral somatosensation is needed. In addition, further research into the effect of age, gender, smoking, alcohol consumption, and solvent exposure on the change in FP density over time will be beneficial in understanding the relationship between FP, taste, and health.
Funding
This work was supported by grants [R01AG021917] from the National Institute on Aging; National Eye Institute; and National Institute on Deafness and Other Communication Disorders and by an unrestricted grant from Research to Prevent Blindness (RPB).
Acknowledgements
The authors thank the participants for their continued commitment to the study. The content is solely the responsibility of the authors and does not necessarily reflect the official views of the National Institute on Aging or the National Institutes of Health.
References
Almasy L, Blangero J. 1998. Multipoint quantitative trait linkage analysis in general pedigrees. Am J Hum Genet. 62(5):1198–1211.
Bartoshuk LM, Duffy VB, Green BG, Hoffman HJ, Ko C-W, Lucchina LA, Marks LE, Snyder DJ, Weiffenbach JM. 2004. Valid across-group com-parisons with labeled scales: the gLMS versus magnitude matching. Physiol Behav. 82(1):109–114.
Bartoshuk LM, Duffy VB, Miller IJ. 1994. PTC/PROP tasting: anatomy, psy-chophysics, and sex effects. Physiol Behav. 56(6):1165–1171.
Cruickshanks KJ, Schubert CR, Snyder DJ, Bartoshuk LM, Huang G-H, Klein BEK, Klein R, Nieto FJ, Pankow JS, Tweed TS, et al. 2009. Measuring taste impairment in epidemiologic studies. The Beaver Dam Offspring Study. Ann N Y Acad Sci. 1170:543–552.
Cruickshanks KJ, Wiley TL, Tweed TS, Klein BEK, Klein R, Mares-Perlman JA, Nondahl DM. 1998. Prevalence of hearing loss in older adults in Beaver Dam, Wisconsin. The Epidemiology of Hearing Loss Study. Am J Epidemiol. 148(9):879–886.
Delwiche JF, Buletic Z, Breslin PAS. 2001. Relationship of papillae number to bitter intensity of quinine and PROP within and between individuals. Physiol Behav. 74(3):329–337.
Duffy VB. 2007. Variation in oral sensation: implications for diet and health. Curr Opin Gastroenterol. 23(2):171–177.
Duffy VB, Davidson AC, Kidd JR, Kidd KK, Speed WC, Pakstis AJ, Reed DR, Snyder DJ, Bartoshuk LM. 2004. Bitter receptor gene (TAS2R38), 6-n-propylthiouracil (PROP) bitterness and alcohol intake. Alcohol Clin Exp Res. 28(11):1629–1637.
Duffy VB, Hayes JE, Davidson AC, Kidd JR, Kidd KK, Bartoshuk LM. 2010. Vegetable intake in college-aged adults is explained by oral sensory phe-notypes and TAS2R38 genotype. Chemosens Percept. 3(3–4):137–148. Duffy VB, Peterson JM, Bartoshuk LM. 2004. Associations between
taste genetics, oral sensation and alcohol intake. Physiol Behav. 82(2–3):435–445.
Essick GK, Chopra A, Guest S, McGlone F. 2003. Lingual tactile acuity, taste perception, and the density and diameter of fungiform papillae in female subjects. Physiol Behav. 80(2–3):289–302.
Hayes JE, Bartoshuk LM, Kidd JR, Duffy VB. 2008. Supertasting and PROP bitterness depends on more than the TAS2R38 gene. Chem Senses. 33(3):255–265.
Hayes JE, Duffy VB. 2008. Oral sensory phenotype identifies level of sugar and fat required for maximal liking. Physiol Behav. 95(1–2):77–87. Just T, Pau HW, Witt M, Hummel T. 2006. Contact endoscopic
compari-son of morphology of human fungiform papillae of healthy subjects and patients with transected chorda tympani nerve. Laryngoscope. 116(7):1216–1222.
Keating BJ, Tischfield S, Murray SS, Bhangale T, Price TS, Glessner JT, Galver L, Barrett JC, Grant SFA, Farlow DN, et al. 2008. Concept, design and implementation of a cardiovascular gene-centric 50 K SNP array for large-scale genomic association studies. PLoS One. 3(10):e3583. Konstantinidis I, Chatziavramidis A, Printza A, Metaxas S, Constantinidis J.
2010. Effects of smoking on taste: assessment with contact endoscopy and taste strips. Laryngoscope. 120(10):1958–1963.
Kullaa-Mikkonen A, Koponen A, Seilonen A. 1987. Quantitative study of human fungiform papillae and taste buds: variation with aging and in dif-ferent morphological forms of the tongue. Gerodontics. 3(3):131–135. Miller IJ Jr. 1986. Variation in human fungiform taste bud densities among
regions and subjects. Anat Rec. 216(4):474–482.
Miller IJ Jr, Reedy FE Jr. 1990a. Quantification of fungiform papillae and taste pores in living human subjects. Chem Senses. 15(3):281–294. Miller IJ Jr, Reedy FE Jr. 1990b. Variations in human taste bud density and
taste intensity perception. Physiol Behav. 47(6):1213–1219.
at National Chiao Tung University Library on April 24, 2014
http://chemse.oxfordjournals.org/
Murphy C, Schubert CR, Cruickshanks KJ, Klein BE, Klein R, Nondahl DM. 2002. Prevalence of olfactory impairment in older adults. JAMA. 288(18):2307–2312.
Nagato T, Matsumoto K, Tanioka H, Kodama J, Toh H. 1995. Effect of denervation on morphogenesis of the rat fungiform papilla. Acta Anat (Basel). 153(4):301–309.
Pavlidis P, Gouveris H, Anogeianaki A, Koutsonikolas D, Anogianakis G, Kekes G. 2013. Age-related changes in electrogustometry thresholds, tongue tip vascularization, density, and form of the fungiform papillae in humans. Chem Senses. 38(1):35–43.
Purcell S, Neale B, Todd-Brown K, Thomas L, Ferreira MAR, Bender D, Maller J, Sklar P, deBakker PIW, Daly MJ, et al. 2007. PLINK: a tool set for whole-genome association and population-based linkage analyses. Am J Hum Genet. 81(3):559–575. http://pngu.mgh.harvard.edu/purcell/plink/. Raynor LA, Pankow JS, Cruickshanks KJ, Schubert CR, Miller MB,
Klein R, Huang G-H. 2010. Familial aggregation of olfactory impairment and odor identification in older adults. Laryngoscope. 120(8):1614–1618.
Schubert CR, Cruickshanks KJ, Fischer ME, Huang G-H, Klein BEK, Klein R, Pankow JS, Nondahl DM. 2012. Olfactory impairment in an adult population: the Beaver Dam Offspring Study. Chem Senses. 37(4):325–334.
Schubert CR, Cruickshanks KJ, Murphy C, Huang G-H, Klein BEK, Klein R, Nieto FJ, Pankow JS, Tweed TS. 2009. Olfactory impairment in adults: the Beaver Dam experience. Ann N Y Acad Sci. 1170:531–536.
Shahbake M, Hutchinson I, Laing DG, Jinks AL. 2005. Rapid quantitative assessment of fungiform papillae density in the human tongue. Brain Res. 1052(2):196–201.
Tepper BJ, Nurse RJ. 1997. Fat perception is related to PROP taster status. Physiol Behav. 61(6):949–954.
Yackinous C, Guinard J-X. 2001. Relation between PROP taster status and fat perception, touch, and olfaction. Physiol Behav. 72(3):427–437. Yeomans MR, Tepper BJ, Rietzschel J, Prescott J. 2007. Human hedonic
responses to sweetness: role of taste genetics and anatomy. Physiol Behav. 91(2–3):264–273.
Zhan W, Cruickshanks KJ, Klein BEK, Klein R, Huang GH, Pankow JS, Gangnon RE, Tweed TS. 2010. Generational differences in the prevalence of hearing impairment in older adults. Am J Epidemiol. 171(2):260–266.
Zhang GH, Zhang HY, Wang XF, Zhan YH, Deng SP, Qin YM. 2009. The relationship between fungiform papillae density and detec-tion threshold for sucrose in the young males. Chem Senses. 34(1):93–99.
Zuniga JR, Chen N, Phillips CL. 1997. Chemosensory and somatosensory regeneration after lingual nerve repair in humans. J Oral Maxillofac Surg. 55(1):2–13.
Zuniga JR, Davis SH, Englehardt RA, Miller IJ Jr, Schiffman SS, Phillips C. 1993. Taste performance on the anterior human tongue varies with fungiform taste bud density. Chem Senses. 18(5):449–460.
at National Chiao Tung University Library on April 24, 2014
http://chemse.oxfordjournals.org/