The Economic Impact of China-Taiwan Ferry-Cruise Traffic
全文
數據
相關文件
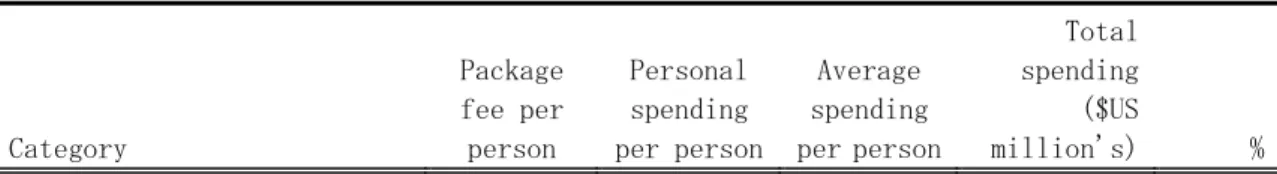
4- Per-capita non-shopping spending (excluding gaming expenses) of interviewed visitors by place of residence. 5- Per-capita shopping spending of interviewed visitors by
With regard to the spending structure, visitors from Mainland China spent 63% of their per- capita spending on shopping, whereas those from Hong Kong and Taiwan, China spent 79% and
Table 12 : Sampling errors of per-capita shopping spending of interviewed visitors by place of residence and type of expense. Table 13 : Interviewed visitors’ comments on services
Total spending and per-capita spending of visitors for the fourth quarter of 2011 were extrapolated from 39,900 effective questionnaires collected; besides, data for the fourth
Total spending and per-capita spending of visitors for the third quarter of 2011 were extrapolated from 47,300 effective questionnaires collected; besides, data for the third
With regard to spending structure, visitors from Mainland China spent 61% of their per- capita spending on shopping, whereas those from Hong Kong and Taiwan, China spent 78% and 71%
Table 12 : Sampling errors of per-capita shopping spending of interviewed visitors, by place of residence and type of expense. Table 13 : Interviewed visitors’ comments on
Table 1: Characteristics of interviewed visitors, by place of residence Table 2: Average length of stay of interviewed visitors, by place of residence Table 3: Per-capita spending
