~
Pergamon
PII: S0043-1354(96)00068-1
War. Res. Vol. 30, No. 8, pp. 1924-1929, 1996 Copyright © 1996 Elsevier Science Ltd Printed in Great Britain. All rights reserved 0043-1354/96 $15.00 + 0.00
T E C H N I C A L N O T E
A U T O M A T I C C O N T R O L F O R C H E M I C A L D O S I N G IN
L A B O R A T O R Y - S C A L E C O A G U L A T I O N PROCESS BY
U S I N G A N O P T I C A L M O N I T O R
C H I H P I N H U A N G *@ and C H I - B I N G L I UInstitute of Environmental Engineering, National Chiao Tung University, Hsinchu, Taiwan 30039, ROC
(First received July 1995" accepted in revised Jorm February 1996)
Abstract--The feasibility of applying an optical monitor in the automatic control of coagulation was assessed in this study. Prior to simulation testing, a series of batch tests was performed to determine the optimum state of dosing corresponding to the monitor's output. The results indicate that floc density decreased as floc size increased under the same coagulant dosage. Moreover, ratio output of the monitor could provide an index for evaluating the change trend of floc size in flocculation and for predicting the potential of floc settling.
An automatic control system was designed and connected to a laboratory-scale water treatment process. A computer in the automatic control system received all the ratio values with respect to the progressive dosing. After determining the dosage, the system terminated the function of control. This control system started performing a new test for determining another optimum dosage when the fluctuation of inflow turbidity was more than a designated value. Simulation tests demonstrated that the PDA monitor with a designed control system could be successfully applied in the on-line control of coagulation dosing. The recommended control parameters for the control system was also identified. Copyright © 1996 Elsevier Science Ltd
Key words--alum, coagulation, photometric dispersion analyzer, automatic control
I N T R O D U C T I O N
M a n y water treatment plants in Taiwan determine coagulant dosages simply on the basis of the operators' experience or periodic jar-test results. However, excess development in the proximity of water sources has subsequently resulted in a high concentration o f suspended solids in rivers, lakes, and reservoirs. The water turbidities may vary from 10 N T U to thousands of N T U in a few hours when heavy rainfall occurs within the area of an upstream watershed. The influent turbidities and, subsequently the coagulant demands are quite time-variant. Therefore, recent attempts to determine the chemical dosage in coagulation process has frequently failed to adapt to the turbidities variation in the plant's influent, such as delayed j u d g m e n t or inattention during off-duty hours at night. Such an occurrence would result in inefficient settling as well as shortening the filtration run. Ultimately, the treated water quality may fail to satisfy increasingly stringent treatment requirements.
A photometric dispersion analyzer (PDA) is a fiber-optical monitor, which is based on the
*Author to whom all correspondence should be addressed. Fax: +886 35 725958.
measurement of fluctuations in the intensity of light transmitted through a flowing suspension (Gregory and Nelson, 1986). The fluctuations arising from r a n d o m variations with the mean number of particles in the sample follow the Poisson distribution. Moreover, root-mean-square (rms) value of the intensity fluctuations depends on the scattering coefficient and the square root of the concentration (Gregory, 1985). By P D A monitor, the aggregation or disaggregation in the suspension can be quantified with respect to the ratio of V~ms to dc (termed as ratio) by measuring the rms value o f the fluctuation signal (Vrms) and the average transmitted light intensity (d¢). Eisenlauer and H o r n (1985) have applied the fiber-optical technique to monitor the turbidity fluctuations of flowing suspension coagulated by FeC13. Gregory (1985, 1987) has indicated that when the particles are aggregated, the root-mean-square of the fluctuation o f light intensity increases. Jackson and T o m l i n s o n (1986) have suggested that P D A technique is a feasible m e t h o d for determining the coagulant dosage a m o n g several methods. P D A was first installed on-line to automatically monitor the continuously flowing process stream by Eisenlauer and H o r n (1987). The Vrms/V output of an optical
m o n i t o r has been regarded as an index to evaluate floc size and settling velocity (Matsui and T a m b o ,
Technical Note 1925 1991) and monitor microbial floc formation
(Whittington and George, 1991). Matsui et al. (1993) have placed another function in optical monitor, using infrared ray and ultraviolet ray as a dual wavelength light to amend the error of light intensity absorbed by dissolved substances and measure the residual color. Recently, Ching et al. (1994) have employed the PDA monitoring technique in the dynamics of coagulation.
In this work, the optical monitoring technique is evaluated and refined while considering the turbidity variation for the sake of developing plant-operation information. In addition, an automatic control system with optical monitor is designed to be used in connection with a laboratory-scale water treatment (LWT) process. Laboratory simulation of full-scale coagulation/sedimentation involves assessing the feasibility of an optical monitor system in determin- ing an optimal dosage under different conditions of turbid waters with an acceptable time-delay and establishing control parameters for the system.
MATERIALS AND M E T H O D S
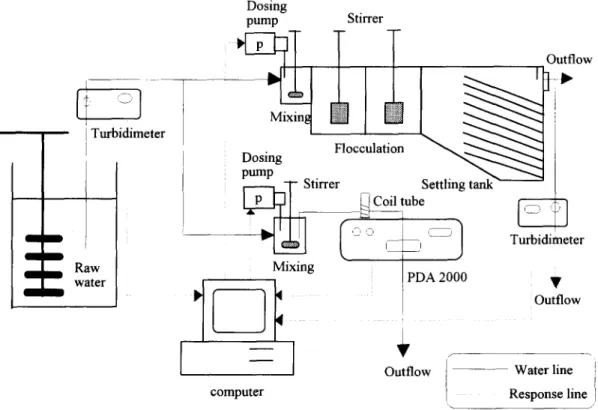
A given amount of bentonite in powder form (Hayashi Pure Chemical Industries) was added in tap water (ionic strength-3 × 10 _3 N, total alkalinity-29 mg/l as CaCO3)
to prepare a test suspension with desired turbidity. A laboratory-scale water treatment (LWT) system consisting of a rapid-mixing unit, two slow-mixing units (flocculation), and settler is schematically shown in Fig. 1. The rapid-mixing rate was 200rpm (G = 468/s) and slow-mixing rate was 60 rpm (Gt = 24,854). The settling
tank was designed as a sloped plate settler. Simulated source waters were pumped at the rate of 0.5 L/min into the LWT system. The turbidities of inflow to and outflow from the system were measured by flow-through turbidmeters. The pH value of the outflow was also monitored by a pH meter (Schott CG-841, German). A branch parallel to the LWT system is the PDA control system, which also included the same rapid-mixing tank. In this tank, source water was mixed with alum and then siphoned to the flow-through detector of PDA. Both PDA and turbidmeters were connected to the computer. In the PDA control system, coagulant dosing was increased stepwise (termed as "progressive dosing") while the corresponding ratio value was monitored and recorded with a 1-minute delay. Each step of progressive dosing was designated at 1%, 2% or 5% of pumping rate on the basis of experimental requirement. Each percentage of pumping rate corresponded to 0.27 mg/L as A1203 of alum dosage. As the ratio value became lower than the previous ratio value, the control program took previous dosage as optimal dosage and the coagulant pump of pilot plant was fixed at that dosage. Following the determination of an optimal dosage, the computer would control the dosing pump in LWT. Optimum dosing was usually achieved in 5 10 min and thereafter the dosing pump in PDA system was shut off and PDA discontinued the function of monitoring. The PDA system would start performing a new test for another optimal dosage when the fluctuation of inflow turbidity was more than a designated value. In this experiment, the designated value was set to be equivalent to 10 NTU.
RESULTS AND DISCUSSION
Results obtained from a series of batch exper- iments verify PDA is an effective tool in evaluating the state of particle aggregation; in addition, ratio
[ Turbidimeter Raw water Dosing pump Stirrer ~ M i ~ ; I I I ~ ~ , ~ O u t f l ° w l ~1~ Dosing Flocculation pump Settling tank 2 tirrer ~ Coil tube
(,z,,~ ~ ' , ~ ] Turbidineter
Mixing ~ P D A 2000 •
ii
out ow
" V r
Outflow Water line
computer [ Response line
1926
Technical Note
200~
180 160 140 120 • - 100 80 - - F i r s t Second{ ! t 60 / I, 10 20 30 40 50 60 70 80 90 1002;;
~ ' 1 8 0i t
Z 160 First Second i~
140120
100~
6o
0 10 20 30 40 50 60 70 80 90 10C 8.5 8 io " 7.5 o ~ 7 0 6.5 - - First Secon iI
I
6 L 0 10 20 30 40 50 60 70 80 90 1006
5
~4
2 1 0 - - F i r s t Second/
J10(
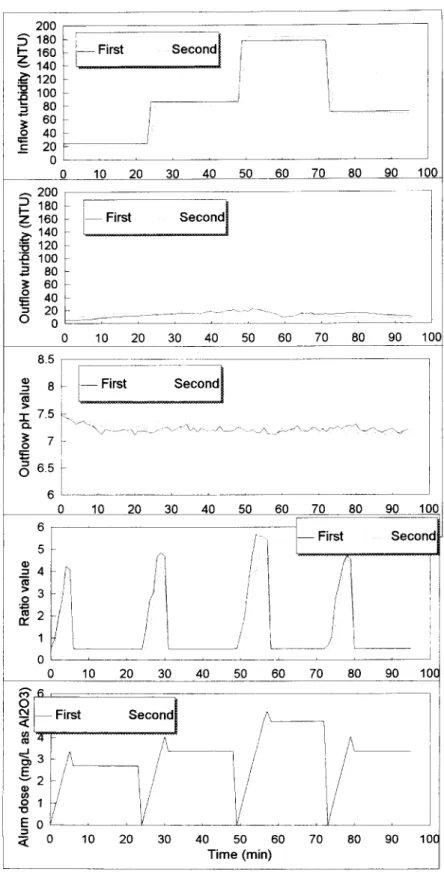
0 10 20 30 40 50 60 70 80 90 ' 6 , F i r . Sec°ndl E o L 0 10 20 30 40 50 60 Time (min) 70 80 90 10(Fig. 2. Simulation results of the automatic control for the fluctuation of inflow turbidity ranging from
20 to 200 NTU. The test has been run in duplicate.
Technical Note 1927
._.2000 I
1800
1600
Z14oo
1200
~ 1 0 0 0
i~ 800
600
400
== 200
- - 00
/
/
10
20
30
40
50
60
70
80
90
100
5"2oo
.•@180
160
140
"~ 120
100
~ 80
o 60 ~ 40~ 20
0 8 . 5 = • ", 8 1"1" 7.5
7
0 ~ 6.5 6 010
9
8
~ 6
5 3 2 1 0 011
10
9
8
7
6
5
4
2 1 0 00
10
20
30
40
50
60
70
80
90
100
10
20
30
40
50
60
70
80
90
100
f
10
20
30
40
50
60
70
80
90
100
_ _10
20
30
40
50
60
70
80
90
100
Time (min)
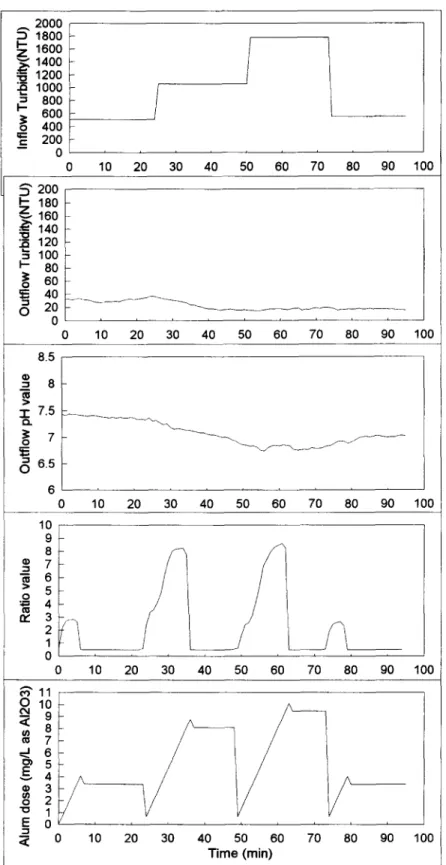
Fig. 3. Simulation results o f the automatic control for the fluctuation o f inflow turbidity ranging from 500 to 2000 N T U .
1928 Technical Note _o
==
O 2000 !~ 1 8 o o
~
1600 140012oo
1000 ~- -~ 800 -f
_ 400200
0 5% dose - - 1% dose i [ - - 20/0 dose ... [,f
'
_ _ /
/ 20 40 60 80 100 120 140 160 180 20O~ 16o I
140 ~ 1 2 0 ~ 100~
ao
~ 60 200J
O~= 40~
o
2o~
0 > O 2O 5% dose - 1% dose] - - 2% dose 40 60 80 100 1_20 140 160 180 200 ]1 . . . ~- 5% dose - - 1 % dose~ f - - 2% dose _ j '/
8.58i
6.5 i 6 ' 20 40 60 80 100 120 140 160 180 200 10 8 6 4 2 ~oL
[ I 5% dose - - - 1% dose I - - 2% dose _J
20 40 60 80 100 120 140 160 180 200 12o
.~ 8 i 5% dose - - 1% dose l - - 2 % dose~ 6 ~
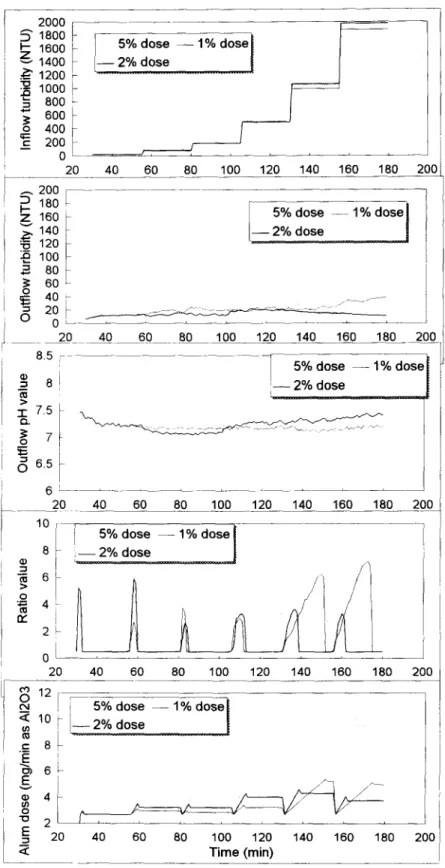
~ 220 40 60 80 100 120 140 160 180 200 Time (min)Fig. 4. Simulation results of the automatic control for the fluctuation of inflow turbidity ranging from 20 to 2000 NTU with 1%, 2% and 5% intervals for the progressive dosing rate.
Technical Note 1929
output can be regarded as an index in determining the optimal dosage. Simulated operation in coagulation and sedimentation process involves a PDA system to determine the optimum dosage and test its feasibility in full plant operations. Figure 2 is the simulation result of the automatic control for the fluctuation of inflow turbidity ranging from 20 to 200 NTU. The test has been run in duplicate. The changes of inflow/outflow turbidity, pH value, ratio value, and alum dosage with the course of simulated operation are included in this figure. As designed, the fluctuation of inflow turbidity is more than a designated value (10 NTU), and PDA monitor will start the function. The change of ratio values with the progressive dosage has determined an optimum dosage. These optimal dosages are 2.70, 4.05, and 4.73 mg/min as A1203, respectively, for 20, 80, and 200 N T U of inflow turbidity. The optimum dosage increases with inflow turbidity. With these dosages, the outflow turbidity is maintained below 20 NTU, thereby exhibiting good turbidity removal in the simulated operation. The delay time required to determine an optimal dosage extends from 5 to 10 minutes, depending on the inflow turbidity. The PDA system is also used to monitor the source water with high turbidities ranging from 500 to 2000. Also, 5-10 min are necessary to determine optimum dosage in which a credible result can be obtained at the high turbidity condition (Fig. 3).
The dosing pump rate was initially designated to be 5% for each step in the progressive dosing. Results in this study demonstrate that the required dosing rate of the pump is at least 2 0 0 to treat turbid water ranging from 20 N T U to 2000 NTU. Moreover, the time delay caused by the progressive dosing can be shortened by adjusting the dosing rate of pump to start with 20% from the beginning of the progressive dosing. According to the results from the simulated operation, 5% interval for the progressive dosing may cause an over approximation for the optimum dosage. Therefore, each step for the progressive dosing has been adjusted to be 1% or 2%. Simulation results of operation with 1% and 2% dosing are shown in Fig. 4. A comparison with the result of 5% dosing in this figure reveals that the optimum dosage for the range of 20-200 N T U (as determined by three progressive rates) is in the orders of 5% > 2% >_ 1%. In the range 500-2000 NTU, the optimum dosage determined by 1% progressive rate is the highest, and 2% is the lowest. The pH value of outflow are all between 7 and 7.5. Those same results indicates that the high and stable efficiency of turbidity removal occurs at the 2% interval of progressive dosing in the PDA control system. Therefore, in the light of
efficiency and economy, the recommended dosing interval is 2%.
CONCLUSIONS
An automatic control system has been successfully applied in a laboratory-scale water treatment process. In the simulation operation test, the PDA monitor system can determine an optimal coagulant dosage for different turbidity fluctuations of inflow of about 5-10 minutes. As designed, the fluctuation of inflow turbidity is more than a designated value (10 NTU), i.e., the PDA monitor will re-start the function. The change of ratio values with the progressive dosage can determine an optimal dosage, thereby creating good coagulation efficiency. In the range 500-2000 NTU, the high and stable efficiency of turbidity removal and the savings of coagulant occurs at the 2% interval of progressive dosing in the PDA control system. Therefore, from the perspective of efficiency and economy, the recommended dosing interval is 2%. The operation parameters of this PDA monitor system are suggested at 20% of the initial dosing rate and 2% of the interval for the progressive dosing rate.
Acknowledgernent--This work is fully supported by the grant of National Science Council, ROC (NSC-83-0410-E- 009-027).
REFERENCES
Ching H. W., Tanaka T. and Elimelech M. (1994) Dynamic of coagulation of clay particles with ferric chloride. Wat.
Res. 28, 559-569.
Eisenlauer J. and Horn D. (1985) Fiber-optic sensor for flocculant dose control in flowing suspension. Colloids
and Surfaces 14, 121-134.
Eisenlauer J. and Horn D. (1987) Fiber-optic on-line flocculant dose control in water treatment operations.
Colloids and Surfaces 25, 111-129.
Gregory J. (1985) Turbidity fluctuations in flowing suspension. J. Colloid Interface Sci. 105, 357-372. Gregory J. (1987) Laminar dispersion and the monitoring of
flocculation processes. J. Colloids Interface Sci. 118, 297-409.
Gregory J. and Nelson W. D. (1986) Monitoring of aggregates in flowing suspension. Colloids and Surfaces 18, 175-188.
Jackson P. J. and Tomlinson E. J. (1986) Automatic coagulation control evaluation of strategies and tech- niques. War. Supply 4, 55~67.
Matsui Y. and Tambo N. (1991) Online ftoc size evaluation by photometric disperion analyzer. War. Supply 9, 71-78. Matsui Y., Ohto T., Tambo N. and Zaitsu Y. (1993) Dual wavelength photometric dispersion analyzer of coagu- lation and ftocculation. War. Sci. Tech. 27, 153-165. Whittington P. N. and George N. (1991) The use of laminar
tube flow apparatus for optimizing chemical and hydrodynamic conditions for microbial floc formation.