國 立 交 通 大 學
資訊科學與工程研究所
碩 士 論 文
適用於視訊多點傳播技術上之無比率編碼機制中短碼長
LT
碼客製化
Customization of Short-Length LT Codes for Rateless
Coding Schemes Used in Video Multicasting
研 究 生: 王柏崴
指導教授: 邵家健 教授
適用於視訊多點傳播技術上之無比率編碼機制中短碼長
LT
碼客製化
Customization of Short-Length LT Codes for Rateless
Coding Schemes Used in Video Multicasting
研 究 生:王柏崴
Student: Bo-Wei Wang
指導教授:邵家健
Advisor: Dr. John Kar-kin Zao
國 立 交 通 大 學
資訊科學與工程研究所
碩 士 論 文
A Thesis
Submitted to Institute of Computer Science and Engineering College of Computer Science
National Chiao Tung University in partial Fulfillment of the Requirements
for the Degree of Master
in
Computer Science
July 2014
Hsinchu, Taiwan, Republic of China
i
適用於視訊多點傳播技術上之無比率編碼機制中短碼長
LT
碼客製化
學生:王柏崴
指導教授: 邵家健 博士
國立交通大學資訊科學與工程研究所碩士班
中文論文摘要
由於短碼長 LT 碼的解碼行為表現不能藉漸近分析推導,我們研究團隊提出一種以 創新的效能評估模型搭配最先進的隨機搜索算法的方式使短碼長 LT 碼的表現能客製化。 而在此研究中,我們的目標是提出一套使用原則讓不同視訊應用下的無比率編碼機制皆 可採用這短碼長 LT 碼客製化技術找到合適的短碼長 LT 碼。 我們各別針對高階視訊編碼及可調式視訊編碼設計了一個複合碼以說明我們如何 根據前置碼的解碼表現及測試影片的位元率-失真特性決定短碼長 LT 後置碼該以什麼目 標需求客製化。ii
Customization of Short-Length LT Codes for Rateless
Coding Schemes Used in Video Multicasting
Student: Bo-Wei Wang
Advisor: Dr. John Kar-kin Zao
Institute of Computer Science and Engineering College of Computer Science
National Chiao Tung University
Abstract
Based on the fact that the decoding performance behavior of Short-Length LT (SLLT) codes cannot be deduced by the asymptotic analysis, our research team proposed a method that employs a novel performance measurement model and state-of-the-art randomized search algorithm in order to customize the performance of these codes. In this study, our objective is to propose the guideline how to employ the SLLT code customization method to find suitable SLLT codes in rateless coding schemes for different video applications.
In order to demonstrate the way how to derive the target performance requirements of customized SLLT post-codes from the decoding performance behavior of corresponding pre-codes and the rate-distortion characteristics of the test video clips, we designed two examples consisting in constructing composite codes suitable for H.264/Advanced Video Coding (AVC) and H.264/ Scalable Video Coding (SVC).
iii
Table of Contents
中文論文摘要 ... i
Abstract ... ii
Table of Contents ... iii
List of Figures ... iv List of Tables ... v Chapter 1. Introduction ... 1 1.1. Objectives ... 1 1.2. Research Approach ... 1 1.3. Thesis Outline ... 2 Chapter 2. Backgrounds ... 3 2.1. LT Codes ... 3
2.2. Customization of SLLT Codes using Evolutionary Strategies ... 5
Chapter 3. Design of Short-Length Raptor Code for AVC Multicasting ... 8
3.1. Choice of a Pre-code ... 8
3.2. Design of a Rateless Post-code ... 9
3.3. Experiment Results ... 10
Chapter 4. Design of a Rateless UEP Code for SVC/MGS Multicasting ... 15
4.1. Choice of a UEP Pre-code... 15
4.2. Design of a Rateless Post-code ... 17
4.3. Matching the Rateless Post-code with chosen UEP Pre-code ... 23
4.4. Experiment Results ... 24
Chapter 5. Conclusion ... 28
5.1. Achievements ... 28
5.2. Future Work ... 28
iv
List of Figures
Figure 1 Decoding process of LT codes ... 4
Figure 2 Example of mapping two target points from the -space into a goal point in the objective space ... 7
Figure 3 Decoding performance of LDPC pre-code in random bitstream ... 8
Figure 4 Decoding performance comparison of three different SLLT post-codes ... 11
Figure 5 Decoding performance comparison of raptor codes employing three different SLLT post-codes ... 12
Figure 6 Difference of PSNR values of raptor codes employing the post-code (c) and (a) ... 13
Figure 7 Difference of PSNR values of raptor codes employing the post-code (c) and (b) ... 14
Figure 8 Decoding performance of convolutional UEP pre-code... 16
Figure 9 Estimated symbol failure rate distribution ... 18
Figure 10 Average failure rates sufficient for decoding of the base layer ... 21
Figure 11 Functional blocks of rateless convolutional UEP encoder ... 23
Figure 12 Decoding performance of two candidate SLLT post-codes ... 25
Figure 13 Bit failure rate of candidate rateless UEP codes ... 26
Figure 14 Playback PSNR probabilities of SVC/MGS bitstreams protected by candidate rateless UEP codes ... 27
v
List of Tables
Table 1 Target Points Specification for SLLT Post-Code employed in short-length Raptor code ... 9 Table 2 UEP Convolutional Pre-code and Puncturing Specification... 16 Table 3 Median (top) and Mean (bottom) Aspect of PSNR Improvement in Base Layer (Foreman) ... 19 Table 4 Median (top) and Mean (bottom) Aspect of PSNR Improvement in Enhancement Layer1
(Foreman) ... 19 Table 5 Median (top) and Mean (bottom) Aspect of PSNR Improvement in Enhancement Layer2
(Foreman) ... 20 Table 6 Target Points Specification for SLLT Post-Code employed in rateless UEP code ... 22
1
Chapter 1. Introduction
1.1. Objectives
Short-length Luby Transform (SLLT) codes are used widely in wireless multimedia multicasting since their rateless property can provide robust erasure protection under various channel erasure conditions and their low coding complexity make them suitable for real-time transport. However, the performance behaviors of SLLT codes cannot be deduced by asymptotic analysis. To tackle this drawback, our research team proposed a method for customizing the decoding performance of SLLT codes using evolution strategies. In this thesis, we apply proposed SLLT code customization method to two practical video applications and show that proposed method is able to design suitable SLLT codes for different rateless coding schemes, regardless of the channel erasure rates. The main objective of this thesis is to show a reader the way how to specify the performance requirements imposed on the customized SLLT codes suitable for specific applications.
1.2. Research Approach
In this thesis, we aimed to design two composite codes employing SLLT post-codes with customized decoding performance behavior:
1. Short-length Raptor code for H.264/Advanced Video Coding (AVC)
2. Rateless code with Unequal Erasure Protection (UEP) for H.264/ Scalable Video Coding (SVC)
The customization criteria imposed on the SLLT post-codes were derived according to the decoding performance behavior of corresponding pre-codes and the rate-distortion characteristics of the test video clips.
2
1.3. Thesis Outline
In Chapter 2, we provide the background of the LT codes and description of the proposed SLLT code customization method. Chapter 3 explains the design of short-length raptor code for H.264/ AVC, whereas, Chapter 4 describes the construction of rateless code with Unequal Erasure Protection (UEP) for H.264 SVC/MGS. Finally, our accomplishments and future work are highlighted in Chapter 5.
3
Chapter 2. Backgrounds
2.1. LT Codes
Luby transform codes (LT codes) [1] are the first implementation of fountain codes. Using these codes, the number of encoded symbols that can be generated from the source symbols is potentially limitless. This makes every receiver with different channel loss rate served simultaneously by a sender able to get sufficient packets to recover the message. They are also called near-optimal erasure codes since the decoder can recover all k source symbols from any k(1 + ) encoded symbols with nearly the minimal overhead .
One of the important application areas for SLLT codes is multi-point multimedia streaming [2]. This is because the receivers with different bandwidth and transport latency can experience better playback quality simply by capturing more encoded symbols and the video providers do not have to take into account the channel conditions of individual receivers.
2.1.1. Encoding
An encoded symbol is produced by the following process:
1. Determine the degree 𝑑 of the encoded symbol according to the given degree distribution.
2. Choose uniformly at random 𝑑 distinct input symbols.
3. The encoded symbol is produced by performing bitwise exclusive-or on the all 𝑑 input symbols.
4
2.1.2. Decoding
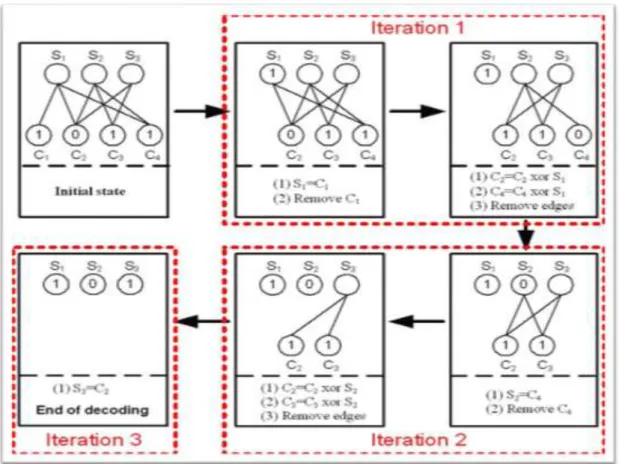
We can translate the relationship between encoded symbols 𝑐𝑖 and source symbols 𝑠𝑖
into the bipartite graph as shown in Figure 1. First, all encoded symbols with only one edge directly recover their unique source symbol 𝑠𝑖. The decoded source symbol 𝑠𝑖 then
propagates the information to all the connected encoded symbols so that these encoded symbols can cut the edges to 𝑠𝑖 and update their values by performing bitwise exclusive-or
with 𝑠𝑖. The decoding process iterates until there are encoded symbols with only one edge.
Figure 1 Decoding process of LT codes 2.1.3. Degree Distribution
The degree distribution of an SLLT code is a discrete probability function which defines the way how the degrees of encoded symbols are chosen. We know that encoded symbols with low degrees are necessary at the beginning of the decoding process. On the contrary, encoded symbols with high degrees are useful to recover the source symbols near the end of
5
the decoding process; however, they increase the average number of XOR operations used in the encoding and decoding process. Hence, the degree distribution affects not only the decoding performance of LT codes but also the coding complexity.
2.2. Customization of SLLT Codes using Evolutionary
Strategies
Since the degree of an encoded symbol is determined according to the adopted degree distribution and the selection of the source symbols during the encoding process is uniformly random, the decoding performance of SLLT codes is solely determined by the number of source symbols and the degree distribution of encoded symbols. Besides, we assume that the number of source symbols is application-dependent, and hence, always defined by user, the decision variables of an SLLT code customization problem consist only of degrees and probabilities of the adopted degree distribution.
Based on the fact that the customization of SLLT codes is a non-convex, non-separable, continuous optimization problem with large number of decision variables, noisy fitness function evaluation and multiple local optima, we had to employ a search method able to cope with these characteristics in order to find SLLT codes with customized decoding performance. In our experiments, we chose to adopt the Covariance Matrix Adaptation Evolution Strategy (CMA-ES) [3] because it is a state-of-the-art randomized search method that has been proven to be successful on problems with all the above listed characteristics.
2.2.1. Statistical measurements of SLLT code perbformance
Hyytiä et al. [4 ] aimed to minimize one of the two conventional performance measurements: (1) average decoding failure rate when certain decoding overhead is received, and (2) average decoding overhead at certain constant failure rate (usually zero failure rate).
6
But these performance measurements are not sufficient, since different applications require the performance of the SLLT codes to be customized in different fashion and the bi-modal feature of the SLLT code decoding performance statistics.
To face this challenge, Diao [5] devised a novel performance model based on three performance measurements:
1. Decoding overhead {𝜀 | 𝜀 ≥ 0}: Ratio between the number of extra encoded symbols received and the number of source symbols
2. Decoding failure rate { 𝑟| 0 ≤ 𝑟 ≤ 1}: Fraction of the unrecovered source symbols 3. Tail probability of specific failure rate at specific decoding overhead {𝑇 =
[𝑃𝑟(𝑟(𝜀̂) > 𝑟̂)]}: Probability that the decoding failure rate is higher than the fixed threshold value 𝑟̂ when the code is decoded with an overhead 𝜀̂.
Among performance measurements, everyone can be considered the customization objective.
2.2.2. Goal Programming
Based on the statistical performance measurements 𝜀 , 𝑟 and 𝑇 defined in the Section 2.2.1, an user can customize the decoding performance of an SLLT code by coercing it to meet one or more performance criteria specified in terms of these measurements. In case of multiple criteria, the SLLT code customization can be viewed as a multi-objective optimization problem, since different decoding performance criteria are usually in a conflict.
The result of a multi-objective optimization problem is a set of Pareto-optimal solutions, in which all the members must be considered equally good if no additional preference information is available. In order to design an SLLT code customization method able to properly exploit the trade-off between different objectives among the members of the Pareto set, we employed a multi-objective optimization technique called goal programming [6] minimizing the weighted distance between the actual and target performance of given
7
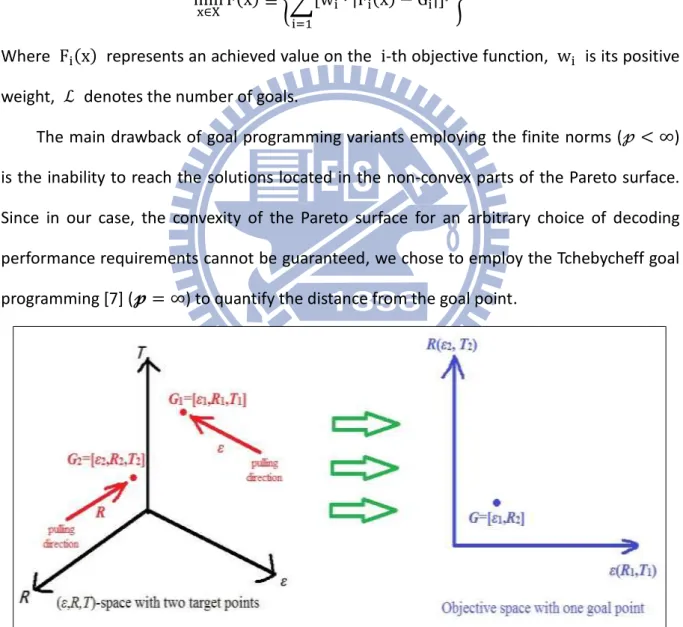
SLLT code. In order to be able to employ the goal programming, we translated the s target points of the SLLT customization problem defined in the (𝜀 𝑟 𝑇)-space into one goal point defined in the s-dimensional objective space [Figure 2].
In goal programming, target point is expressed in a form of a set of goals 𝐺𝑖, i.e. a goal
point. The distance from the goal point is measured in the objective space based on a weighted 𝓅-norm. min x∈X F(x) ≜ {∑[wi⋅ |Fi(x) − Gi|] 𝓅 ℒ i=1 } 1 𝓅⁄
Where Fi(x) represents an achieved value on the i-th objective function, wi is its positive
weight, ℒ denotes the number of goals.
The main drawback of goal programming variants employing the finite norms (𝓅 < ∞) is the inability to reach the solutions located in the non-convex parts of the Pareto surface. Since in our case, the convexity of the Pareto surface for an arbitrary choice of decoding performance requirements cannot be guaranteed, we chose to employ the Tchebycheff goal programming [7] (𝓹 = ∞) to quantify the distance from the goal point.
Figure 2 Example of mapping two target points from the (𝛆 𝐫 𝐓)-space into a goal point in the objective space
8
Chapter 3. Design of Short-Length Raptor
Code for AVC Multicasting
When the block length of LT codes is short, the error floor region of the decoding performance is located always at the relatively high overhead. In order to achieve high coding efficiency, we employ the Raptor codes [8] coding scheme able to protect the AVC bit-streams. As long as the failure rate is below certain level, the built-in redundancy of the pre-code used in raptor codes is able to recover erased source symbols allowing the SLLT post-code to be effective at the range of lower overhead. In this chapter, we implement a short-length raptor code in which the SLLT post-code is customized to match the decoding performance of chosen pre-code.
3.1. Choice of a Pre-code
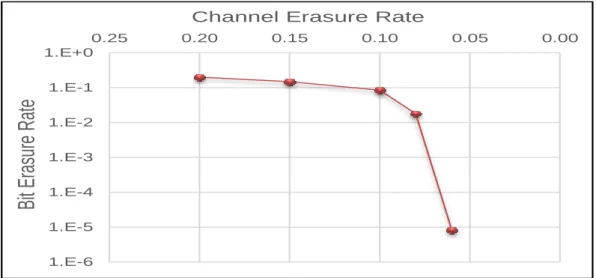
We chose to employ the Low-density parity-check (LDPC) code as the pre-code since it can provide high rate when the code length K is short.
Particularly, we employed the 1998.5.3.1392 code with rate equal to 0.889 when K = 1998, provided by MacKay in its database of sparse graph codes [9].
Figure 3 Decoding performance of LDPC pre-code in random bitstream 1.E-6 1.E-5 1.E-4 1.E-3 1.E-2 1.E-1 1.E+0 0.00 0.05 0.10 0.15 0.20 0.25
Bi
t E
ras
ure
Rate
9
3.2. Design of a Rateless Post-code
When designing the rateless post-code, we first specified the requirements imposed on the its decoding performance based on the properties of employed pre-code. Consequently, we translated these requirements into the target points in the (𝛆 𝐫 𝐓)-space.
With the aid of the pre-code, the SLLT post-code itself does not need to recover all the source symbols. In other words, it is not necessary to minimize its decoding failure rate, anymore. On the other hand, the users should be more concerned about the delay, in which they can receive the video in reasonable good quality and the amount of bandwidth that the video streaming will need. Hence, SLLT post-code should meet the following requirements:
(1) Reaching the failure rate allowing the pre-code to recover all source symbols at the minimum overhead.
(2) Minimum probability of exceeding the capacity of pre-code after receiving certain moderate decoding overhead in order to ensure that users will always have full playback quality after receiving sufficient amount of encoded symbols.
We consider the sufficiently low violation probability to be 0.01 and the moderate level of decoding overhead to be 10%, whereas, the value of the acceptable failure rate depends completely on the choice of the employed pre-code.
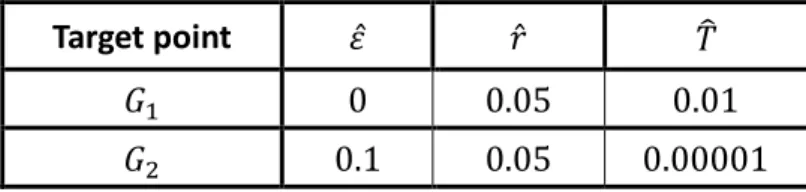
According to our simulations in the random erasure channel [Figure 3], the chosen LDPC code is able to recover all symbols as long as the channel erasure rate does not exceed 5%. Hence, we translated the defined performance requirements into two target points: 𝐺1and
𝐺2 [Table 1]; and consequently aimed at approaching them along the coordinate directions 𝜀 and 𝑇, respectively.
Table 1 Target Points Specification for SLLT Post-Code employed in the short-length raptor code
Target point 𝜀̂ 𝑟̂ 𝑇̂
𝐺1 0 0.05 0.01
10
3.3. Experiment Results
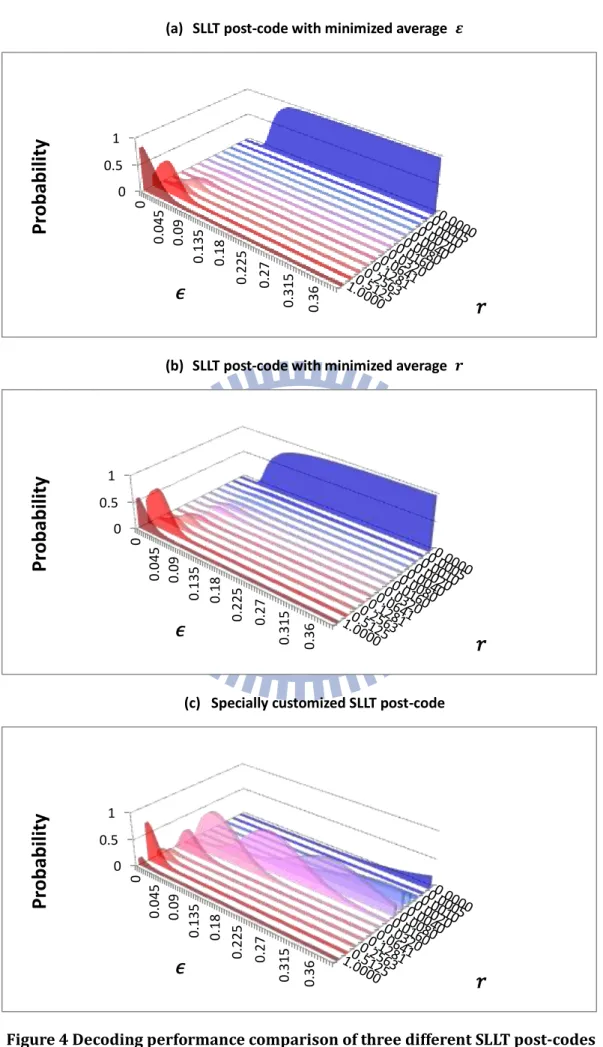
In this section, we compare the SLLT post-code customized to match the characteristics of chosen LDPC pre-code with two SLLT post-codes optimized by using conventional objectives. In the Figure 4, the SLLT post-code (a) has minimized average overhead for the lossless decoding; the optimized objective for SLLT post-code (b) is to minimize the average failure rate at the decoding overhead 𝜀̂ = 0.1. Whereas, the last SLLT post-code (c) is customized to approach the designed target points 𝐺1 and 𝐺2 [Table 1]. It can be observed
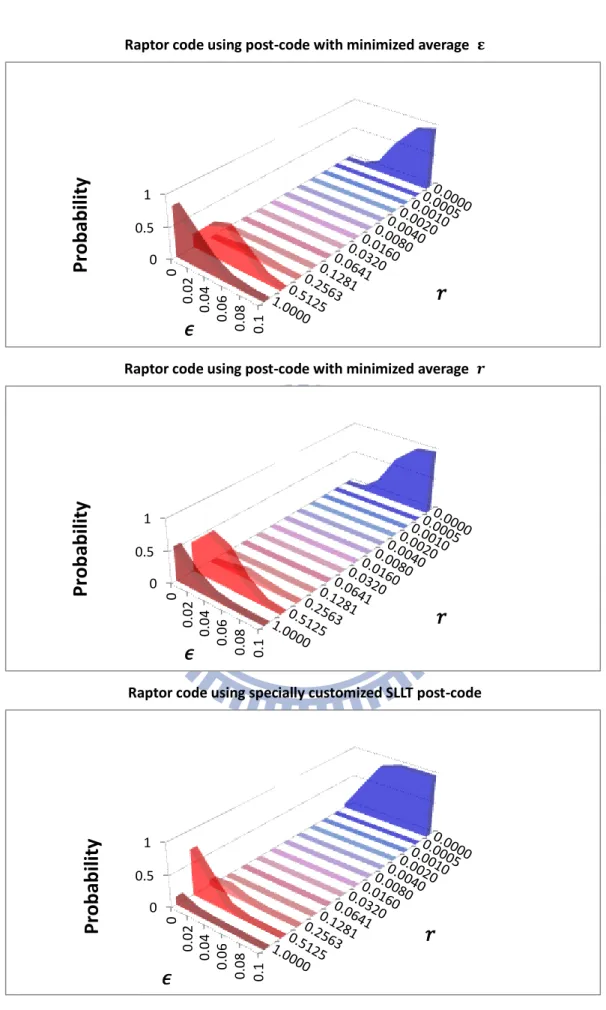
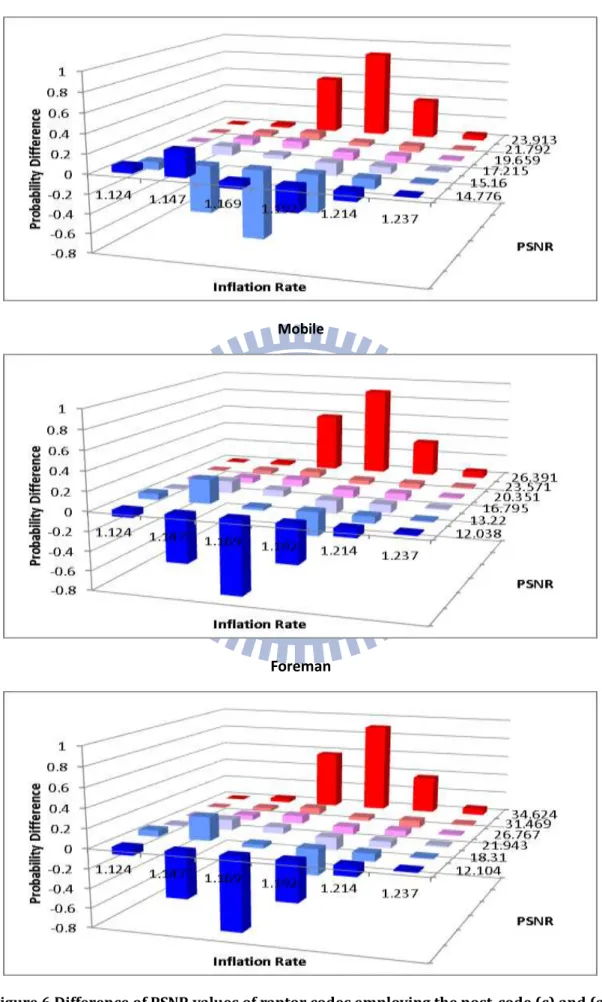
that the SLLT codes (a) and (b) both out-performed the specially customized SLLT code (c). However, from the decoding performance ofraptor codes constructed by concatenating the LDPC pre-code with these three SLLT post-codes [Figure 5], we can observe that the raptor code employing the specially customized post-code significantly outperforms the other two raptor codes. This reason is that the LDPC pre-code is capable of recovering all the source symbols as long as the failure rate of its post-codes is maintained below 5%, and the specially customized SLLT code achieved this goal at lower overhead than the other two post-codes. Practically, the same results can be observed from experiments using standard video sequences Football, Mobile and Foreman [Figure 6, Figure 7].
11
(a) SLLT post-code with minimized average 𝜺
(b) SLLT post-code with minimized average 𝒓
(c) Specially customized SLLT post-code
Figure 4 Decoding performance comparison of three different SLLT post-codes 0 0.5 1 0 0.0 45 0.0 9 0.1 35 0.1 8 0.2 25 0.2 7 0.3 15 0.3 6
𝑟
Pr
oba
bi
lit
y
𝜖
0 0.5 1 0 0.0 45 0.0 9 0.1 35 0.1 8 0.2 25 0.2 7 0.3 15 0.3 6𝑟
Pr
oba
bi
lit
y
𝜖
0 0.5 1 0 0.0 45 0.0 9 0.1 35 0.1 8 0.2 25 0.2 7 0.3 15 0.3 6𝑟
Pr
oba
bi
lit
y
𝜖
12
Raptor code using post-code with minimized average 𝛆
Raptor code using post-code with minimized average 𝒓
Raptor code using specially customized SLLT post-code
Figure 5 Decoding performance comparison of raptor codes employing three different SLLT post-codes 0 0.5 1 0 0.0 2 0.0 4 0.0 6 0.0 8 0.1
𝑟
Pr
obabil
it
y
𝜖
0 0.5 1 0 0.0 2 0.0 4 0.0 6 0.0 8 0.1𝑟
Pr
obabil
it
y
𝜖
0 0.5 1 0 0.0 2 0.0 4 0.0 6 0.0 8 0.1𝑟
Pr
oba
bi
lit
y
𝜖
13
Football
Mobile
Foreman
14
Football
Mobile
Foreman
15
Chapter 4. Design of a Rateless UEP Code for
SVC/MGS Multicasting
The codes with UEP capability are necessary for transmitting the H.264/SVC bit-streams able to reach near-optimal rate-distortion performance. This is mainly because the decoding process of the scalable layers forms a partial order ― the network abstraction layer (NAL) units of enhancement layers can be decoded only if the NAL units of base layer at corresponding positions were decoded. The base layer should be in the highest protection level, so that the receiver can obtain the basic quality even in a case of large packet loss. On the other hand, the NAL units of medium grain scalable (MGS) layers may have assigned weaker protection levels since each of these layers provides only a small incremental improvement of the video quality.
In this chapter, we design a composite rateless UEP code (by concatenating the UEP pre-code with the SLLT post-code), which enables the H.264/SVC bit-streams to render graceful degradation effect in wireless multicasting.
4.1. Choice of a UEP Pre-code
Based on the rate-distortion analysis of SVC bit-streams from [10], we know that (1) several protection layers (two to four layers) provided by the rateless UEP code are sufficient; (2) the data size of the layer with the highest protection ability should be at least as large as the data sizes of the other layers; (3) The data block size of the rateless UEP code should be capable of accommodating significant fluctuations of the GOP size.
One of the codes that is able to fulfill above requirements is the UEP convolutional code [11]. Hence, we adopted its version that can provide three-layered erasure protection and 1:1:1 data size ratio among layers. Furthermore, in order to reduce the total inflation rate of
16
the rateless UEP code, we decided to raise the code rate of its convolutional pre-code by employing the puncturing method. The detailed puncturing specification is reported in Table 2.
Since the convolutional codes are prone to malfunction when the channel suffers from the burst errors, we used interleaver that reduces the occurrence of burst errors by relocating the positions of error bits.
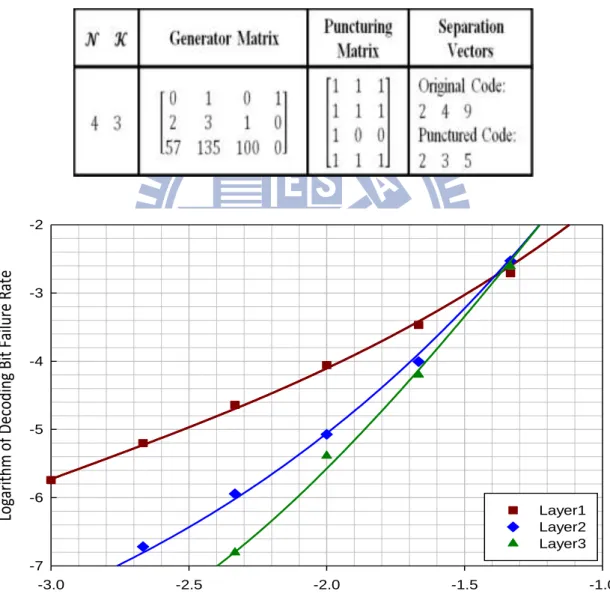
Table 2 UEP Convolutional Pre-code and Puncturing Specification
Figure 8 Decoding performance of convolutional UEP pre-code
Logarithm of Channel Bit Erasure Rate
-3.0 -2.5 -2.0 -1.5 -1.0 Log ar ith m of Dec odi ng B it Fail ure R at e -7 -6 -5 -4 -3 -2 Layer1 Layer2 Layer3
17
4.2. Design of a Rateless Post-code
The SLLT post-code should provide the decoding failure rates sufficient for the convolutional pre-code to deliver the UEP capability necessary for the graceful degradation of SVC bit-streams. In order to provide these failure rates, we imposed the following two decoding performance objectives on the SLLT post-code:
(1) To decode the base layer at the minimum decoding overhead;
(2) To decode all three layers within the moderate range of the decoding overhead.
The SVC bit-streams can perform graceful degradation by receiving more and more MGS NAL units, whose decoding chances depend on the decoding of the base layer. To make the rate-distortion performance able to improve directly upon the channel code recovers a MGS NAL unit, the base layer should be decoded as early as possible. The reason for defining the second objective is that we want to ensure that users will obtain the full playback quality once they receive a moderate amount of reception overhead.
Owing to the UEP effect provided by chosen pre-code and the multi-layer structure of the SVC/MGS bit-streams, it is not straight-forward to determine the target points representing the above objectives from the decoding performance of the pre-code. Hence, we set up a set of experiments to find out how the symbol erasure channels with different symbol failure rates and occurrence probabilities affect the video playback performance of each SVC/MGS layer. In these experiments, we set the code block length to 2000 symbols, since the block length of SLLT post-code that we decided to employ in the composite rateless UEP code is 6000 symbols and the data size ratio among the layers is 1:1:1 (see the pre-code specification).
In the experiments related to the SVC/MGS enhancement layers, we assumed that the lower layers are successfully recovered in order that the results would show the quality improvement made by recovering the NAL units of a specific layer. Also, since the transfer of
18
I-frames is similar to the bulk data transport, it is desirable to exclude the event of unrecovered I-frames. By assuming that the I-frames are always recovered on the decoder side, the obtained results clearly show the effect of different combinations ofsymbol failures rates and tail probabilities on the PSNR improvement.
In order to make the scenario of our experiments consider the tail probability, we defined the symbol failure rate histograms as shown in Figure 9. For every combination of the failure rate 𝑅 and the tail probability 𝑇, the value of 𝑇 represents the probability that the entire block of data will be erased. In addition, we assume that the probabilities of all the decoding failure rates 𝑟̂ ≤ 𝑅 will be uniformly distributed.
Figure 9 Estimated symbol failure rate distribution
The results obtained from the 105 simulation runs are shown in Table 3, Table 4 and Table 5. The values represent the ratios of PSNR differences calculated by the following formula:
esult of specific (𝑅 𝑇) setting − only I f ame decoded full decode specific laye − only I f ame decoded
For the decoding of the base layer, we chose the point (green bold rectangle in Table 3) having the steepest improvement, w.r.t. the both, tail probability and symbol failure rate. On the other hand, since the complete recovery requires decoding of most of the frames, we had to choose the point with relatively high value when considering the successful complete decoding. In order to avoid “overdesigning”, we chose the point (green bold rectangle in
19
Table 4 and Table 5) with the lowest tail probability among all the points having the value above 0.9. Hence, we set the value of coordinate 𝑇 of both target points to 0.0316.
Table 3 Median (top) and Mean (bottom) Aspect of PSNR Improvement in Base Layer (Foreman)
Number of
erased symbols 𝒓
𝑻
1.00E-1 3.16E-2 1.00E-2 3.16E-3 1.00E-3
3 1.50E-3 0.00E+ 0.00E+0 9.70E-2 9.70E-2 9.70E-2
2 1.00E-3 1.86E-1 2.20E-1 2.20E-1 2.20E-1 2.20E-1
1 5.00E-4 2.20E-1 5.06E-1 5.21E-1 5.21E-1 5.21E-1
0 0.00E+0 1.00E+ 1.00E+ 1.00E+ 1.00E+ 1.00E+
Number of
erased symbols 𝒓
𝑻
1.00E-1 3.16E-2 1.00E-2 3.16E-3 1.00E-3
3 1.50E-3 1.70E-1 1.92E-1 2.01E-1 2.03E-1 2.04E-1
2 1.00E-3 2.64E-1 3.06E-1 3.20E-1 3.25E-1 3.26E-1
1 5.00E-4 4.08E-1 4.79E-1 5.02E-1 5.07E-1 5.10E-1
0 0.00E+0 7.77E-1 9.26E-1 9.76E-1 9.92E-1 9.98E-1
Table 4 Median (top) and Mean (bottom) Aspect of PSNR Improvement in Enhancement Layer1 (Foreman)
Number of
erased symbols 𝒓
𝑻
1.00E-1 3.16E-2 1.00E-2 3.16E-3 1.00E-3
3 1.50E-3 2.77E-1 2.98E-1 3.06E-1 3.09E-1 3.10E-1
2 1.00E-3 3.41E-1 3.78E-1 3.89E-1 3.90E-1 3.90E-1
1 5.00E-4 4.71E-1 5.24E-1 5.56E-1 5.56E-1 5.56E-1
0 0.00E+0 1.00E+0 1.00E+0 1.00E+0 1.00E+0 1.00E+0
Number of
erased symbols 𝒓
𝑻
1.00E-1 3.16E-2 1.00E-2 3.16E-3 1.00E-3
3 1.50E-3 3.19E-1 3.47E-1 3.58E-1 3.60E-1 3.61E-1
2 1.00E-3 4.03E-1 4.44E-1 4.57E-1 4.62E-1 4.64E-1
1 5.00E-4 5.26E-1 5.84E-1 6.04E-1 6.09E-1 6.11E-1
20
Table 5 Median (top) and Mean (bottom) Aspect of PSNR Improvement in Enhancement Layer2 (Foreman)
Number of
erased symbols 𝒓
𝑻
1.00E-1 3.16E-2 1.00E-2 3.16E-3 1.00E-3
3 1.50E-3 5.44E-1 5.83E-1 5.95E-1 6.02E-1 6.02E-1
2 1.00E-3 6.32E-1 6.99E-1 7.12E-1 7.18E-1 7.19E-1
1 5.00E-4 7.42E-1 7.86E-1 8.09E-1 8.17E-1 8.23E-1
0 0.00E+0 1.00E+0 1.00E+0 1.00E+0 1.00E+0 1.00E+0
Number of
erased symbols 𝒓
𝑻
1.00E-1 3.16E-2 1.00E-2 3.16E-3 1.00E-3
3 1.50E-3 5.53E-1 6.00E-1 6.13E-1 6.18E-1 6.19E-1
2 1.00E-3 6.38E-1 6.94E-1 7.11E-1 7.17E-1 7.18E-1
1 5.00E-4 7.29E-1 7.92E-1 8.12E-1 8.18E-1 8.21E-1
0 0.00E+0 8.82E-1 9.62E-1 9.88E-1 9.96E-1 9.99E-1
Consequently, we had to adapt the 𝑟 values of chosen key points (found under random symbol erasure channel) to our concatenated coding scheme. Since the points located on the performance curves of the pre-code [Figure 10] are calculated as the average of bit failure rates, we converted the 𝑟 values of chosen points into the average symbol failure rates by the formula based on the definition of symbol failure rate histograms in our experiments:
𝑟̅ = 𝑝𝑛 ⋅ ∑ 𝑛 2000 𝑁 𝑛=0 + 𝑇 ⋅ 𝐹 2000 whe e 𝑝𝑛 = 1 − 𝑇 𝑁 + 1 𝑎𝑛𝑑 𝑁 = ⌊𝑅 ∗ 2000⌋
In order to make a conservative estimate, we required at least 𝐹 failed symbols in the group of pictures (GOP) block to represent the decoding failure of the entire GOP. In the encoding format of the test video clips, we set the GOP size to 8.
After substitution, we obtained the average symbol failure rates for decoding of the base layer and for the complete decoding. Consequently, we consulted the performance profile of the pre-code to find the respective channel erasure rates. Since in our case, the channel erasure rates correspond to the failure rates of the SLLT post-code, we found that
21
post-code failure rates 𝑟̅ 𝑏𝑎𝑠𝑒= 0.03 and 𝑟̅ 𝑒𝑛ℎ𝑎𝑛𝑐𝑒= 0.01 are sufficient for the decoding
of the base layer and all three SVC/MGS layers, respectively.
Figure 10 Average failure rates sufficient for decoding of the base layer and all three SVC/MGS layers
In the next step, we had to define the values of reception overhead, in which the SLLT post-code should deliver the failure rates and tail probabilities necessary for the decoding of the base layer and complete decoding, respectively. As target reception overhead for the base layer, we adopted the starting point of the transition region of the SLLT code decoding performance, since it defines the region of the reception overhead that exhibits steepest performance improvement. When the code block length is approx. 6000 symbols, we observed that the starting point of the SLLT code transition region is approximately at 4% of the reception overhead. Since, according to our best knowledge, the maximum desirable inflation rate of the composite code should not exceed 20% and the rate of chosen UEP pre-code is 9/10, we set the target decoding overhead for the complete decoding to be 8%, w.r.t. the number of received symbols of the SLLT post-code.
22
After defining all the boundary values, we could finally specify the target points of our SLLT code customization method in order to achieve the UEP behavior in the admissible region of decoding overhead.
Considering the decoding of the base layer, we know that unlike the random erasure channel, the decoding performance of SLLT codes exhibits severe bimodal feature at the beginning of the transition region. Because of this, it is not appropriate to set the average failure rate as the optimization criterion, in this case. Therefore, we defined the target point 𝐺1 using 𝜀 𝑟 and 𝑇 and set its coordinatesas shown in the Table 6.
In our experiments, we aimed at minimizing the distance to this target point along the coordinate directions 𝜀 and , since we wanted to ensure that our rateless UEP code recovers as many frames as possible at 4% overhead and at the same time decode the base layer at the lowest possible overhead, in case that the search algorithm cannot find a solution reaching this point.
Considering the complete decoding, we employed the average failure rate as the optimization objective, since the bimodal feature of the SLLT code decoding performance is no more significant, at the error floor region. The coordinates of the target point 𝐺2 are also
shown in the Table 6.
Table 6 Target Points Specification for SLLT Post-Code employed in the rateless UEP code
Target point 𝜀̂ 𝑟̂ 𝑇̂
𝐺1 0.04 0.03 0.0316
Target point 𝜀̂ 𝑟̅̂
23
4.3. Matching the Rateless Post-code with chosen UEP
Pre-code
In our design, we employed following functional blocks of rateless convolutional UEP encoder shown in the Figure 11, where, the data of three SVC/MGS layers in one GOP were fitted into a single block of source symbols. Since the code block length of the SLLT post-code is constant, we had to make the input symbol size adaptable in order to cope with the fluctuation of the GOP size.
In addition, we employed a stacked structure of convolutional UEP encoders to accommodate the variable size of individual GOP. In our design, before the byte stream is fed into the convolutional UEP encoders, a dispatcher is used to funnel the corresponding bits from different SVC layers to convolutional UEP encoders so that they can be combined into individual codewords.
Furthermore, in our design, the burst failure events that can make the convolutional UEP code fail to decode the source message are effectively avoided, since one erased symbol in the SLLT post-code only causes one erased bit in each convolutional UEP decoder. However, there is still a chance that successive erased symbols will occur after the LT decoding process. In order to cope with these undesirable events, we inserted the interleaver between the convolutional UEP encoders and SLLT post-code.
24
4.4. Experiment Results
In order to prove the practicability of our method, we compare the specially customized SLLT post-code with an SLLT post-code created by using one of the conventional optimization objectives, i.e., minimization of average failure rate at the decoding overhead 𝜀̂ = 0.04. In the Figure 12, the blue rectangles represent the admissible region defined in chapter 4.2 , in which the upper-left corner corresponds to the target point for decoding of the base layer and the lower-right corner corresponds to the target point for the complete decoding. We can observe that the specially customized SLLT post-code achieved these target points as desired [Figure 12(a)] but the conventionally optimized code failed to reach the lower-right corner of the admissible region representing the second target point [Figure 12(b)]. The protection capabilities of each layer of the composite rateless UEP code can be seen in the Figure 13. Although, the difference of protection capabilities of different layers is more obvious in Figure 13(a), the rateless UEP code employing the specially customized SLLT post-code exhibits better decoding performance w.r.t. all three protection layers, whereas, it is able to successfully recover the first two layers (with higher protection capability) at significantly lower level of decoding overhead than the other candidate code. The fact that the rateless UEP code employing the specially customized SLLT post-code is able to fully decode the base layer and enhancement layer 1 of the SVC bit-streams with significantly lower amount of received symbols is proven by the experiments on the standard test video sequences [Figure 14].
25
(a) Conventionally Optimized SLLT post-code
(b) Specially Customized SLLT post-code
26
(a) Convolutional UEP code with Conventionally Optimized SLLT post-code
(b) Convolutional UEP code with Specially Customized SLLT post-code
Figure 13 Bit failure rate of candidate rateless UEP codes
0.0 0.2 0.4 0.6 0.8 1.0 -6 -5 -4 -3 -2 -1 0 1.14 1.16 1.18 1.20 1.22 O ccur en ce P ro bab ility Logarithm of Bit Fa ilure Rate Infla tio n Rate LT (Avg R=0.036; =0.04) & CC (10/9; 2,3,5) Layer 1(2) Layer 2(3) Layer 3(5) 0.0 0.2 0.4 0.6 0.8 1.0 -6 -5 -4 -3 -2 -1 0 1.14 1.16 1.18 1.20 1.22 O ccur en ce P ro bab ility Logarithm of Bit Fa ilure Rate Infla tio n Rate LT(R=0.02; =0.04; P=0.03) (R=0.03; =0.037; P=0.03) (Avg R=0.008; =0.08)& CC (10/9; 2,3,5) Layer 1(2) Layer 2(3) Layer 3(5)
27
Figure 14 Playback PSNR probabilities of SVC/MGS bitstreams protected by candidate rateless UEP codes
R-D plot (Foreman)
0.0 0.2 0.4 0.6 0.8 1.0 1.14 1.15 1.16 1.17 1.18 1.19 1.20 Pr obability PSNR Inflation Ra teUEP code with conventionally optimized SLLT post-code UEP code with specially customized SLLT post-code
<12 13-18 19-22 23-28 29-33 34-36
R-D plot (Football)
0.0 0.2 0.4 0.6 0.8 1.0 1.14 1.15 1.16 1.17 1.18 1.19 1.20 Pr obability PSNR Inflation RateUEP code with conventionally optimized SLLT post-code UEP code with specially customized SLLT post-code
<15 16-18
19-20 21-23
28
Chapter 5. Conclusion
5.1. Achievements
In this thesis, we propose the way how to design objectives imposed on the customized SLLT codes that may suit different video applications. We demonstrate the proposed approach through the design of SLLT post-codes employed in two composite codes: (1) short-length raptor code which uses LDPC code as a pre-code; and (2) rateless UEP code, whose convolutional pre-code exhibits the UEP capability.
Composite codes employing the SLLT post-codes customized by using the proposed approach exhibit significantly improved PSNR performance comparing to the codes employing the post-codes created by using the conventional optimization objectives. This fact confirms the practicability of proposed approach.
5.2. Future Work
For the analysis of video performance under random symbol erasure channel, we plan to search for a more appropriate distribution representing the decoding performance profile of the SLLT codes.
In order to improve the coding rate of the coding scheme protecting the SVC/MGS bit-streams, we plan to adopt the Priority Encoding Transmission [12] method to make the SLLT code capable of providing the UEP capability without being combined with a rateless pre-code.
29
References
[1] M. Luby, “LT codes,” 43rd Annu. IEEE Symp. Found. Comput. Sci. 2002. Proceedings., pp. 271–280 [2] D. Vukobratovic, V. Stankovic, D. Sejdinovic, L. Stankovic, and Z. Xiong, “Scalable Video Multicast Using
Expanding Window Fountain Codes,” IEEE Trans. Multimed., vol. 11, no. 6, pp. 1094–1104, Oct. 2009 [3] N. Hansen and A. Ostermeier, “Adapting Arbitrary Normal Mutation Distribution in Evolution Strategies -
The Covariance Matrix Adaptation,” in IEEE International Conference on Evolutionary Computation, 1996, pp. 312–317.
[4] E. Hyytiä, T. Tirronen, and J. Virtamo, “Optimizing the Degree Distribution of LT Codes with an Importance Sampling Approach,” in 6th International Workshop on Rare Event Simulation, 2006, pp. 64–73.
[5] 刁培倫,「A Study of Performance and Degree Distribution of Optimal Short-Length LT codes with Aids of Evolution Strategies」,國立交通大學,碩士論文,民國100年
[6] R. Flavell, “A new goal programming formulation,” Omega, vol. 4, no. 6, pp. 731–732, 1976
[7] J. G. Lin, “On min-norm and min-max methods of multi-objective optimization,” Math. Program., vol. 103, pp. 1–33, 2005.
[8] A. Shokrollahi, “Raptor Codes,” IEEE Trans. Inf. Theory, vol. 52, no. 6, pp. 2551–2567, 2006 [9] D. J. C. Mackay, “Encyclopedia of Sparse Graph Codes.” [Online]. Available:
http://www.inference.phy.cam.ac.uk/mackay/codes/da. [Accessed: 06-Mar-2014].
[10] 邱志明,「Joint Design of H.264 SVC/MGS Encoding, Extraction and Unequal Erasure Protection for Rateless Wireless Broadcasting」,國立交通大學,碩士論文,民國101年
[11] C. Wang, M. Chiu, and C. Chao, “On Unequal Error Protection of Convolutional Codes From an Algebraic Perspective,” IEEE Trans. Inf. Theory, vol. 56, no. January, pp. 296–315, 2010
[12] Nekoui, N. Ranjkesh, and F. Lahouti, “A Fountain Code Approach towards Priority Encoding Tansmission,” in Proc. IEEE Inf. Theory Workshop (ITW’06)