行政院國家科學委員會專題研究計畫 成果報告
子計畫一:台灣海峽浮游生物之生產力及食物階層動態(Ⅲ)
計畫類別: 整合型計畫
計畫編號: NSC91-2611-M-110-012-OP4
執行期間: 91 年 08 月 01 日至 92 年 07 月 31 日
執行單位: 國立中山大學海洋生物研究所
計畫主持人: 陳宏遠
報告類型: 精簡報告
報告附件: 出席國際會議研究心得報告及發表論文
處理方式: 本計畫可公開查詢
中 華 民 國 93 年 2 月 16 日
行政院國家科學委員會補助專題研究計畫成果報告
※※※※※※※※※※※※※※※※※※※※※※※※※
※
台灣海峽生態系統動態整合研究 子計畫一:
※
※
台灣海峽浮游生物之生產力及食物階層動態(III)
※
※※※※※※※※※※※※※※※※※※※※※※※※※
計畫類別:□個別型計畫
■整合型計畫
計畫編號:NSC91-2611-M-110-012-OP4
執行期間:91 年
8 月
1 日至
92 年
7 月
31 日
計畫主持人:陳宏遠
共同主持人:
本成果報告包括以下應繳交之附件:
□赴國外出差或研習心得報告一份
□赴大陸地區出差或研習心得報告一份
□出席國際學術會議心得報告及發表之論文各一份
□國際合作研究計畫國外研究報告書一份
執行單位:國立中山大學海洋生物研究所
中
華
民
國
93 年
2
月
5
日
行政院國家科學委員會專題研究計畫成果報告
台灣海峽生態系統動態整合研究 子計畫 1:
台灣海峽浮游生物之生產力及食物階層動態 III
Taiwan Strait Ecosystem Dynamics Interdisciplinary Project
Plankton productivity and trophodynamics in the Strait of Taiwan III
計畫編號:NSC 91-2611-M-110-012-OP4
執行期限:91 年 8 月 1 日至 92 年 7 月 31 日
主持人:陳宏遠
國立中山大學海洋生物研究所
計畫參與人員:陳攸里、鍾權偉、康一凡
I. 中文摘要 民國 92 年四月及七月一共在台灣海峽執行了 4 航 次,2 次(OR3-CR858 and OR1-CR678)在四月初,代表春天海峽的情況;另 2 次(OR3-CR878 and OR1-CR684)在六月,則代表夏天情況。各航次中 採集了浮游生物,並測量各種水文、營養鹽、及相 關環境因子。從這二季的綜合結果,我們發現在夏 季,中國沿岸表層水相當優養化,葉綠素甲濃度均 大於 1 mg/m3;特別是閩江河口,甲濃度均大於 5 mg/m3. 相較下,台灣沿岸則相當貧營養。和浮游 植物量一樣,台灣沿岸浮游動物量比中國沿岸低。 在中國沿岸,大型浮游植物優勢在春天較夏天更為 明顯;在台灣沿岸並沒有大型浮游植物佔優勢的情 形。 浮游動物密度在海峽中線相當高,但並設有 大型浮游動物優勢的現象,大型浮游動物佔總葉綠 素甲濃度不到 39%,在很多樣品中葉綠素甲濃度並 不高。 關鍵詞:台灣海峽、浮游生物、葉綠素、季節性 Abstract
Two pairs cruises were carried out in April and June of 2003, respectively. Each represents the spring and summer situation in the Taiwan Strait. The spring cruises that were conducted in April included OR3-CR858 and OR1-CR678; and the summer cruises included OR3-CR878 and OR1-CR684.Plankton samples were collected and physiochemical properties of seawater were measured in the Taiwan Strait during the cruises. Combined the results of the summer and the spring, we found that China coastal water was eutrophic. Surface Chl was usually >1 mg/m3. Chl was especially high along the river mouth of the Meng-Chiang, being 5 mg/m3 in the summer. Taiwanese coast, in contrast, was more oligotrophic. Like phytoplankton abundance, ZP was higher along China coast than Taiwan coast. Dominance of large size phytoplankton in the Chinese coastal water was
abundant, dominance of large size phytoplankton was not high. Large size phytoplankton generally accounted for less than 39% of total Chl. In many of the measurements in many stations, Chl was not particularly high.
Keywords: Taiwan Strait, plankton, Chlorophyll,
seasonal
II. Introduction
The Strait of Taiwan is a shallow channel connecting two large marginal seas of the North Pacific: the East China Sea and the South China Sea. Alternating monsoons drive the currents and determine the hydrography of the Strait (Jan 1995). Warm season generally begins in mid-April and end in mid-September. During the warm season, the southwestern monsoon streams the surface water of the South China Sea into the Strait. The oligotrophic water from the south renders low productivity in the Strait, except along the coasts of northern Strait. In cold season that begins with the prevalence of the northeastern monsoon, the nutrient-laded water from the East China Sea invades the Strait and meets the northward water, mainly from the penetration of the Kuroshio through the Bashi Channel, in the middle of the Strait. The standoff of the two water masses, the nutrient-laded cold water of the China Coast Current from the north and the oligotrophic water of the Kuroshio Current from the south would form a natural barrier in the Strait. Although physical change in the Strait has be partially unraveled, biological and chemical aspects have been little known.
The present paper compares the biochemical dynamic change before and after the commencement of the southwesterly monsoon. The main theme is the difference in the distribution of planktonic community in the Strait. These results offer the essential background setting for future investigations of the project.
III. Materials and Methods
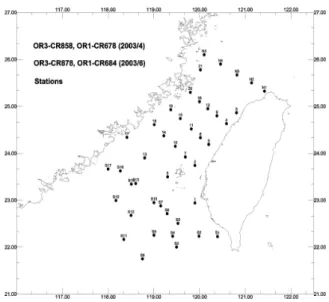
Two pairs cruises were carried out in April and June of 2003, respectively (Table 1). The April cruises were 2 days apart and the June cruises were 5 days apart. Because of their close approximation in time, the two cruises in each pair are treated as they were carried out in the same cruise. Plankton samples were collected and physiochemical properties of seawater were measured in the Taiwan Strait during the cruises. Fig. 1 depicts the location of the sampling stations that were investigated in all 4 cruises. Plankton tows were carried out during cruises. CTD data and seawater samples were collected at all stations using 20-l Go-Flo bottles attached to a rosette multi-sampler mounted on a CTD (SBE 9/11plus, SeaBird Inc., WA). Vertical profiles of subsurface irradiance were obtained with a PAR sensor (OSP200L, Biospherical Inc., USA). Incidence irradiance was continuously monitored during the simulated on board productivity experiments. The depth of the euphotic zone is the depth of 0.6% of the surface light radiation. The depth of mixed layer is the depth where the density (sq) gradient equals 0.1 m-1. Table 1. Cruises and sampling stations during each cruises.
Cruise Time Stations
Spring OR3-CR858 2003/4/2-4 S1、S2、S3、S5、S8、S9、 S10、S11、S12、S14、S15、 S17 OR1-CR678 2003/4/10-15 N2、N3、N4、N5、1、2、3、 4、6、7、8、9、10、11、12、 13、14、15、16、17、18、 19、20、21 Summer OR3-CR878 2003/6/1-2 S2、S4、S5、S6 OR1-CR684 2003/6/5-9 N1、N2、N5、1、2、3、4、 5、6、10、11、12、13、18、 19、20、21、S7、S13、S16
Plankton samples were collected in oblique tows using a three-layered plankton net, each with a mesh size of 20, 200 and 500 m, respectively. The setup allowed simultaneous collection of 3 size classes: 20-200 m, 200-500 m and >500 m. Additional tows using a net with 1000m mesh were carried out at selected stations and used as the plankton size class >1000 m. A quantitative portion of each size-fractionated plankton sample was preserved with neutral formalin and was used for taxonomic examination. The remanding plankton was picked over to collect larval fish and then rinsed with distilled water, blotted dry and kept at -20oC.
Figure 1. Location of the sampling stations in the Taiwan Strait.
Estimations of phytoplankton biomass, as measured by the chlorophyll a concentration, were carried out on size fractionated (<20m and > 20 m) samples. Chlorophyll a concentration was determined fluorometrically on extracted samples. Concentrations of nitrate and phosphate were measured following the pink azo dye method and the molybdenum blue method, respectively. Depth of euphotic zone (DEU) was defined as the depth with 0.6% of the surface irradiance. Light extinction coefficient K was calculated to express the exponential decrease of PAR with depth (Lalli and Parsons, 1993). Mixed-layer depth was defined as the depth of the water layer having a density gradient smaller than 0.1m_1 (Chen et al., 2001). Stratification index (SI) was defined as the density difference (kgm-3) between the surface and the bottom of euphotic zone (Chen et al., 2001).
Regression analysis was performed to describe the distribution of phytoplankton and zooplankton in the Strait and its coupling with the environment.
IV. Results and Discussion
Summer observations
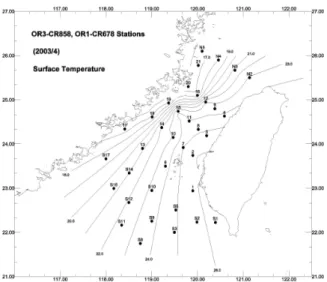
Two cruises were carried out in the summer (Table 1). Cruise OR1CR684 covered the area between 23-26°N and OR3CR878 studied the water between 22-23°N. During the month of June, surface water ranged between 22.7-28.3 ° C. Temperature isopleths aligned in a direction from northeast to southwest (Fig. 2). Lowest temperature was observed at the northeastern Strait along the coast of China and the highest temperature occurred at the southeastern Strait along the coast off southwestern Taiwan. Surface salinity varied between 30.5–34.6 psu and showed a similar isopleths pattern as surface temperature (Fig. 3), with high salinity in the northwest Strait along Chinese continent and low salinity in the east and southeast Strait along
Taiwanese coast. There existed a temperature front in the middle of the Strait. The front showed a northeast to southwest alignment (Fig. 2).
The abundance of phytoplankton in the Strait was closely related to surface temperature and salinity (Fig. 4). Chlorophyll a concentration (Chl, mg/m3) of the surface water was negatively related (P<0.01) to surface temperature (Temp), and also to (P<0.01) surface salinity (Sal). Their regression equations are:
Chl = 9.584 –0.338 Temp (r2=0.56, n=24) Chl = 15.284 –0.425 Sal (r2=0.64, n=24) The water with the highest chlorophyll concentration was found in the northwestern Strait along China coast. The highest concentration of 5.01 mg/m3 was detected at Sta 15. Chlorophyll concentrations near the front in the Strait were relatively high. Chl at Sta 7 was 3.53 mg/m3and was 3.64 mg/m3at Sta N3.
Size spectrum of phytoplankton assemblage of the Strait was not found to relate to Chl. In the phytoplankton flourish Chinese coast, cells <20m dominated phytoplankton assemblage. Overall results from Sta 14, 15, N% and N6 shows that only 10-17% of total Chl was contributed by cells >0m.In contrast, large phytoplankton was abundant in the front in the mid-Strait. Up to 67-94% of total Chl (for example Sta 7 and N3) was contributed by phytoplankton with cell size <20m. Large phytoplankton with cell size >0m was the least abundant in the eastern Strait along the northern Taiwanese coast. Phytoplankton >0m contributed only 4-10% of total Chl at Sta N1, 19 and 10.
In addition their negative relationship with temperature and salinity, surface Chl was positively related to surface SiO3 abundance and water column
stability that was measured by Stratification Index (SI). At Sta 14, 15, N5 and N6, in the northwestern Strait, the water mass had extreme high SI, possibly caused by low surface salinity (30.5-31.9 psu). The chl-rich water in the front, however, was not particularly high or low in SI.
Thedistribution of>200μm zooplankton density (ZP, ind./m3) in the Strait was related to phytoplankton biomass. There exist positive regression between ZP and Chl of different size fractions:
For<20μm phytoplankton: ZP = 7459.84 + 6922.90 Chl
(P<0.05,r2=0.21,n=22) For<3μm phytoplankton: ZP = 6316.24 + 14675.90 Chl
(P<0.05,r2=0.19,n=22)
ZP was also positively regressed to water column SI. Their regression equation is:
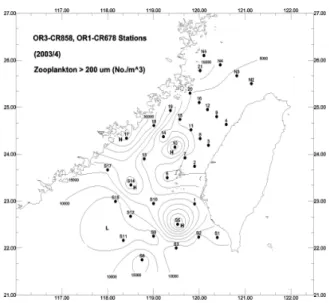
ZP = 8282.11 + 2333.00 SI (P=0.05,r2=0.18,n=22) Most of the sampling stations in which ZP was high (15.4×10³-40.5×10³/m3) were located at both sides of the northern Taiwan Strait (Fig. 5). They were Sta N5, 14 and 15 along China coast and Sta 19, 20
ZP (36.5×10³/m3). Surface Chl at Sta 12 was not high (0.47 mg/m3) and large cells did not dominate the phytoplankton assemblage. Its >20μm cells contributed only 35% of total Chl. ZP, however, was relatively high.
The above results did not spell a close relationship between phytoplankton biomass (i. e., Chl) and zooplankton biomass (ZP). Water high in Chl did not harbor abundant zooplankton. This was seen in the coastal water of northern Taiwan and in Sta 12 near the temperature front. These water masses generally did not have phytoplankton assemblages that are prone to large cell sizes. Multivariate analyses indicate that ZP and the proportion of large cells in phytoplankton assemblage(measured by Chlof>20μm cells/totalChl) are negatively correlated (P<0.05). ZP was also negatively (P<0.05) related to both surface [NO2+NO3]
(μM)and temperature(C).Theirrelation equation is: ZP = 134212.0 –15515.0 [NO2+NO3]–28862.5 Chl
(>20μm/total)–4210.2 Temp, (R2=0.40, n=21)
Among the parameters that were studied, temperature is likely to confound with other ecological indices. Surface temperature in the Strait was negatively related to SiO3, <3μm Chl, <20μm Chl,
total Chl and SI. Water mass that had a high ZP tended to be SiO3rich, phytoplankton abundant, domination
of small phytoplankton and stable water column. Water low in [NO2+NO3] could well be low in
[NO2+NO3]/SRP.
The results lead to an assertion that there existed difference among the sub-regions in the Taiwan Strait. And the difference that also revealed the variation of ZP biomass could be better explained with the biomass of small size phytoplankton and the dominance of large phytoplankton. Generally speaking, zooplankton prey on phytoplankton and its biomass varies with that of phytoplankton. Although abundant phytoplankton would stimulate a dose-dependent growth of zooplankton population, there exists a time lag caused by the slower pace of much-complicated reproductive processes in zooplankton as compared to cell division in most phytoplankton. The appearance of great numbers of zooplankton in turn consumes rapidly phytoplankton and renders the drastic decrease of Chl. In aquatic environments, as a general rule, body size of a predator has to be at least 10 times that of its prey. ZP larger than 200μm are capableof preying on phytoplankton >20μm.When asystem isdominated by large-size phytoplankton, it is probably in a state of bottom-up control. Phytoplankton biomass is modulated by physical factors such as light intensity, nutrient abundance, temperature, etc. The grazing impact of zooplankton on phytoplankton is limited. This may be the situation at the mid-Strait front where Sta 7 and N3 were located. The contribution of >20μm phytoplankton to totalChlwashigh and ZP was low. In the coastal waters, in contrast, dominance of large size phytoplankton was low and ZP was high,
low (as in Northern Taiwan coast). These all implicates the top-down control zooplankton on phytoplankton. Zooplankton grazing wiped out phytoplankton of large cell sizes while left phytoplankton of small cell sizes intact. It is thus impossible to trace the mutual connection between zooplankton and phytoplankton if only total Chl was used to relate their quantitative relationships.
Figure 2. Surface temperature contour in the Taiwan Strait, measured during June 2003.
Figure 3. Surface salinity contour in the Taiwan Strait, measured during June 2003.
Figure 4. Distribution of chlorophyll a in the Taiwan Strait, measured during June 2003.
Figure 5. Density contour of >200m zooplankton in the Taiwan Strait, sampled during June 2003.
Spring observations
Two cruises, OR1CR678 and OR3CR858, were conducted subsequently in the Taiwan Strait in April, 2003.CR678 investigated a total of 24 stations located between 23-26°N and CR858 investigated 12 stations between 21 ° 30’-23 ° 30’ N. The onboard CTD malfunctioned during CR858 and the invalid data set was not used for the following statistical analyses. Surface temperature in the Taiwan Strait during the April has a range between 16.5 and 25.9°C and a mean of 21.5°C. Temperature isopleths (Fig. 6) tip from the northeast to the southwest or from the south to the
north. Coastal water along China Coast was the coldest and warm water was found mainly along Taiwan coast. There exists a east-west aligned temperature isopleths at east of 19 ° 20’E and 24°30’N. Surface salinity showed a range between 29.2-34,8 psu. Salinity isopleths (Fig. 7) of the western half of the Strait align well with the temperature isopleths, being from the northeast to the southwest or from the south to the north. Seawater along China coast was dilute and salinity increased eastwardly towards the mid-Strait. East western salinity isopleths were observed at approximately 23°30’N and circulated salinewaterat north of 23°30’N and east of the mid-Strait, inclusive of Taiwanese coast.
Surface Chl ranged between 0.09-1.48 mg/m3. It was negatively related to either surface temperature (P<0.01) or salinity (P<0.01) and positively to either surface SRP (P<0.01) or SiO3 (P<0.01). In addition, surface Chl was positively related to either Chl of <20μm phytoplankton (P<0.01) or of >20μm phytoplankton (P<0.01). Levels of Chl concentrated near the China coast (Fig. 8), together with low temperature, low salinity, high SRP and SiO2 concentration. High pigment levels were also detected on Taiwan Bank where Sta S2 was located. The Chl along China coast was much lower in the spring than in the summer. Springtime phytoplankton assemblage along China coast was relatively dominated by large cells, which contributed to 42-69% of total Chl (Sta N4, 14, 16, 4 and 5 in CR678 and Sta 4 in CR858). Zooplankton density (ZP) ranged between 1.4×10³-42.8×10³/m3, which is not different from its summer density. ZP was negatively related to either temperature (P<0.01) or salinity (P<0.01), and positively related to Chl of either >20μm phytoplankton or >3μm phytoplankton. Sampling stations that had surface temperature higher than 21°C were low in ZP (Fig. 9). These stations were located in the east half of the Strait, inclusive of Taiwanese coast. The only exception is Sta 7 on the mid-Strait. Its surface temperature was 22.9 ° C, while ZP was relatively high (33.8×10³/m3). China coastal water was low in surface temperature and its ZP was relatively not high. Sta 4 and 5, in which ZP was high in the spring, was located 1° further south than Sta 14 and 15 in which zooplankton was most abundant in the summer.
These results agree with the summer results in that large size phytoplankton dominated in water with high ZP. Sta 7 on the mid-Strait, though not high in Chl (0.48 mg/m3), was relatively abundant in zooplankton (33.8×10³/m3). Large size phytoplankton did not dominate the phytoplankton assemblage. Cells >20μm only accounted for 18% of total Chl. This supports the assertion that water that is higher in ZP has less phytoplankton of large sizes. One exception, however, existed at Sta 15 along China coast. Its phytoplankton cells >20μm only accounted for21% of
Figure 6. Surface temperature contour in the Taiwan Strait, measured during April 2003.
Figure 7. Surface salinity contour in the Taiwan Strait, measured during April 2003.
Figure 5. Density contour of >200m zooplankton in the Taiwan Strait, sampled during April 2003.
Combined the results of the summer and the spring, we found that China coastal water was eutrophic. Surface Chl was usually >1 mg/m3. Chl was especially high along the river mouth of the Meng-Chiang, being 5 mg/m3 in the summer. Taiwanese coast, in contrast, was more oligotrophic. Like phytoplankton abundance, ZP was higher along China coast than Taiwan coast. Dominance of large size phytoplankton in the Chinese coastal water was much significant in April than in June. Dominance of large size phytoplankton was low. Similarly, in the mid-Strait where zooplankton was relatively abundant, dominance of large size phytoplankton was not high. Large size phytoplankton generally accounted for less than 39% of total Chl. Like in Sta 7 of the April cruise, Sta 3 and 8 of CR858 and Sta 12 of the June cruise, Chl was not particularly high.
V. Reference
Jan, S.(1995)Seasonal change of current fields in the Taiwan Strait. PhD dissertation. National Taiwan University, Taipei.
Kidwai, S. and Amjad, S. (2000) Zooplankton: pre-southwest and northeast monsoons of 1993 to 1994, from the North Arabian Sea. Mar. Biol. 136: 561-571.
Hulot, F. D., Lacroix, G., Lescher-Moutoue, F. and Loreau, M. (2000) Functional diversity governs ecosystem response to nutrient enrichment. Nature 405: 340-344.
Lalli, C. M. and Parsons, T. R (1993) Biological oceanography: an introduction. Pergamon Press, Oxford.
Strom, S. L., Brainard, M. A., Holmes, J. L. and Olson, M. B. (2001) Phytoplankton blooms are strongly impacted by microzooplankton grazing in coastal North Pacific waters. Mar. Biol. 138: 355-368.

![TraditionalMLCalgorithmsmainlytacklethebatchMLCproblem,wheretheinputdataarepresentedinabatch[24,28].Nevertheless,inmanyMLCapplicationssuchase-mailcategorization[22],multi-labelexamplesarriveasastream.Onlineanalysisistherefore dimensionreducermotivatedbyma](data:image/gif;base64,R0lGODlhAQABAIAAAP///wAAACH5BAEAAAAALAAAAAABAAEAAAICRAEAOw==)