http://epm.sagepub.com
Educational and Psychological Measurement
DOI: 10.1177/0013164404268674
2004; 64; 956
Educational and Psychological Measurement
Li-Jen Weng
Reliability
Impact of the Number of Response Categories and Anchor Labels on Coefficient Alpha and Test-Retest
http://epm.sagepub.com/cgi/content/abstract/64/6/956
The online version of this article can be found at:
Published by:
http://www.sagepublications.com
can be found at:
Educational and Psychological Measurement
Additional services and information for
http://epm.sagepub.com/cgi/alerts Email Alerts: http://epm.sagepub.com/subscriptions Subscriptions: http://www.sagepub.com/journalsReprints.nav Reprints: http://www.sagepub.com/journalsPermissions.nav Permissions: http://epm.sagepub.com/cgi/content/refs/64/6/956 Citations
IMPACT OF THE NUMBER OF RESPONSE CATEGORIES AND ANCHOR LABELS ON COEFFICIENT ALPHA AND
TEST-RETEST RELIABILITY
LI-JEN WENG National Taiwan University
A total of 1,247 college students participated in this study on the effect of scale format on the reliability of Likert-type rating scales. The number of response categories ranged from 3 to 9. Anchor labels on the scales were provided for each response option or for the end points only. The results indicated that the scales with few response categories tended to result in lower reliability, especially lower test-retest reliability. The scales with all the response options clearly labeled were likely to yield higher test-retest reliability than those with only the end points labeled. Scale design that leads to consistent participant responses as indicated by test-retest reliability should be preferred.
Keywords: Likert-type rating scales; number of response categories; anchor labels;
test-retest reliability; internal consistency; coefficient alpha
Since Likert’s (1932) introduction of the summative method, Likert-type rating scales have enjoyed great popularity among social science researchers (Likert, Roslow, & Murphy, 1934; Wang & Weng, 2002), and they have also drawn much research attention to the effects of scale format on participants’ responses and associated psychometric properties. One intensively exam-ined topic is the effect of the number of response categories on scale reliabil-ity, especially coefficient α, an estimate of internal consistency reliability.
I would like to thank all the individuals who participated in this study. The assistance of L.-F. Li in data collection and analysis is gratefully acknowledged. I would also like to express my ap-preciation to the anonymous reviewer for the suggestion to present the graphs of polynomial trend lines. This research was supported by Grant NSC 88-2413-H-002-010 from the National Science Council of Taiwan. Correspondence concerning this article should be addressed to Li-Jen Weng, Department of Psychology, National Taiwan University, Taipei 106, Taiwan, Repub-lic of China; e-mail: ljweng@ntu.edu.tw.
Educational and Psychological Measurement, Vol. 64 No. 6, December 2004 956-972 DOI: 10.1177/0013164404268674
The stability of measurement scores over time is also critical, and the impact of the number of response options on test-retest reliability should be assessed as well. The objective of the present research was to investigate the effects of the scale properties of Likert-type scales on test-retest reliability in addition to internal consistency reliability. The scale properties studied included the number of response categories and the anchor labels attached to the scale.
Reliability evaluates the influence of measurement errors on participants’ responses. Types of reliability differ in the sources of measurement errors considered. Internal consistency reliability considers the degree of interrelat-edness among individual items, whereas test-retest reliability is concerned with the stability of scale scores across occasions. The evaluation of internal consistency reliability alone can often be inadequate, because no information on the stability of participants’responses is provided (Cortina, 1993; Crocker & Algina, 1986). Inconsistent measures of participants’responses may result in misleading scientific conclusions (Krosnick & Berent, 1993). It is there-fore essential to investigate the effect of scale design on test-retest reliability in addition to internal consistency reliability. Coefficient α has received more attention than test-retest reliability in the past (e.g., Aiken, 1983; Bandalos & Enders, 1996; Halpin, Halpin, & Arbet, 1994; Johnson, Smith, & Tucker, 1982; Jenkins & Taber, 1977; Ko, 1994; Komorita & Graham, 1965; Lissitz & Green, 1975; Masters, 1974; Matell & Jacoby, 1971; Oaster, 1989; Preston & Colman, 2000; Wong, Chuen, & Fung, 1993). Hogan, Benjamin, and Brezinski (2000) found that coefficient α was used in over two thirds of the tests they reviewed, and fewer than 20% of the tests reported test-retest reli-ability. The scarcity of previous studies on test-retest reliability is probably due to the necessity of repeatedly administering the same scale to identical participants. In contrast, the estimation of coefficient α requires only one administration of the measure.
Previous findings on the relationship between the number of response cat-egories and coefficient α have been inconsistent. Some researchers con-cluded that the number of response categories has no effect on coefficient α (e.g., Aiken, 1983; Wong et al., 1993); others found coefficient α to be affected by the number of options provided but offered different recommen-dations. For example, Matell and Jacoby (1971) suggested 2 or 3 response categories, Johnson et al. (1982) recommended a 3-point format, Ko (1994) and Oaster (1989) recommended 6- and 7-point scale designs, and Preston and Colman (2000) recommended 7 to 10 points. Bendig (1953) mended 9 response categories, and Champney and Marshall (1939) recom-mended as many as 18 response categories. Churchill and Peter (1984) focused on internal consistency reliability and found increasing reliability with more response categories in their meta-analysis of 108 marketing research studies. Jenkins and Taber (1977) and Lissitz and Green (1975) con-ducted simulation studies and suggested that 5 response categories are suffi-cient, because no substantial gains in reliability were observed after 5
catego-ries. However, the applicability of their results to empirical data might be limited because of their assumption of uniformly distributed item scores in the simulations (Micceri, 1989).
The relationship between the number of scale points and test-retest reli-ability is inconclusive as well. Among the few related studies, Jenkins and Taber (1977) and Lissitz and Green (1975) used simulated data, and Oaster (1989) used alternate forms measured in two sessions, which was in essence an alternate-form reliability estimate. Matell and Jacoby (1971) used scales with numbers of response categories ranging from 2 to 19 and suggested 2 or 3 options to be adequate. However, to incorporate the wide range of numbers of response categories in one single study, only 20 participants completed each form of the scale. Johnson et al. (1982) used the Job Descriptive Index with 3 and 5 response options. Fifty students participated in each condition. Although the 5-point scale discriminated among individuals better than the 3-point format, no substantial differences in test-retest reliability between the two formats were found. Preston and Colman (2000) instead asked a group of 149 participants to respond to the same scale, with the number of responses options ranging from 2 to 11 and 101, and they recommended at least 7 response categories to ensure stable participant responses.
Why did the influence of the number of response categories on reliability differ among studies? Item homogeneity may be a plausible explanation. Komorita and Graham (1965) studied the relationship between the number of scale points and the internal consistency reliability of scales under varying degrees of item homogeneity. The degree of item homogeneity was defined by the sizes of factor loadings on one single factor. Coefficient α was found to be independent of the number of scale points with homogeneous items. The sizes of factor loadings played a role in mediating the relationship between scale design and reliability. Scales of homogeneous items were likely to be less affected by the format used. When heterogeneous items are asked, a respondent would be likely to have differential degrees of propensity for each question. Increasing response options enables the respondent to map his or her response to the appropriate category and thus reduces inconsistent ran-dom errors and raises reliability. This hypothesis was to be tested in the pres-ent study by including scales of differpres-ent sizes of factor loadings. The scale with higher loadings was expected to be less affected by the number of response categories used.
In sum, most empirical research on the effects of response categories on the reliability of Likert-type rating scales has focused on internal consistency reliability. Simulation studies might be limited in providing appropriate sug-gestions to scale design because of the assumption of uniformly distributed scores. The effects of the number of response categories on the stability of scale scores as assessed by test-retest reliability, though important, have been less empirically researched and call for further investigation. Furthermore,
among the few empirical studies of test-retest reliability, different numbers of response categories have been recommended. The present study was there-fore designed to examine empirically how many response categories were needed to raise test-retest reliability and internal consistency reliability to desired levels simultaneously.
Why would the number of response categories be expected to affect test reliability? In considering the coarseness of categorization, Symonds (1924) described a parallel between psychological measurements and physical mea-surements. A physical measurement that used a scale finer than the limits of one’s eyesight is useless. Likewise, a psychological measurement is very likely to be of limited value if it uses a scale finer than a judge’s ability to dis-criminate. A scale that requires finer discrimination than the target respon-dents usually can accomplish may easily add measurement errors to test scores. Increasing the number of scale points does not necessarily lead to better discrimination of participants’judgment on personal attitudes or traits. For instance, an individual may have difficulty discriminating the difference between 8 and 9 on an 11-point scale. The respondent may check 8 on one occasion but 9 on another for an identical item. The inconsistency between the two sets of scores is then due to scale design rather than the trait being measured. On the other hand, a scale with few scale points may lose information on individual differences and lower the reliability estimates.
More recently, Tourangeau, Rips, and Rasinski (2000) proposed a model of survey response processes, and they share a similar view to the proposition of Symonds (1924). Four major components were identified in the model: comprehension of the item, the retrieval of relevant information, the use of the information to make judgments, and the selection and reporting of an answer. The specific process of mapping judgment onto response categories in the last component was related to the influences of scale format on partici-pant responses. With too few categories, the rating scales may fail to discrim-inate between respondents with different underlying judgments; with too many, respondents may fail to distinguish reliably between adjacent catego-ries. In either case, inconsistent random errors are likely to be introduced and lead to lower reliabilities.
In constructing a rating scale, in addition to how many response options to use, a researcher also determines what verbal labels are to be presented with the scale. Each response option of the scale can be labeled with a verbal description. For example, a 5-point rating scale can include labels such as strongly agree, agree, undecided, disagree, and strongly disagree. A rating scale can also be anchored with verbal labels of strongly agree and strongly disagree at only the end points of the scale. Participants’ responses on the basis of these two formats of anchor labels have been compared (e.g., Dickinson & Zellinger, 1980; Dixon, Bobo, & Stevick, 1984; Finn, 1972; French-Lazovik & Gibson, 1984; Frisbie & Brandenburg, 1979; Klockars &
Yamagishi, 1988; Lam & Klockars, 1982; Landrum, 1999; Newstead & Arnold, 1989; Wildt & Mazis, 1978). Most previous research has focused on the comparison of score distributions obtained from two forms, and some studies have investigated respondents’ preferences of label format. Landrum’s (1999) participants showed no difference in their confidence in answering a scale with every response option clearly specified and a scale with only end points defined. Dickinson and Zellinger’s (1980) respondents reported being more satisfied when more rating scale points were verbally labeled. Although Finn (1972) compared the reliability obtained from differ-ent forms, the effect of scale format on the stability of participants’responses across occasions was not examined.
Churchill and Peter’s (1984) meta-analysis suggested that rating scales with each response category clearly defined or with only end points labeled yielded similar reliabilities. However, whether their conclusions could be generalized to test-retest reliability was unclear because of their focus on internal consistency reliability. Moreover, Krosnick’s (1999) review of sur-vey research suggested that reliability could be significantly improved if all points on a scale are labeled with words, because they clarify the meanings of the scale points. Krosnick’s conclusion was drawn largely from his previous study with Berent (1993), in which data were collected through telephone interviews, face-to-face interviews, and self-administrated questionnaires. This study was insufficient in evaluating the effects of verbal labeling on rat-ing scales for two reasons. First, only one of the eight experiments conducted used self-administrated questionnaires, a frequently adopted method of data collection in educational and psychological research. Second, the experi-ment that used self-administrated questionnaires compared score consis-tency between a rating scale with two ends labeled and a branching scale with all response options defined. The branching format asked respondents to respond in two steps, first the direction and then the intensity. A comparison of partially and fully labeled rating scales would be more informative for educational and psychological research. With the limitations and the con-flicting conclusions from previous studies, these two frequently used formats of Likert-type rating scales were constructed in the present study to examine the effects of labeling on reliability. If each response category were clearly specified, participants would be less likely to change their interpretations of each response option from one occasion to another. Therefore, a rating scale with all the response categories verbally specified was expected to yield more stable participant responses and higher test-retest reliability than a scale with only end points labeled.
The purpose of the present research was twofold. First, the relationship between the number of response categories on rating scales and reliability was empirically studied. The types of reliability included test-retest reliabil-ity and internal consistency reliabilreliabil-ity, with the former being emphasized
because of the sparse past research on the topic. It was hypothesized that test-retest reliability would be lower with few response categories because of the loss of information. Test-retest reliability might also decrease with a large number of response categories if the degree of discrimination demanded were beyond the abilities of the participants. The mediating effect of item homogeneity on the relationship between the number of response categories and reliability, as suggested by Komorita and Graham (1965), was also tested. The reliability of scales composed of more homogeneous items, as indicated by higher factor loadings, was expected to be less affected by the number of response options used.
Second, the effect of two common forms of anchor labels on scale reliabil-ity was investigated. Churchill and Peter’s (1984) meta-analysis did not sup-port the hypothesis that scales on which all points were labeled would have higher reliability than scales on which only end points were labeled. Because their analysis gave primary emphasis to internal consistency reliability, and their results contradicted the conclusions of Krosnick (1999), these two forms of scales were constructed in this study to test the effects of anchor labels on test-retest reliability in addition to coefficient α. It was hypothe-sized that a scale with each anchor label clearly stated should lead to more stable participant responses over time, as represented by higher test-retest reliability, than a scale with only end points labeled.
Method
Instrumentation
Two subscales of the Teacher Attitude Test were used in the present study. The Teacher Attitude Test is used to select eligible students for the Teacher Education Program of National Taiwan University. Over the years, fewer than 20% of the applicants have been admitted to the program. Only those who successfully complete the program are qualified to apply for teaching positions in high schools and junior high schools. Therefore, finding the opti-mal scale format for the test was of practical importance in selecting the best candidates for potential schoolteachers.
Two of the essential dimensions of the Teacher Attitude Test were chosen for the present study: the Concern for Others scale (CO) and the Determina-tion scale (DE). The 12-item CO scale consisted of two related subcom-ponents: being sensitive to others’ emotions (e.g., “I can easily detect the emotional changes of my family members”) and being willing to share expe-riences with others (e.g., “I enjoy sharing my expeexpe-riences with others”). The DE scale included 13 items and measured applicants’determination to carry on in times of frustration and difficulty (e.g., “I take on obstacles as
chal-lenges to be overcome”). The original design used a 5-point scale with all response categories clearly labeled. The test was initially administered to more than 1,000 university students applying to the program. Preliminary factor analysis found the items of the two scales to load mainly on one factor, respectively. The factor loadings for the CO scale ranged from 0.43 to 0.74 (M = 0.58, SD = 0.09). The DE scale had factor loadings ranging from 0.56 to 0.81 (M = 0.67, SD = 0.08). The loadings for the DE scale were higher than the CO scale, suggesting that the items on the DE scale were more homogeneous than those on the CO scale (Komorita & Graham, 1965).
Every participant was asked to rate how well each statement described him or her. Two forms of each scale were constructed, one with each response category clearly labeled (the ALL form) and the other with only end points labeled (the END form). The labels were selected according to the scale val-ues estimated by Weng (1998). Weng computed the scale valval-ues for anchor labels commonly used in Chinese rating scales. The scale values based on the successive interval method (Edwards, 1957) were used to select appropriate anchor labels for the present study. Anchor labels that were approximately equally spaced and had small dispersion were selected for the ALL forms, with the number of scale points ranging from 3 to 8. For example, the 5-point scale adopted the labels does not describe me at all, does not describe me in general, can’t say, describes me in general, and describes me completely. The scale values based on the successive interval method for the 5 anchor labels were 0.066, 2.598, 5.163, 7.632, and 9.931, respectively. They were about equally spaced, with the differences between any two successive labels being 2.466, 2.532, 2.565, 2.469, and 2.299. The labels attached to two ends of the ALL forms were used to define the end points of the END forms. The number of response categories for the END forms ranged from 4 to 9. There was therefore a total of 12 combinations of number of response categories and anchor label format.
Participants
A total of 1,247 college students had complete data from two testing sessions in this study. This sample consisted of 78.6% of the original 1,587 students who filled out the questionnaires at the initial contact. Students received partial credit for introductory psychology courses or gifts for their participation in the experiment. The sample was homogeneous with regard to ethnicity and included 459 men and 788 women from 13 colleges in Taiwan. The number of participants who responded to each form of the scales is pre-sented in Table 1. About 100 participants took each scale form. The 8-point END form had 80 participants, being the smallest among the 12 samples. The sample for the 4-point END form was the largest, consisting of 121 individuals.
Design and Procedures
All participants responded to both the CO and DE scales, with items of the two scales mixed. The questionnaires were administered to the participants in groups. Each form of the scales was administered to the same group of par-ticipants twice to evaluate score stability over time (test-retest reliability). The two testing sessions were scheduled to be at least 4 weeks apart, ranging from 29 to 43 days, to avoid memory effects. The traits measured, determina-tion and concern for others, should not change dramatically within 4 to 6 weeks for college students.
Analyses
The equivalence of test scores across two administrations and between the ALL forms and the END forms was first evaluated prior to the assessment of scale reliability. Dependent t tests were performed to test if the means of the same form from two testing sessions were significantly different. Independ-ent t tests were performed to test whether the means of the ALL forms and the END forms were different. Internal consistency reliability was estimated by coefficient α. Test-retest reliability was assessed by Pearson’s correlation
Table 1
Mean, Standard Deviation, Coefficient , and Test-Retest Reliability of the Concern for Others Scale Session 1 Session 2 Number of Categories n M SD α M SD α r ALL form 3 98 28.74 3.07 .64 28.68 3.31 .70 .77 4 93 36.73 3.79 .70 36.58 3.43 .64 .76 5 101 45.59 4.91 .75 45.98 4.87 .78 .76 6 105 52.06 6.14 .73 51.86 6.32 .79 .82 7 91 60.11 8.49 .85 59.20 7.47 .81 .90 8 89 68.57 8.09 .81 67.91 8.67 .85 .86 χ2 21.92* 20.23* 16.95* END form 4 121 37.36 4.60 .72 37.58 4.48 .79 .72 5 116 45.81 4.77 .58 45.16 5.59 .74 .62 6 119 53.90 6.69 .77 52.99 6.86 .80 .83 7 117 60.95 8.56a .78 58.96 7.34 .75 .77 8 80 71.35 9.49 .76 71.03 8.37 .72 .70 9 117 79.52 11.58 .79 78.61 11.08 .82 .80 χ2 15.61* 7.04 15.74*
Note. The t statistic for the test of the equality of reliabilities represents the k-sample significance test for inde-pendent α coefficients and the test of equality of multiple indeinde-pendent correlations for r.
a. Means between two sessions were significantly different statistically (p < .01). *p < .01.
between scores of the same form from two testing sessions. The k-sample significance test for independent α coefficients proposed by Hakstian and Whalen (1976) was adopted to test the effects of the number of response cate-gories and anchor labels on coefficient α. The effects of these two manipu-lated factors on test-retest reliability were tested by the test of the equality of multiple independent correlations (Hays, 1994, p. 651). Because of the great number of statistical tests conducted in this research, the probability of mak-ing a Type I error on each test was constrained at .01 to guard against the pos-sible inflation of the experiment-wise error rate of the study.
Results
The means and standard deviations of each form of the CO and DE scales at two testing sessions are summarized in Tables 1 and 2. The means and stan-dard deviations of both scales increased as more response categories were used, regardless of the format of the anchor labels used. The standard devia-tions for the DE scale were larger than for the CO scale, indicating greater individual variation on the DE scale among college students. The standard deviations for the END forms were slightly larger than for the ALL forms in some cases.
Table 2
Mean, Standard Deviation, Coefficient , and Test-Retest Reliability of the Determination Scale
Session 1 Session 2 Number of Categories n M SD α M SD α r ALL form 3 98 30.42 4.54 .86 30.76 4.69 .89 .83 4 93 37.12 5.67 .89 37.20 5.63 .90 .85 5 101 44.24 7.00 .88 44.76 7.10 .91 .81 6 105 52.61 7.73 .86 52.97 8.09 .90 .78 7 91 57.81 9.98 .89 57.77 9.72 .91 .81 8 89 69.29 11.03 .91 68.82 11.87 .93 .89 χ2 6.19 5.30 7.89 END form 4 121 37.60 6.39 .89 38.03 6.11 .88 .78 5 116 45.66 7.16 .84 44.92 7.71 .88 .73 6 119 53.31 9.11 .88 53.49 8.79 .90 .83 7 117 60.10 11.02 .89 59.53 9.73 .88 .84 8 80 67.13 13.13 .88 67.79 13.28 .90 .71 9 117 76.94 17.24 .91 78.58 17.10 .93 .86 χ2 9.02 12.64 13.97
Note. The t statistic for the test of the equality of reliabilities represents the k-sample significance test for inde-pendent α coefficients and the test of equality of multiple indeinde-pendent correlations for r.
Statistical tests and associated measures of effect size were used to com-pare scale scores across various conditions. Dependent t tests were used to test the equivalence of scale means across two testing sessions. The results indicated that the means from two administrations of the same scales were not significantly different statistically, except for the CO scale on the 7-point END form, t(116) = 3.90, p < .01, d = .36, suggesting stable participant responses over time. Independent t tests were used to compare the first-ses-sion scale means between the ALL form and the END form that consisted of the same number of response options. The scale means from these two forms were also nonsignificantly different statistically, although some of the d mea-sures reached small effect sizes (Cohen, 1988). The format of the anchor labels appeared to have no effect on average participant responses on both scales.
CO Scale
Coefficient α at two testing sessions and test-retest reliability on both forms of the CO scale are presented in Table 1. The test statistics for testing equal reliability against differing numbers of response categories are also presented. The k-sample significance test for independent α coefficients pro-posed by Hakstian and Whalen (1976) was adopted to test the effects of the number of response categories on coefficient α statistically. This method for testing α coefficients under six independent conditions was distributed as a χ2distribution with 5 degrees of freedom under the null hypothesis of equal
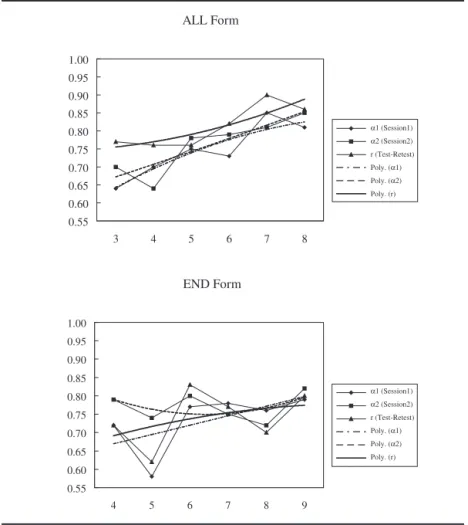
reliability. The null hypothesis was rejected statistically by three out of the four tests, suggesting that except for the END form at the second testing ses-sion, coefficient α values varied with the number of response categories used. The scales with more response categories tended to yield higher coefficient α values than those of fewer response options, as the fitted polynomial trend lines in Figure 1 suggest. The discrepancy of coefficient α values between two testing sessions decreased as the number of response options increased, suggesting less sampling variability of estimates of coefficient α with more response categories.
The k-sample significance test for independent α coefficients (Hakstian & Whalen, 1976) was again used to test the equality of coefficient α values between the ALL form and the END form of the same number of response options. The coefficients α values of these two forms were not significantly different statistically, except for the 4-point scale and the 8-point scale at the second testing session, indicating a similar size of coefficient α for both forms. Labeling each response option or labeling only the end points had no effect on coefficient α of the CO scale.
The test for the equality of multiple independent correlations (Hays, 1994, p. 651) was used to test the effect of the number of scale points and anchor
labels on test-retest reliability, as assessed by Pearson’s product–moment correlation coefficient. This test under six independent conditions of the number of response categories was distributed as a χ2distribution with 5
degrees of freedom under the null hypothesis of equal test-retest reliability. The null hypothesis was rejected for both forms of the CO scale, indicating a significant effect of the number of response categories on test-retest reliabil-ity. The polynomial trend lines fitted to the data suggested a rising trend of test-retest reliability with more response categories, especially for the ALL form, on which each response option was explicitly expressed. Scales with fewer than 6 response categories tended to yield low test-retest reliability.
The same statistical test (Hays, 1994, p. 651) was also adopted to test the equality of test-retest reliability between two scale formats, yielding a χ2
dis-tribution of 1 degree of freedom under the null hypothesis of equal reliability
ALL Form 0.55 0.60 0.65 0.70 0.75 0.80 0.85 0.90 0.95 1.00 3 4 5 6 7 8 END Form 0.55 0.60 0.65 0.70 0.75 0.80 0.85 0.90 0.95 1.00 4 5 6 7 8 9 α1 (Session1) α2 (Session2) r (Test-Retest) Poly. (α1) Poly. (α2) Poly. (r) α1 (Session1) α2 (Session2) r (Test-Retest) Poly. (α1) Poly. (α2) Poly. (r)
Figure 1. Reliability estimates and fitted polynomial trend lines as a function of the number of
between the ALL form and the END form. The null hypothesis was rejected with 7 and 8 response options and retained for scales of 4 to 6 points. The 7-and 8-point ALL forms yielded significantly higher test-retest reliability than the END forms, suggesting that with more response categories, participants’ responses on scales with each anchor label clearly specified were more stable than those on scales with only end points labeled.
In sum, for the CO scale, the number of response categories had an effect on coefficient α and test-retest reliability, whereas the format of the anchor labels showed no effect either on coefficient α, regardless of the number of scale points, or on test-retest reliability with 4 to 6 scale points. For scales with 7 and 8 response options, clearly specifying each response option yielded higher test-retest reliability than specifying the end points only. DE Scale
The reliability estimates for the DE scale with associated test statistics are summarized in Table 2. All the reliability estimates appeared high and of sim-ilar sizes, regardless of the number of response categories used and the design of the anchor labels. The identical statistical tests conducted for the CO scale were applied to the DE scale. None of the null hypotheses of equal coefficient α values across different numbers of response categories was rejected by the four tests, as indicated in Table 2, suggesting that the number of scale points had no effect on coefficient α. The 10 tests of differences between α coefficients obtained from the ALL from and the END form com-posed of the same number of response options all yielded statistically nonsignificant results, indicating equal coefficient α values across two forms of anchor labels for the DE scale. The results suggested that coefficient α of the DE scale, which had higher factor loadings than the CO scale, was inde-pendent of the number of response options offered and the format of anchor labels used.
The test of the equality of multiple independent correlations (Hays, 1994, p. 651) failed to reject the null hypothesis of equal test-retest reliability across different numbers of response categories for both forms. The test was again applied to test the equality of test-retest reliability between the ALL form and the END form of the same number of response options. The null hypothesis was rejected only when 8 response options were used. Test-retest reliability appeared independent of the number of options offered and the anchor labels provided, except for the 8-point scale. With the 8-point scale, the ALL form yielded higher test-retest reliability than the END form, indicating more sta-ble participant responses when all the scale points were clearly defined.
In sum, the internal consistency α coefficient and test-retest reliability for the CO scale tended to increase with more scale points. With 7 and 8 response options, test-retest reliability for the ALL form was higher than for the END form. The reliability of the DE scale, which had higher factor loadings than
the CO scale, was less affected by the number of scale points and the anchor label format adopted. Increasing the number of response categories raised both types of reliability of the CO scale but had no effect on the reliability of the DE scale. The mediating effect of item homogeneity, as indicated by dif-ferential sizes of factor loadings (Komorita & Graham, 1965), on the rela-tionship between number of scale points and reliability was supported in this study. The format of anchor labels had no effect on coefficient α for both the CO and DE scales. However, if more response options were used, the ALL form might yield higher test-retest reliability than the END form.
Discussion
Likert-type rating scales have been widely used for the assessment of par-ticipants’ responses and attributes. Careful scale design is essential for achieving satisfactory scale reliability and appropriate research conclusions (Krosnick & Berent, 1993). Compared with the vast research on the impact of scale design on reliability in the past, the present study is one of the few that have researched the relationship between scale design and test-retest reliabil-ity empirically. Because high internal consistency reliabilreliabil-ity, as commonly measured by coefficient α, does not necessarily guarantee high test-retest reliability (Cortina, 1993; Crocker & Algina, 1986), the impact of scale design on test-retest reliability warrants direct investigation. The present study empirically investigated the impact of scale properties on test-retest reliability in addition to internal consistency reliability on two subscales of the Teacher Attitude Test, used for selection purposes.
The present study suggests a differential impact of scale design on reli-ability. The reliability of the CO scale was affected by scale design, whereas the reliability of the DE scale was independent of the format of the scale used in general. The original hypothesis of the effect of the number of response categories being mediated by factor loadings was supported. The present study replicated the findings of Komorita and Graham (1965) that the reli-ability of scales with homogeneous items is less affected by the design of the scale format. In the present study, the DE scales had higher factor loadings than the CO scales and were less affected by not only the number of response categories but also the form of the anchor labels attached. The size of factor loading seemed to play a role in mediating the relationship between scale design and reliability. Scales of more homogeneous items were less affected by the format used. However, an examination of the relative sizes of the stan-dard deviations of both scales might offer another explanation for the differ-ences in reliability. Masters (1974) found that the reliability of the question-naire with larger individual variation was less affected by the number of response categories used. And in the present study, the DE scale of higher factor loadings happened to have larger standard deviations than the CO scale. The differences between reliability might result from the differential
degrees of individual differences demonstrated on the two traits measured. Further research is needed to clarify the influences of these two factors on the relationship between scale design and reliability.
The results of the present research indicated that reliability did not neces-sarily level off after 5 categories, as the simulations of Lissitz and Green (1975) and Jenkins and Taber (1977) demonstrated. The recommendations based on the simulated uniformly distributed scores should not be routinely applied in designing Likert-type scales for empirical investigations.
Halpin et al. (1994) suggested that the best choice of the number of scale points depends largely on the content measured in the scale. However, a researcher can avoid adopting a scale format that is likely to yield low reli-ability. The suggestion proposed by Matell and Jacoby (1971) that 2 or 3 cat-egories should be enough for sufficient reliability needs qualification. The results of this study favor the conclusions of Preston and Colman (2000) that more than 3 response options are needed to achieve stable participant responses. The small sample size in Matell and Jacoby’s study might have led to unstable conclusions. The present investigation with larger samples indi-cates that although fewer scale points is not necessarily paired with lower reliability, scales with more categories have a better chance of attaining higher reliability.
A larger number of scale points was shown to pair with smaller standard errors of reliability estimates in Lissitz and Green’s (1975) simulation. Reli-ability estimates of more categories have less dispersion and result in better stability across samples. Decreasing dispersion with an increasing number of response categories was observed in the present study with the CO scale. Reliability estimates with few categories tend to fluctuate from sample to sample. A rating scale with fewer than 5 scale points should therefore be dis-couraged if possible. As for the optimal number of scale points, researchers have to take into account the cognitive discriminating ability of the target population (Andrich & Masters, 1988; Komorita & Graham, 1965; Krosnick, 1999). Some suggestions are in line on the basis of the results of the present study. If the cognitive ability of the participants is close to that of college students, an odd-numbered, 7-point scale and an even-numbered, 6-point scale should be able to provide consistent and reliable participant responses. Whether these suggestions apply to other populations of less cognitive sophistication requires further investigation.
The hypothesis that the full specification of response options improves reliability was only partially supported in the present study. The effect of anchor labels on scale reliability depended on the type of reliability esti-mated. The α coefficients of both forms were similar, replicating Churchill and Peter’s (1984) findings of no difference between the reliability estimates with the ALL forms and END forms when internal consistency reliability was considered. Considering the stability of scores as represented by test-retest reliability, the ALL form scale outperformed the END form scale when
more response options were given, as Krosnick and Berent (1993) demon-strated in their study of the consistency of political attitudes over time. Although coefficient α appeared independent of the format of verbal labels attached, a scale with each anchor label clearly specified should be preferred to achieve consistent and stable participant responses. Moreover, with the frequent use of 7-point scales in psychological and management studies (Wang & Weng, 2002), a full specification of response options increases the likelihood of inducing stable participant reaction on the measures.
Clearly stating each anchor label has another advantage of enhancing interpretation of measurement results. Take a group mean of 2.1 on a 7-point scale as an example. The ALL form gives a better sense of what the average represents than the END form. Interpreting the meaning of an average of 2.1 on the END form is a tricky task for readers. Readers may have different interpretations. Take a mean of 2.5 as another example. A mean of 2.5 indi-cates that on average, participant responses locate in between the labels attached to 2 and 3 on the ALL form. The interpretation of a mean of 2.5 will be difficult and ambiguous on an END form scale. Therefore, clearly specify-ing each response category verbally should be encouraged, as suggested by Krosnick (1999), to improve test reliability and to facilitate the interpretation of study results.
The evaluation of only internal consistency reliability in scale develop-ment is apparently inadequate for understanding scale reliability. Coefficient α, the frequently used internal consistency reliability estimate, provides little information on the stability of participant responses (Cortina, 1993; Crocker & Algina, 1986; Jenkins & Taber, 1977). Test-retest reliability, which assesses the stability of participants’ responses over time, should be evalu-ated in addition to internal consistency reliability. Although the assessment of test-retest reliability requires at least two administrations of the scale and demands more time and effort than the assessment of internal consistency reliability, a scale with low test-retest reliability may lead to inappropriate conclusions (Krosnick & Berent, 1993). Scale developers should make every effort to evaluate test-retest reliability over and above internal consistency reliability.
References
Aiken, L. R. (1983). Number of response categories and statistics on a teacher rating scale.
Edu-cational and Psychological Measurement, 43, 397-401.
Andrich, D., & Masters, G. N. (1988). Rating scale analysis. In J. P. Keeves (Ed.), Educational
research, methodology, and measurement: An international handbook (pp. 297-303).
Ox-ford, UK: Pergamon.
Bandalos, D. L., & Enders, C. K. (1996). The effects of nonnormality and number of response categories on reliability. Applied Measurement in Education, 9, 151-160.
Bendig, A. W. (1953). The reliability of self-ratings as a function of the amount of verbal anchor-ing and of the number of categories. Journal of Applied Psychology, 37, 38-41.
Champney, H., & Marshall, H. (1939).Optimal refinement of the rating scale. Journal of Applied
Psychology, 23, 323-331.
Churchill, G. A., Jr., & Peter, J. P. (1984). Research design effects on the reliability of rating scales: A meta-analysis. Journal of Marketing Research, 21, 360-375.
Cohen, J. (1988). Statistical power analysis for the behavioral sciences (2nd ed.). Hillsdale, NJ: Lawrence Erlbaum.
Cortina, J. M. (1993). What is coefficient alpha? An examination of theory and applications.
Journal of Applied Psychology, 78, 98-104.
Crocker, L., & Algina, J. (1986). Introduction to classical and modern test theory. New York: Holt, Rinehart & Winston.
Dickinson, T. L., & Zellinger, P. M. (1980). A comparison of the behaviorally anchored rating and mixed standard scale formats. Journal of Applied Psychology, 65, 147-154.
Dixon, P. N., Bobo, M., & Stevick, R. A. (1984). Response differences and preferences for all-category-defined and end-defined Likert formats. Educational and Psychological
Measure-ment, 44, 61-66.
Edwards, A. L. (1957). Techniques of attitude scale construction. New York: Irvington. Finn, R. H. (1972). Effects of some variations in rating scale characteristics on the means and
reliabilities of ratings. Educational and Psychological Measurement, 32, 255-265. French-Lazovik, G., & Gibson, C. L. (1984). Effects of verbally labeled anchor points on the
dis-tributional parameters of rating measures. Applied Psychological Measurement, 8, 49-57. Frisbie, D. A., & Brandenburg, D. C. (1979).Equivalence of questionnaireitems with varying
re-sponse formats. Educational and Psychological Measurement, 16, 43-48.
Hakstian, A. R., & Whalen, T. E. (1976). A k-sample significance test for independent alpha co-efficients. Psychometrika, 41, 219-231.
Halpin, G., Halpin, G., & Arbet, S. (1994). Effects of number and type of response choices on in-ternal consistency reliability. Perceptual and Motor Skills, 79, 928-930.
Hays, W. L. (1994). Statistics (5th ed.). Orlando, FL: Harcourt Brace.
Hogan, T. P., Benjamin, A., & Brezinski, K. L. (2000). Reliability methods: A note on the fre-quency of use of various types. EducationalandPsychological Measurement, 60, 523-531. Jenkins, G. D., Jr., & Taber, T. D. (1977). A Monte Carlo study of factors affecting three indices
of composite scale reliability. Journal of Applied Psychology, 62, 392-398.
Johnson, S. M., Smith, P. C., & Tucker, S. M. (1982). Response format of the Job Descriptive In-dex: Assessment of reliability and validity by the multitrait-multimethod matrix. Journal of
Applied Psychology, 67, 500-505.
Klockars, A. J., & Yamagishi, M. (1988). The influence of labels and positions in rating scales.
Journal of Educational Measurement, 25, 85-96.
Ko, Y.-H. (1994). A search for a better Likert point-scale for Mental Health Questionnaires.
Psy-chological Testing, 41, 55-72.
Komorita, S. S., & Graham, W. K. (1965). Number of scale points and the reliability of scales.
Educational and Psychological Measurement, 15, 987-995.
Krosnick, J. A. (1999). Survey research. Annual Review of Psychology, 50, 537-567. Krosnick, J. A., & Berent, M. K. (1993). Comparisons of party identification and policy
prefer-ences: The impact of survey question format. American Journal of Political Science, 37, 941-964.
Lam, T. C. M., & Klockars, A. J. (1982).Anchorpointeffects on the equivalence of questionnaire items. Journal of Educational Measurement, 19, 317-322.
Landrum, R. E. (1999). Scaling issues in faculty evaluations. Psychological Reports, 84, 178-180.
Likert, R. (1932). A technique for the measurement of attitudes. Archives of Psychology, 22, 5-55.
Likert, R., Roslow, S., & Murphy, G. (1934). A simplified and reliable method of scoring the Thurstone attitude scales. Journal of Social Psychology, 5, 228-238.
Lissitz, R. W., & Green, S. B. (1975). Effect of the number of scale points on reliability: A Monte Carlo approach. Journal of Applied Psychology, 60, 10-13.
Masters, J. R. (1974). The relationship between number of response categories and reliability of Likert-type questionnaires. Journal of Educational Measurement, 11, 49-53.
Matell, M. S., & Jacoby, J. (1971). Is there an optimal number of alternatives for Likert scale items? Study I: Reliability and validity. Educational and Psychological Measurement, 31, 657-674.
Micceri, T. (1989). The unicorn, the normal curve, and other improbable creatures.
Psychologi-cal Bulletin, 105, 156-166.
Newstead, S. E., & Arnold, J. (1989). The effect of response format on ratings of teaching.
Edu-cational and Psychological Measurement, 49, 33-43.
Oaster, T. R. F. (1989). Number of alternatives per choice point and stability of Likert-type scales. Perceptual and Motor Skills, 68, 549-550.
Preston, C. C., & Colman, A. M. (2000). Optimal number of response categories in rating scales: Reliability, validity, discriminating power, and respondent preferences. Acta Psychologica,
104, 1-15.
Symonds, P. M. (1924). On the loss of reliability in ratings due to coarseness of the scale. Journal
of Experimental Psychology, 7, 456-461.
Tourangeau, R., Rips, L. J., & Rasinski, K. (2000). The psychology of survey response. Cam-bridge, UK: Cambridge University Press.
Wang, C.-N., & Weng, L.-J. (2002). Evaluating the use of exploratory factor analysis in Taiwan: 1993-1999. Chinese Journal of Psychology, 44, 239-251.
Weng, L.-J. (1998). Scale values of anchor labels in Chinese rating scales: Responses on fre-quency and agreement. Chinese Journal of Psychology, 40, 73-86.
Wildt, A. R., & Mazis, M. B. (1978). Determinants of scale response: Label versus position.
Journal of Marketing Research, 15, 261-267.
Wong, C.-S., Chuen, K.-C., & Fung, M.-Y. (1993). Differences between odd and even number of response scale: Some empirical evidence. Chinese Journal of Psychology, 35, 75-86.