Ming-Mu Hsieh Chien-En Hsu Wei-Lung Tseng Huan-Tsung Chang Department of Chemistry, National Taiwan University, Taipei, Taiwan
Amplification of small analytes in polymer solution
by capillary electrophoresis
We report concentration methods for the analysis of small solutes by capillary electro-phoresis in conjunction with laser-induced native fluorescence using a Nd:YAG laser. After injecting samples, poly(ethylene oxide) (PEO) in the anode reservoir entered a capillary filled with Tris-borate buffer. When migrating in PEO solution, the analytes slowed down and stacked at the interface between the sample zone and PEO solution. As a result, the limits of detection (LODs) down to 8 pMfor 2-naphthalenesulfonic acid and 70 pM forL-tryptophan have been achieved when injecting at 30 cm height for 120 s and 230 s, respectively. Such low LODs are partially due to the effects of NaCl in the samples and PEO on the fluorescence characteristics of the analytes. In addi-tion, the concentrations of NaCl and PEO have great impacts on the migration of the analytes and electroosmotic flow, thereby affecting resolution and speed. Without pre-treatment, the determinations of five important markers in urine samples and two acids in a cerebrospinal fluid sample have been performed separately, with the relative stan-dard deviations of the concentrations less than 3.6%. Furthermore, by applying a short plug of low-pH buffer after injection, the analysis of greater volumes of the urine sample has been carried out, resulting in detecting more peaks.
Keywords: Capillary electrophoresis / Catecholamines / Laser-induced fluorescence / Polymer
solution EL 4966
1 Introduction
Following the success of the human genome project effort, a number of other “omic” disciplines have emerged, including proteomics, pharmaconomics, meta-bolomics, with a goal toward the analysis of the compo-nents of a living organism in its entirety [1–3]. In compar-ison to genomics, metabolomics, aiming to obtain a com-plete set of metabolites, is more difficult because its patterns change, depending on factors such as the stage of development of an organism and the organism’s phy-siological states. Other difficulty is that their amounts can-not be amplified by polymerase chain reaction, thus a highly sensitive method is extremely needed. Besides, it is not easy to complete a set of metabolites because the determination of a vast number of small analytes, includ-ing organic and inorganic neutral molecules and ions, with
concentrations ranging several orders of magnitude may be required. Thus, techniques allowing sensitive and high-resolution analysis of small solutes are highly demanded.
Capillary electrophoresis (CE) has been often promised as a viable and easy-to-use tool for analysis of small solutes for more than two decades [4–6]. It, however, suffers from poor concentration detection due to a small sample volume and a short optical path length when utilizing any optical detection methods. For instance, the limits of detection (LODs) for common solutes are generally on the order ofmM using UV-Vis absorption [7]. In order to improve sensitivity, laser-induced fluorescence (LIF) with tedious derivatization processes is commonly employed [8]. To prevent problems associated with derivatization, UV lasers have been used for the analysis of macromole-cules and small solutes [9–13].
On-line concentration techniques are alternative for improving sensitivity, which can be promoted through dif-ferences in pH, conductivity, salt content, viscosity, and additive concentration [14–17]. The focusing efficiency relies on specific modification of the composition of the electrolyte relative to the background electrolyte. Gener-ally, it is much easier and straightforward for the concen-tration of analytes prepared in low-conductivity media than in high-conductivity media, because salt could cause Joule heating, loss of resolution and poor stacking [18, 19]. However, in view of life science, techniques Correspondence: Dr. Huan-Tsung Chang, Department of
Chem-istry, National Taiwan University, Taipei, Taiwan, R.O.C.
E-mail: [email protected] Fax:1886-2-23621963
Abbreviations: 5-A-1-N, 5-amino-1-naphthol; 7-A-4-H-2-NSA,
7-amino-4-hydroxy-2-naphthalenesulfonic acid; CF, concentra-tion factor; CSF, cerebrospinal fluid; 1,3-DHN, 1,3-dihydroxy-naphthalene; 5-HIAA, 5-hydroxyindole-3-acetic acid; 5-HT, 5-hydroxytryptamine; HVA, homovanillic acid; 3-IXS, 3-indoxyl sulfate; 1-NAA, 1-naphthylacetic acid; 2-NSA, 2-naphthalene-sulfonic acid; PEO, poly(ethylene oxide); TB, Tris-borate; TP, Tris-propanate; VMA,DL-vanillomandelic acid
WILEY-VCH Verlag GmbH, 69451 Weinheim, 2002 0173-0835/02/1106–1633 $17.50+.50/0
CE
and
method requires a leading buffer (at the detector side) and a terminating buffer (at the injection side) in two sides of the sample plug and has been applied to the analysis of analytes, with 100 to 1000-fold improvements in sensitiv-ity [20, 21]. Acetonitrile-salt mixtures have been employed for the analysis of peptides in plasma, with at least a 20-fold enhancement in sensitivity [22]. Another interesting example is that, after sample injection, an acidic or basic buffer was applied to generate pH changes for concen-tration of analytes prepared in high-conductivity media [23]. Concentration of small analytes has also been car-ried out in the presence of micelles that stack in the back-ground electrolyte prior to interactions with neutral ana-lytes prepared in high-salt media [24, 25]. Recently, dynamic pH junctions generated in a multisection electro-lyte system have been demonstrated for concentration of small solutes [26, 27].
Herein, we developed a technique, similar to the one used for concentration and separation of macromolecules [28– 30], for the analysis of small solutes using polymer solu-tions. When migrating from the sample zone to polymer solutions, the solutes slowed down and thus stacked. In this study, our efforts were also made to explore factors, such as pH, salt, and concentration of PEO, on resolution, migration time and stacking. In addition, the developed method was applied to the determination of some impor-tant markers such as amine metabolites in urine and cer-ebrospinal fluid (CSF).
2 Materials and methods
2.1 Apparatus
The basic design of the separation system has been pre-viously described [29]. Briefly, a high-voltage power sup-ply (Gamma High Voltage Research, Ormond Beach, FL, USA) was used to drive electrophoresis. The entire detec-tion system was enclosed in a black box with a high-volt-age interlock. High-volthigh-volt-age end of the separation system was put in a home-made plexiglass box for safety. An Nd:YAG laser with 266 nm, 3000 Hz output from Conti-nuum (model: EPO-5000; Santa Clara, CA, USA) was used for excitation. One UG 5 filter from Melles Griot (Irvine, CA, USA) was used to block 532 nm lights from the laser. The emission light was collected with a 106objective (numeric aperture = 0.25). One UG 1 filter from Edmund (Barrington, NJ, USA) was used to block scattered lights before the emitted light reached the photomultiplier tube (Hamamatsu R928). The amplified
puter. Capillaries (Polymicro Technologies, Phoenix, AZ, USA), 75mm ID 6 365 mm OD, were used for the analysis of small solutes without any further coating process.
2.2 Materials
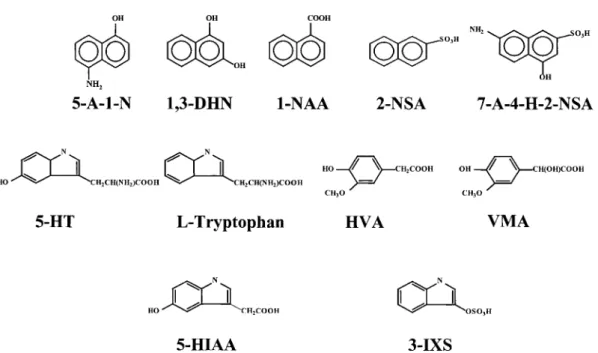
Human serum albumin (HSA) was from Sigma Chemical (St. Louis, MO). 5-Amino-1-naphthol (5-A-1-N), 1,3-di-hydroxy-naphthalene (1,3-DHN), 1-naphthylacetic acid (1-NAA), 2-naphthalenesulfonic acid (2-NSA), 7-amino-4-hydroxy-2-naphthalenesulfonic acid (7-A-4-H-2-NSA), L-tryptophan, 5-hydroxytryptamine (5-HT), 5-hydroxyin-dole-3-acetic acid (5-HIAA), homovanillic acid (HVA), DL-vanillomandelic acid (VMA), 3-indoxyl sulfate (3-IXS) and all chemicals for preparing buffer solutions were obtained from Aldrich (Milwaukee, WI, USA). TB buffers prepared from Tris were adjusted with boric acid to pH 10, 9, and 8, respectively. Herein,6 mMTB buffer means 6 mM Tris solution adjusted with suitable amounts of boric acid. PEO (Mr 8 000 000) solutions were prepared in TB buffer, pH 9 [28]. The analytes were separately pre-pared in 25 mM TB, pH 10, with original concentrations of 0.5 mM. Prior to analysis, they were mixed and diluted to suitable concentrations with 25 mMTB, pH 10, unless noted.
2.3 Optimization of PEO concentration
New capillaries were treated with 0.5MNaOH overnight. Prior to analysis, the base was flushed out with 400 mM TB buffer, pH 10, by pressure means for 20 s. Samples were injected into the capillary filled with TB buffers, pH 10, in the anodic end by hydrodynamic injection at 30 cm height for 10 s. After sample injection, the anodic end of the capillary was immersed in PEO solution that entered the capillary by electroosmotic flow (EOF) when applying an electric field of 375 V/cm. A number of PEO solutions prepared in 200 mMTB buffer, pH 9, with con-centrations over a range of 0–2.0%, were investigated for optimum conditions. After each run, the capillary was washed with 0.5M NaOH at 1 kV for 10 min to remove polymer solutions and refresh the capillary wall.
2.4 On-line concentration and separation
The on-line concentration method has been previously described [29]. Briefly, the capillaries were filled with 1M TB buffer, pH 10, for better stacking and more rapid ana-lysis. The samples were mixed and diluted with 25 mMTB
Figure 1. Chemical structures of the solutes analyzed in this work.
buffers, pH 10, containing certain amounts of NaCl. The effect of salt on stacking efficiency was tested in the range of 1–100 mM. The samples were then injected at 30 cm height for 10–230 s and the separation was con-ducted at 375 V/cm. When the analytes migrating against EOF entered PEO solution, they slowed down and stacked due to decreases in the electrophoretic mobility. After each run, the capillary was treated as shown above.
2.4 Urine and CSF
The conditions used to perform the analysis of urine and CSF samples were similar to that described in Section 2.3 unless described. Without any pretreatment, the urine samples obtained from a normal male were directly injected at 30 cm height for certain times (10–180 s) to the capillary filled with 1 or 1.5MTB buffer, pH 10. The on-line concentration and separation of the urine samples was conducted either in 2.0 or 1.5% PEO prepared in 200 mMTB buffer, pH 9. To determine the concentration of the markers, we spiked standards into the urine sam-ples and the peak heights for the analytes were used for quantification. To increase the injection volume, a short plug of TP buffer consisting of Tris and propanic acid, pH 7, was injected at 30 cm height for 10 s after injecting the urine sample. The CSF sample was collected from the L4-L5 interspace of an infant by lumbar puncture. Prior to analysis, the CSF sample was stored at –807C. The CSF sample was directly injected in a 40 cm capillary filled
with 1.5MTB buffer, pH 10, at 30 cm height for 10 or 80 s and subsequently the analysis was conducted at 15 kV using 1.7% PEO prepared in 200 mMTB buffer, pH 9.
3 Results and discussion
3.1 Separation dependency of PEO
There are only few examples showing separations of small solutes using polymer solutions in CE although they have addressed that the resolution increases due to interactions with polymer molecules [31–34]. To evaluate the effect of the polymer concentration on separating the five organic compounds (structures shown in Fig. 1), Figs. 2A-D were depicted, showing that a complete separation was only achieved in 2% PEO. Please note that the five peaks were not resolved in TB buffers (with-out PEO) at pH values ranging from 8 to 10. We reasoned that the increase in resolution is mostly due to increases in differences in migration times between any two adjacent analytes and possible interactions, such as hydrogen bonding and hydrophobic patches, with PEO molecules. A similar result has been shown in improved resolution due to hydrogen bonding between polyethylene glycol chains of the polymer and carboxylic groups or hydroxyl groups of small solutes [32]. As a result of increases in the viscosity and dynamic adsorption of PEO molecules on the capillary wall as PEO concentrations were increased, leading to small EOF mobilities, longer migration times
Figure 2. Effect of PEO solutions on separating five model organic solutes using a capillary filled with 400 mM TB buffers, pH 10, at 15 kV. [PEO] = 0% in (A), 0.05% in (B), 1% in (C), 2% in (D). The PEO solutions were prepared in 200 mMTB buffers, pH 9. Capillary, 40 cm in total length and 30 cm in effective length. Hydrodynamic injection was performed at 30 cm height for 10 s. Peak identities (concentration): 1, 5-A-1-N (10mM), 2, 1,3-DHN (0.2 mM), 3, 1-NAA (15mM), 4, 2-NSA (2mM), 5, 7-A-4-H-2-NSA (30mM).
were found as expected [35]. The relative standard devia-tion (RSD) for the migradevia-tion times of 7-A-4-H-2-NSA was less than 2% using 2% PEO, implying that PEO adsorp-tion did not cause serious memory effects. In other words, the use of 0.5MNaOH to wash the capillary after each run is effective to refresh the surface. Another benefit of using PEO solutions is that the sensitivity was further improved, supported by the fact that the LODs at a signal-to-noise ratio (S/N) = 3 for 5-A-1-N were 25 and 250 nM in 2% PEO and in TB buffer, respectively.
3.2 Stacking efficiency
Once PEO entered the capillary, the analytes with nega-tive charges migrated into the more viscous zone. As a result, the electrophoretic mobility of the analytes
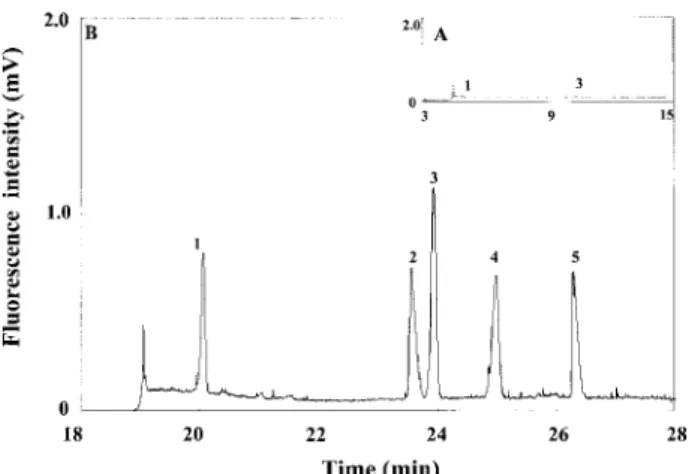
de-Figure 3. Analysis of five model organic solutes in the presence of EOF at 15 kV using 2% PEO prepared in 200 mM TB solutions, pH 9. Hydrodynamic injections were performed at 30 cm height for 10 s in (A) and 230 s in (B), respectively. Peak identities (concentration): 1, 5-A-1-N (0.5mM), 2, 1,3-DHN (6.25mM), 3, 1-NAA (0.125mM), 4, 2-NSA (50 nM); 5, 7-A-4-H-2-NSA (1mM). The capillary was filled with 1M TB buffer, pH 10. Other conditions were as in Fig. 2.
creased, resulting in stacking at the interface between the sample zone and PEO solution. On the basis of our knowledge learned from previous experiments [28–30, 36], instead of 400 mM TB, 1M TB was used to fill the capillary for better stacking. Figure 3 clearly shows five resolved and sharp peaks when injecting at 30 cm height for 230 s (about 0.88mL), indicating the analytes stacked. The linear regression coefficients for all model analytes in the injection range of 5–230 s were higher than 0.990 and the theoretical plates were higher than 0.77 million/m. As shown in our previous studies, the migration times increased with increasing injecting length because of greater PEO adsorption at low ionic strengths [29]. Please note that, without PEO solution, the peaks became ex-tremely broad and the resolution was lost when injecting greater than 15 s. The features of this new method are further tabulated in Table 1, which shows the LOD (S/N = 3) for 2-NSA was 30 pM, with a concentration factor (CF) of 333. Herein, CF is defined as the ratio of the LOD obtained by 5 s injection to that by 230 s injection under the same condition. For the solute (5-A-1-N) with a less charge density and amino group, the stacking was more effective (1000-fold), indicating the existence of interac-tions with PEO molecules.
3.3 Matrix effect
As mentioned above that PEO adsorption decreased with increasing the ionic strength of the samples, a more rapid analysis could only be achieved at higher ionic strengths.
Table 1. LOD values for the analytes achieved under different conditions LOD (n = 3) (%RSD) mMa) b) c) nMb) c) d) nMb) d) e) CF nMd) e) f) CF nMd) e) g) CF 5-A-1-N 0.25 (2.5) 25.00 (3.2) 0.25 (3.5) 1000 0.50 (3.2) 500 30.00 (3.2) 8 1,3-DHN 1.50 (3.2) 300.00 (3.8) 4.00 (4.3) 375 10.00 (3.9) 150 15.00 (3.7) 100 1-NAA 0.025 (2.8) 5.00 (2.9) 0.09 (4.5) 278 0.05 (4.0) 500 0.06 (3.7) 417 2-NSA 0.01 (3.5) 2.50 (3.7) 0.03 (4.3) 333 0.01 (4.2) 1000 0.008 (4.1) 1250 7-A-4-H-2-NSA 1.00 (3.9) 500.00 (3.2) 10.00 (4.7) 100 6.00 (4.5) 167 12.00 (4.3) 83
a) The separation was conducted in 400 mMTB, pH 10. b) Samples were dissolved in 25 mMTB buffers, pH 10. c) Samples were injected at 30 cm height for 5 s.
d) The separation was conducted in 2% PEO, pH 9, using the capillary filled with 1MTB buffer, pH 10. e) Samples were injected at 30 cm height for 230 s.
f) Samples were dissolved in 25 mMTB buffers, pH 10, containing 10 mMNaCl. g) Samples were dissolved in 25 mMTB buffers, pH 10, containing 100 mMNaCl.
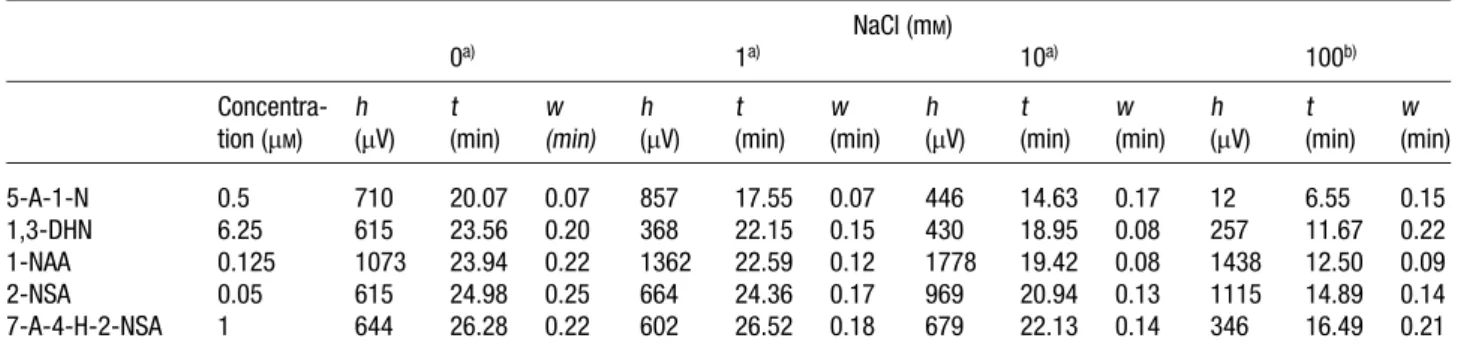
Table 2. Salt impact on the peak height (h), migration time (t), and peak width (w) NaCl (mM) 0a) 1a) 10a) 100b) Concentra-tion (mM) h (mV) t (min) w (min) h (mV) t (min) w (min) h (mV) t (min) w (min) h (mV) t (min) w (min) 5-A-1-N 0.5 710 20.07 0.07 857 17.55 0.07 446 14.63 0.17 12 6.55 0.15 1,3-DHN 6.25 615 23.56 0.20 368 22.15 0.15 430 18.95 0.08 257 11.67 0.22 1-NAA 0.125 1073 23.94 0.22 1362 22.59 0.12 1778 19.42 0.08 1438 12.50 0.09 2-NSA 0.05 615 24.98 0.25 664 24.36 0.17 969 20.94 0.13 1115 14.89 0.14 7-A-4-H-2-NSA 1 644 26.28 0.22 602 26.52 0.18 679 22.13 0.14 346 16.49 0.21
a) Samples were injected at 30 cm height for 230 s; other conditions were as in Fig. 3. b) Samples were injected at 30 cm height for 120 s.
Table 2 shows the migration times for 7-A-4-H-2-NSA were 26.28 min and 22.13 min when the samples were prepared in 25 mMTB buffers without and with contain-ing 10 mM NaCl, respectively. Although it has been shown that peak broadening occurred due to Joule heat-ing and poor stackheat-ing when injectheat-ing sample prepared in high-conductivity media [23], the impact was not marked, mainly because the diffusion was less profound and stacking took place in viscous PEO solution. Appar-ently, Table 2 does not show a clear trend of the salt impact on the fluorescence intensity. It is presumably because not only did salts affect stacking efficiency, but also affected the quantum yields of some analytes [37]. For 2-NSA, we have found that the peak height increased (peak width decreased) with increasing the salt concentration. This is due to less diffusion problems (short migration time) and weaker interactions with the capillary wall at high salts. However, an opposite result was found in 5-A-1-N containing an amino group, mostly due to salt quenching, supported by a similar result shown in 7-A-4-H-2-NSA.
Table 1 further shows the LOD for 2-NSA was 10 pMwhen injecting 0.88mL of the sample prepared in 25 mMTB buf-fers containing 10 mMNaCl, with reasonable reproducibil-ity. The RSD values of the migration time and the peak heights for all solutes were less than 2% and 4.7%, respectively. Strikingly, the LOD for 2-NSA was 8 pM when injecting 0.43mL of the sample prepared in 25 mM TB buffers containing 100 mMNaCl. It is noteworthy that the sensitivity was improved by 1250-fold compared to that obtained in TB free buffer by a hydrodynamic injec-tion at 30 cm height for 5 s. We suspected that sample self-stacking (chloride) was also a contributor for high sensitivity [38]. However, an effort made to improve sensi-tivity by injecting greater sample volumes was failed, mostly because of Joule heating.
3.4 Separation of indoles
As mentioned in Section 1, this work also aimed to develop a method with the potential for metabolomics. To test the possibility, we started from applying the
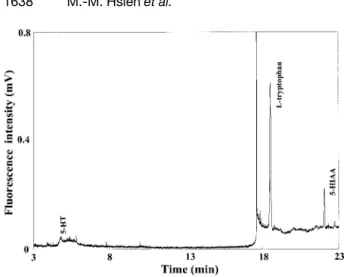
devel-Figure 4. Analysis of 5-HT, L-tryptophan, and 5-HIAA in the presence of EOF at 15 kV using 2% PEO, pH 9. [5-HT] = 10 nM, [L-tryptophan] = 20 nM, and [5-HIAA] = 10 nM. Hydrodynamic injection was performed at 30 cm height for 230 s. Other conditions were as in Fig. 3.
oped method for the analysis of a sample containingL -tryptophan, 5-HT, and 5-HIAA that are heterocyclic amine compounds and present in cells and extracellular fluids of living organisms. The determination of these analytes in nervous tissues, blood, and urine is of considerable importance and interest because they are neurotransmit-ters and are markers associated with many diseases, such as physiology of mental illness and neurological dis-orders [39]. Figure 4 depicts the separation of 5-HT, L -tryptophan, and 5-HIAA with hydrodynamic injection at 30 cm height for 230 s. Since 5-HT, with partial positive charges, did not enter the PEO zone, and thus did not stack well at the interface between the sample zone and PEO solution. As a result, band broadening occurred when injecting for more than 60 s. The LOD values for 5-HT were 20 nMand 4 nM, when hydrodynamic injections were carried out at 30 cm height for 5 and 60 s, respec-tively. It should be pointed out that stacking still occurred due to a field amplification and pH junction. On the other hand,L-tryptophan and 5-HIAA entered the PEO solution and did stack up to 230 s injection, resulting in the LOD values down to 70 and 90 pM, respectively. The sensitivity improvement forL-tryptophan was about 300-fold com-pared to that in TB buffer by conventional injection (5 s). The linear relationships between the peak heights forL -tryptophan and 5-HIAA and injection times were found, with R2 = 0.995 and 0.985, respectively. With the LOD less than nM, it is thought that this new method is useful for analysis of biological samples. In comparison to CW UV argon-ion laser, Nd:YAG laser provides about 10 times higher LOD (tens to hundreds nM) for amines and acids in solutions without PEO, but it is much cheaper and almost
Figure 5. Analysis of a CSF sample in the presence of EOF at 15 kV using 1.7% PEO, pH 9. The capillary was filled with 1.5MTB, pH 10. The injections of a CSF sample were conducted at 30 cm height for 10 s in the upper panel and 80 s in the main frame, respectively. X1and X2 are two unidentified peaks. Peaks marked as arrow bars were only detected when performing on-line concentra-tion. Other conditions were as in Fig. 3.
free from maintenance. Although the developed on-line concentration method is simple, free from contamination, and sensitive when compared with derivatization meth-ods, it is only suitable for analytes with intrinsic fluores-cence characteristics.
3.5 Analysis of CSF
The measurement of metabolites HVA and 5-HIAA in CSF has received great attention for indirect accesses of the central nervous system activity of dopamine and seroto-nin in schizophrenia research for approximately two dec-ades [40]. Without stacking, only three peaks were detected as shown in the upper panel of Fig. 5. The first peak in the electropherogram is L-tryptophan, and the other two possibly correspond to proteins, such as b-trace protein and HSA (not identified). By applying this concentration technique, more peaks, including 5-HIAA and HVA, were detected as shown in Fig. 5. The concen-trations for 5-HIAA and HVA were 0.48 and 2.7mM, with RSD values (n = 3) of 3.5 and 2.5%, respectively. Because comparisons of the differential ratio of HVA/HIAA and different fingerprints of the electropherograms between healthy control and medication-free schizophrenic patients are important from a practical point of view, the result shows potential for clinics.
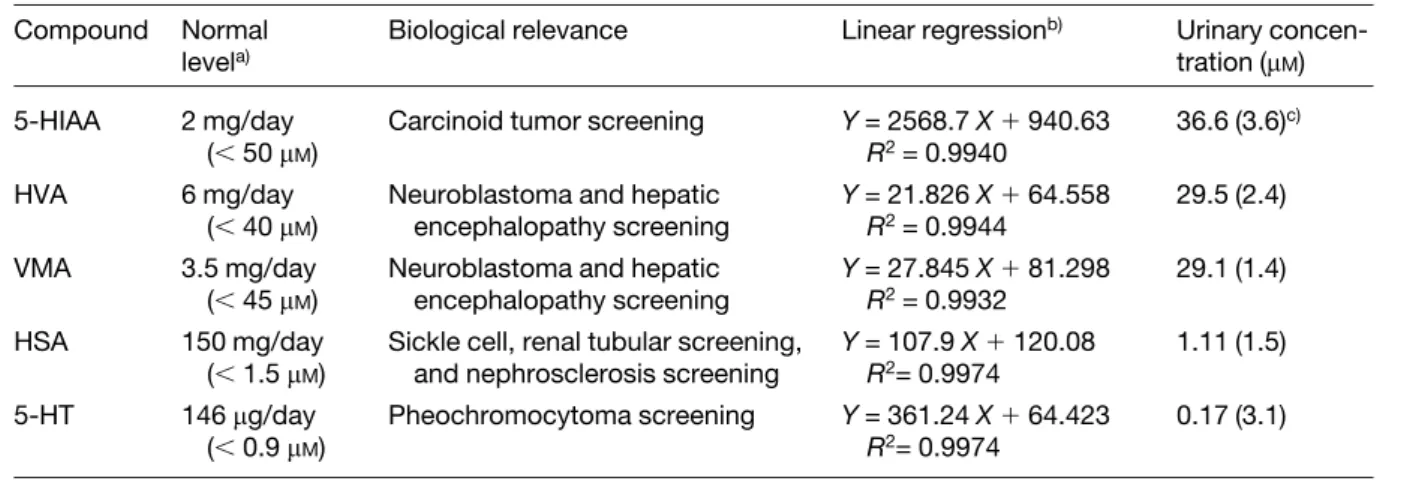
Table 3. The biological relevance and concentration of five markers in urine Compound Normal
levela)
Biological relevance Linear regressionb) Urinary
concen-tration (mM)
5-HIAA 2 mg/day
(, 50 mM)
Carcinoid tumor screening Y = 2568.7 X1 940.63 R2= 0.9940
36.6 (3.6)c)
HVA 6 mg/day
(, 40 mM)
Neuroblastoma and hepatic encephalopathy screening Y = 21.826 X1 64.558 R2= 0.9944 29.5 (2.4) VMA 3.5 mg/day (, 45 mM)
Neuroblastoma and hepatic encephalopathy screening Y = 27.845 X1 81.298 R2= 0.9932 29.1 (1.4) HSA 150 mg/day (, 1.5 mM)
Sickle cell, renal tubular screening, and nephrosclerosis screening
Y = 107.9 X1 120.08 R2= 0.9974 1.11 (1.5) 5-HT 146mg/day (, 0.9 mM) Pheochromocytoma screening Y = 361.24 X1 64.423 R2= 0.9974 0.17 (3.1) a) From Ref. [9]
b) Y represents peak height (mV) and X represents the concentration of spiked analytes. c) % RSD (n = 3)
Figure 6. Analysis of a urine sample in the presence of EOF at 15 kV using 1.5% PEO, pH 9. Peak identities: 1, 5-HT; 2,L-tryptophan; 3, HSA; 4, 5-HIAA; 5, HVA; 6, VMA; 7, 3-IXS; a–f represent unidentified peaks. The 60 cm capillary was filled with 1.5MTB, pH 10. The injections of a urine sample were conducted at 30 cm height for 10 s in (A), and 180 s in (B) and (C), respectively. A short plug of TP buffer was injected at 30 cm height for 10 s after sample injec-tion in (C). Other condiinjec-tions were as in Fig. 3.
VMA, the major metabolites of catecholamines, in urine for neurologic diagnosis and for monitoring the response of therapy in illnesses such as neuroblastoma and phaeo-chromocytoma [41]. Without stacking, numerous peaks including seven important markers that have been identi-fied were detected as shown in Fig. 6A. On the basis of the peak heights and the regression lines shown in Table 3, the concentrations of five analytes in urine were calcu-lated, which were in good agreement with reported data [42]. Without any sample pretreatment, the RSD values for the quantitative results of five solutes were less than 3.6%, indicating that this method is rugged and simple. Compared to Fig. 6A, more peaks were detected as shown in Fig. 6B when injecting greater volumes of the sample, indicating that stacking did occur. Since we used a UV laser as the light source, the new peaks should correspond to solutes with native fluorescence in the UV range, including benzoic compounds, polycyclic aro-matic hydrocarbons, heterocyclic compounds, peptides containing tryptophan, tyrosine, and phenylalanine resi-dues, nucleotides, oligonucleotides, and so on. By using unidentified peaks marked as a–f and identified peaks marked as 1–7 as standards, we were able to identify some new peaks (arrow bars). Although more peaks were detected when injecting greater volumes, the loss of resolution was found, especially for those with high concentrations. Another shortage of this method is the analysis was slow (the migration time for 3-IXS was 53.78 min). In order to shorten separation time and opti-mize resolution, we injected a short plug of TP buffer (pH 7) after sample injection. Apparently, Fig. 6C shows that the migration time for 3-IXS is shorter (35.98 vs. 53.78 in Fig. 6B) and some peaks (e.g., peaks 2 and 7) are shar-per. This is due to better stacking and reduced adsorption of the urine matrices and PEO, presumably because of large amounts of propanate in the short plug. The plug also caused solutes to migrate further apart from small ions like chloride, thereby reducing the effect of salt on stacking and peak profiles. In comparison with results obtained by 10 s injection (40 cm capillary), the heights of peaks a–f were enhanced by as many as 51-fold when injecting for 180 s with the short plug of TP buffer. More importantly, by applying a short plug of TP buffer, 52 peaks were detected in 35.98 min (the migration time for 3-IXS).
4 Concluding remarks
We have developed methods for increasing sensitivity and selectivity. The selectivity for the small solutes has been optimized in the presence of PEO, mainly because
PEO solution, this method allows injection of samples up to 0.88mL, with a 1250-fold improvement in the sensitivity for 2-NSA. The LOD values were 8 pMfor 2-NSA, 70 pM for L-tryptophan, and 90 pM for 5-HIAA. With such low LODs, this method has been demonstrated for the analy-sis of urine and CSF. It should be noted that salts at opti-mum concentrations play a significant role in increasing stacking efficiency and reducing PEO adsorption on one hand, deteriorate fluorescence for some analytes on the other hand.
We also report a method for optimum resolution, migra-tion time and sensitivity for the analysis of large-volume urine samples through injection of a short plug of low-pH buffer. The mobility of solutes further reduces when enter-ing the low-pH zone, thereby allowenter-ing a greater volume of urine samples injected. As a result, the peak-height enhancements for some unidentified solutes are up to 51-fold and more peaks were detected. Although it is impossible and not our goal to identify all these peaks, we believe that more peaks should be identified if we combine this method with mass spectrometry, which should be useful for neurochemistry and metabolomics. In the future, our effort will be made to obtain important information by comparing the electropherograms of bio-logical samples, such as urine and CSF, from normal peo-ple and unhealthy peopeo-ple or from peopeo-ple with and without taking drugs like dopamine.
This work was supported by the National Science Council of the Republic of China under contract number NSC 90-2113-M002-052.
Received October 15, 2001
5 References
[1] Cash, P., Electrophoresis 2000, 21, 1187–1201. [2] Hanash, S. M., Electrophoresis 2000, 21, 1202–1209. [3] Raamsdonk, L. M., Teusink, B., Broadhurst, D., Zhang, N.,
Hayes, A., Walsh, M. C., Berden, J. A., Brindle, K. M., Kell, D. B., Rowland, J. J., Westerhoff, H. V., Dam, K. V., Oliver, S. G., Nat. Biotechnol. 2001, 19, 45–50.
[4] Han, F., Huynh, B. H., Shi, H., Lin, B., Ma, Y., Anal. Chem. 1999, 71, 1265–1269.
[5] Hsieh, M.-M., Kuo, Y.-C., Lyu, M.-J., Chang, H.-T., J. Chro-matogr. A 2000, 898, 133–139.
[6] Melason, J. E., Boulet, C. A., Lucy, C. A., Anal. Chem. 2001, 73, 1809–1813.
[7] Wallingford R. A., Ewing A. G., J. Chromatogr. 1988, 441, 299–309.
[8] Thorsén, G., Engström, A., Josefsson, B., J. Chromatogr. A 1997, 786, 347–354.
[9] Paquette, D. M., Sing, R., Banks, P. R., Waldron, K. C., J. Chromatogr. B 1998, 714, 47–57.
[10] Chan, K. C., Muschik, G. M., Issaq, H. J., Electrophoresis 2000, 21, 2062–2066.
[11] Kuijt, J., García-Ruiz, C., Stroomberg, G. J., Marina, M. L., Ariese, F., J. Chromatogr. A 2001, 907, 291–299.
[12] Zaugg, S., Zhang, X., Sweedler, J., Thormann, W., J. Chro-matogr. B 2001, 752, 17–31.
[13] Chen, Z., Wu, J., Baker, G. B., Parent, M., Dovichi, N. J., J. Chromatogr. A 2001, 914, 293–298.
[14] Hadwiger, M. E., Torchia, S. R., Park, S., Biggin, M. E., Lunte, C. E., J. Chromatogr. B 1996, 681, 241–249. [15] He, Y., Lee, H. K., Anal. Chem. 1999, 71, 995–1001. [16] Xiong, Y., Park, S.-R., Swerdlow, H., Anal. Chem. 1998, 70,
3605–3611.
[17] Palmer, J., Burgi, D. S., Munro, N. J., Landers, J. P., Anal. Chem. 2001, 73, 725–731.
[18] Chien, R.-L., Helmer, J. C., Anal. Chem. 1991, 63, 1354– 1361.
[19] Timerbaev, A. R., Fukushi, K., Miyado, T., Ishio, N., Saito, K., Motomizu, S., J. Chromatogr. A 2000, 888, 309–319. [20] Danková, M., Kaniansky, D., Fanali S., Iványi, F., J.
Chroma-togr. A 1999, 838, 31–43.
[21] Chen, S., Lee, M. L., Anal. Chem. 2000, 72, 816–820. [22] Shihabi, Z. K., J. Chromatogr. A 1996, 744, 231–240. [23] Zhao, Y., Lunte, C. E., Anal. Chem. 1999, 71, 3985–3991. [24] Quirino, J. P., Terabe, S., Bocˇek, P., Anal. Chem. 2000, 72,
1934–1940.
[25] Palmer, J., Landers, J. P., Anal. Chem. 2000, 72, 1941–1943. [26] Britz-Mackibbin, P., Chen, D. D. Y., Anal. Chem. 2000, 72,
1242–1252.
[27] Weiss, D. J., Saunders, K., Lunte, C. E., Electrophoresis 2001, 22, 59–65.
[28] Hsieh, M.-M., Tseng, W.-L., Chang, H.-T., Electrophoresis 2000, 21, 2904–2910.
[29] Tseng, W.-L., Chang, H.-T., Anal. Chem. 2000, 72, 4805– 4811.
[30] Huang, M.-F., Hsu, C.-E., Tseng, W.-L., Lin, Y.-C., Chang, H.-T., Electrophoresis 2001, 22, 2281–2290.
[31] Soini, H., Riekkola, M. L., Novotny, M. V., J. Chromatogr. A 1994, 680, 623–634.
[32] Esaka, Y., Yamaguchi, Y., Kano, K., Goto, M., Anal. Chem. 1994, 66, 2441–2445.
[33] Bednár, P., Stránsky´, Z., Barták, P., Adamovsky´, P., J. Chro-matogr. A 1999, 838, 89–99.
[34] Shimizu, T., Kenndler, E., Electrophoresis 1999, 20, 3364– 3372.
[35] Tseng, W.-L., Hsieh, M.-M., Wang, S.-J., Chang, H.-T., J. Chromatogr. A 2000, 894, 219–230.
[36] Tseng, W.-L., Chang, H.-T., Electrophoresis 2001, 22, 763– 770.
[37] Chang, H.-T., Yeung, E. S., Anal. Chem. 1995, 67, 1079– 1083.
[38] Beckers, J. L., Bocˇek, P., Electrophoresis 2000, 21, 2747– 2767.
[39] Chen, D.-C., Zhan, D.-Z., Cheng, C.-W., Liu, A.-C., Chen, C. H., J. Chromatogr. A 2001, 750, 33–39.
[40] Wieselgren, I. M., Lindström, L. H., Psychiat. Res. 1998, 81, 101–110.
[41] García, A., Heinänen, M., Jiménez, L. M., Barbas, C., J. Chromatogr. A 2000, 871, 341–350.
[42] Panholzer, T. J., Beyer, J., Lichtwald, K., Clin. Chem. 1999, 45, 262–268.