國 立 交 通 大 學
交通運輸研究所
碩士論文
提升國際快遞業回復力之策略模式
Modeling Resilience Enhancement Strategies for
International Express Industries
研 究 生: 蔡亞璇
指導教授: 馮正民 教授
陳正杰 教授
提升國際快遞業回復力之策略模式
Modeling Resilience Enhancement Strategies for International
Express Industries
國 立 交 通 大 學
交 通 運 輸 研 究 所
碩 士 論 文
A Thesis
Submitted to Institute of Traffic and Transportation
College of Management
National Chiao Tung University
in partial Fulfillment of the Requirements
for the Degree of
Master
in
Traffic and Transportation
June 2012
Taipei, Taiwan, Republic of China
中華民國一 O 一年六月
研 究 生: 蔡亞璇
指導教授: 馮正民 老師
陳正杰 老師
Student: Ya-Hsuan Tsai
Advisor: Cheng-Min Feng
提升國際快遞業回復力之策略模式
Chinese Abstract
國立交通大學交通運輸研究所碩士班
摘要
人們普遍意識到天然災害和人為災害具有突發性,當擾動發生時,原先的營運計畫 可能偏離最佳化的結果甚至導致原先的計畫不能使用,所以調整的手段或重新最佳化的 工具是需要的,這些手段或工具可以有效率地使用資源,讓偏離最佳化的營運及時地回 到運行的軌道上。 國際快遞業相較於其他運輸服務是一個對時間高度敏感的產業,需要快速的反應供 應鏈的擾動,否則可能會失去競爭能力。相較於在擾動發生的階段武斷地做出匆促的決 定,本研究提出一個量化的方法,不論在路網上有多少可用的資源或有多少運能可供租 借,此方法可根據整合資源分配的概念最佳化回復策略。本研究之問題被模式化為一個 多樞紐、多運具、多運輸業者和多商品的路網問題,此量化分析模式可幫助國際快遞業 在擾動發生時決定新的替代路線和租賃活動(包括運具的選擇與業者的選擇)。考量到國 際快遞業對時間敏感的特性,模式也加入了貨物價值時間函數,讓不同價值的貨物可以 以不同方式來運送,獲得較高的顧客滿意程度。 最後,我們執行數值的試驗和敏感度分析。數值試驗的結果證實模式可以應用在實 際路網上,並且可提供具實用性的回復策略; 敏感度分析的結果則顯示回復成本的增加 對目標式的影響大於運輸時間,而當運輸時間超過某一門檻值後,運輸時間的增加對目 標式的影響會急遽上升。 關鍵字: 國際快遞業,回復策略,混合整數非線性規劃,貨物價值之時間函數研究生: 蔡亞璇
指導教授: 馮正民
陳正杰
ii
Modeling Resilience Enhancement Strategies for
International Express Industries
English Abstract
Student: Ya Hsuan Tsai
Advisors: Dr. Cheng-Min Feng
Dr. Cheng-Chieh Chen
Institute of Traffic and Transportation
National Chiao Tung University
ABSTRACT
There has been a general awareness that natural and man-made disasters may occur suddenly. When disruptions occur, the previously operational plans may become far from optimal or even infeasible, and means are needed for adjusting or re-optimizing the original plan to adapt the changing environment and to get back on track in a timely manner while effectively using the available resources.
International express is one most time-sensitive industry, which may need to respond disruptions quickly so as to improve service quality and to avoid losing their competitiveness with other express service providers. Instead of arbitrarily making rush decisions during the post-disruption phase, this paper contributes a method for quantifying and optimizing the resilience strategies based on an integrated resource assignment concept, regardless of how the available resources are located with respect to the studied logistics network or how many capacities we can rent from others.
The studied problem is formulated as a multi-hubs, multi-modes, multi-carriers, and multi-commodities network problem. The analytical model is developed for determining the alternative routes and rent activities (including the mode choice and carrier selection) after the disruption occurs. It also takes into account nonlinear cargo value functions of time to reflect the feature of the express industry that allows company transport different types of cargo with different ways to achieve higher customers’ satisfaction. Numerical experiments are conducted to examine our model applied in more complex networks and real world cases. Through a series of sensitivity analysis, some managerial implications are suggested to decision makers and potential stakeholders.
Key Words: International Express, Resilient Strategy, MINLP, Time Dependent Cargo Value
Acknowledgement
兩年來的研究生生活中充滿著關卡,不僅是在學術研究或是在生活上,一路走來遇 到許多貴人相助才成就了今日的我。 感謝馮老師在我遇到困難時傾聽我的煩惱,對我伸出援手; 感謝陳正杰學長在論文上給予我彈性的發展空間及專業的指導; 謝謝 Jacky 學長花時間聽我報告及給予我許多建議; 感謝小平學姊介紹 Monson 經理給我認識,讓我透過 Monson 經理得知快遞業實務 上的做法,我也感謝 Monson 和張重興學長分享寶貴的實務經驗予我; 感謝在 lab 的 ITT 同學,在苦悶的研究過程中帶給我歡樂,還有所有交研所的老師, 營造這樣的學習環境予我; 最後是我的愛人,謝謝你一直在身邊支持我,為我加油,謝謝上天讓我遇見你。 套用「謝天」裡的一句話,因為需要感謝的人太多了,就感謝天罷。感謝上天給予 我人生的磨練,感謝上天讓我遇到非常多的貴人,經過兩年的研究生生活,我知道我逐 漸成長與茁壯,已經做好準備迎接更大的衝擊。 蔡亞璇 謹誌 2012/6/26iv
Table of Contents
Chinese Abstract ... i English Abstract ... ii Acknowledgement ... iii Table of Contents ... ivFigures Catalogue ... vii
Tables Catalogue ... ix
I. Introduction ... 1
1.1 Research Background and Motivations ... 1
1.2 Research Objectives ... 4
1.3 Research Scope ... 4
1.4 Research Procedure ... 6
II. Literature Review... 8
2.1 Resilience Concept ... 8
2.1.1The General Resilience Concept ... 8
2.1.2 Supply Chain Resilience ... 9
2.1.3 Transportation System and Infrastructure Resilience ... 11
2.1.4 Disaster Resilience ... 12
2.2 Resilient Strategies in the Supply Chain and Transportation ... 19
2.2.1The Government Dimension ... 19
2.3Quantitative Methods on Resilience ... 33
2.4 Summary ... 39
III. Model Formulation ... 45
3.1 Problem Statement ... 45 3.1.1 Resilient Strategy ... 45 3.1.2 Problem Description ... 48 3.2 Model Formulation ... 54 3.2.1 Conceptual Framework ... 54 3.2.2 Mathematical Model ... 55
IV. Numerical Experiment ... 63
4.1 Solution Algorithm ... 63
4.2 Illustrative Design ... 64
4.2.1 Small Network ... 64
4.2.2 Large-scale Network ... 69
4.3 Result Analysis ... 75
4.3.1 Small Network Results ... 75
4.3.2 Large-scale Network Results ... 84
4.4 Sensitivity Analysis ... 97
4.5 Managerial Implication... 107
V. Conclusion and Extensions ... 113
vi 5.2 Extensions to Future Research ... 114 Reference ... 115
Figures Catalogue
Figure 1.1 Natural disasters reported from 1900 to 2010 (EM-DAT, 2010) ... 1
Figure 1.2 Generic vulnerability matrix (Ta et al. 2010) ... 5
Figure 1.3 Research Procedure ... 7
Figure 2.2 Original resilience triangle (Bruneau et al., 2003)) ... 14
Figure 2.3 System performance, degraded operation state and disaster impacts(R. Dorbritz, 2011) ... 15
Figure 3.1 One of possible recovery method... 48
Figure 3.2 Time dependent cargo value function of constant value commodity ... 50
Figure 3.3 Time dependent cargo value function of perishable commodity ... 51
Figure 3.4 Time dependent cargo value function of short life-cycle commodity ... 52
Figure 3.5 Time dependent cargo value function of holiday gift ... 52
Figure 3.6 The conceptual framework of mathematical model ... 54
Figure 4.1 the network for the illustative example ... 65
Figure 4.2 The rough location of the airports in the large-scale natwork ... 72
Figure 4.3 The scenario analysis result (small network) ... 83
Figure 4.4 Cargo time value and recovery cost for HKG hub failure ... 90
Figure 4.5 Total cargo time value and incremental recovery cost for different scenarios ... 96
Figure 4.6 Variation of Y1and 𝑌2 in AK ... 98
Figure 4.7 Variation of Y1and 𝑌2 in WA ... 99
viii
Figure 4.9 Variation of cargo time value in capacity parameters ... 100
Figure 4.10 Variation of incremental resilient cost in capacity parameters ... 101
Figure 4.11 Variation of Y1and 𝑌2 in T ... 102
Figure 4.12 Variation of Y1and 𝑌2 in ET ... 102
Figure 4.13 variation of Y1and 𝑌2 in RT ... 103
Figure 4.14 variation of cargo time value in time parameters ... 103
Figure 4.15 variation of incremental resilient cost in time parameters ... 104
Figure 4.16 Variation of Y1and 𝑌2 in RC ... 105
Figure 4.17 Variation of Y1and 𝑌2 in VC ... 105
Figure 4.18 Variation of cargo time value in cost parameters ... 106
Figure 4.19 Variation of incremental resilient cost in time parameters ... 106
Tables Catalogue
Table 2.1 Resilience definition from three dimensions of the freight transportation system .. 12
Table 2.2 The properties of resilience ... 18
Table 2.3 The objective of each plan ... 20
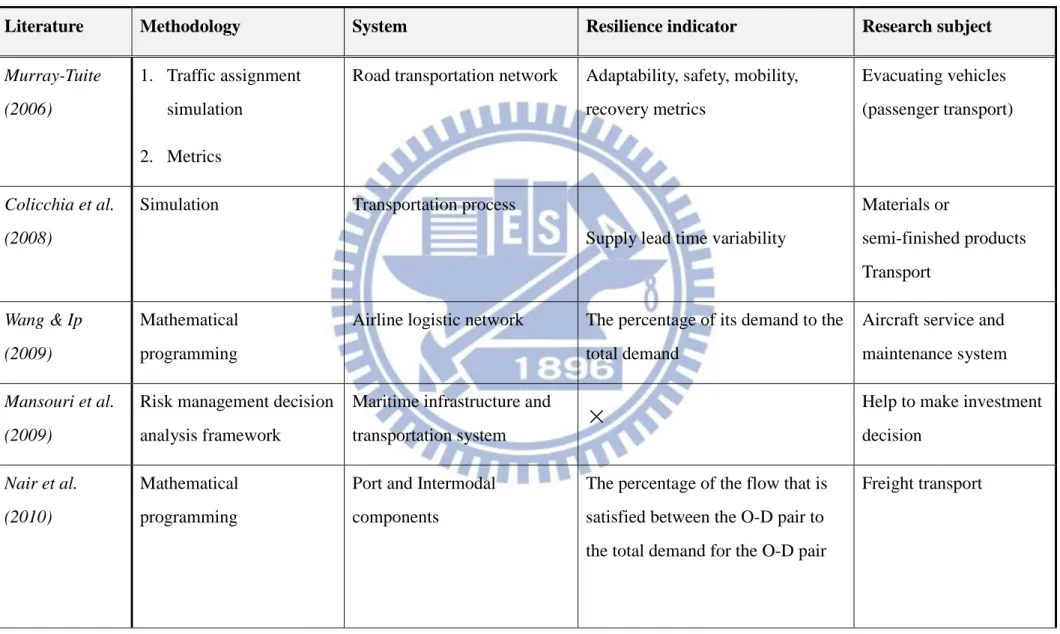
Table 2.4 Quantitative literatures ... 37
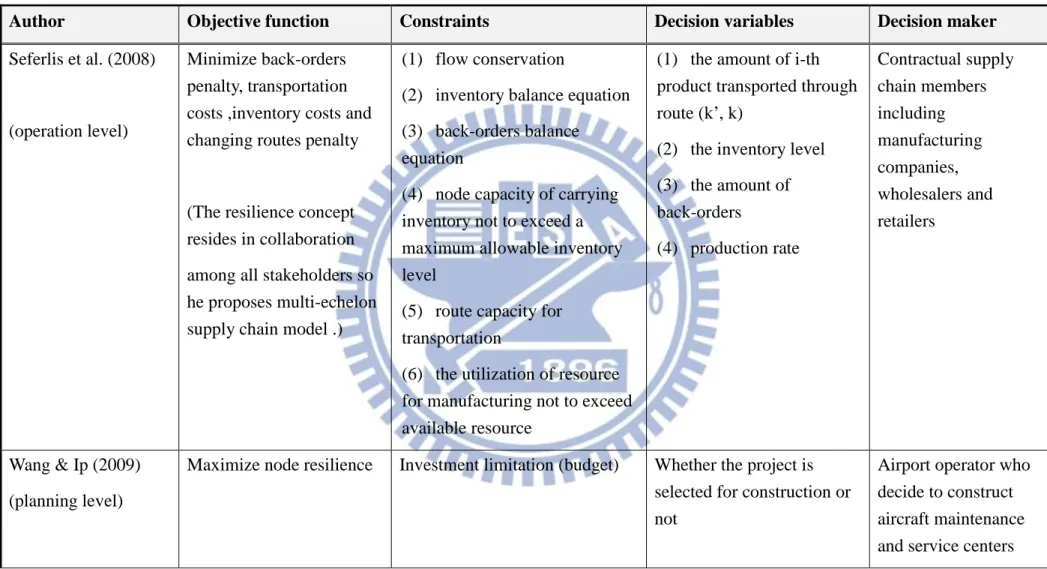
Table 2.5 The sorting table of mathematical programming model ... 41
Table 4.1 The parameters assumption of demand and time value function ... 65
Table 4.2 The parameters assumption of link capacity and transport time ... 65
Table 4.3 The parameter assumptions of original trucks allocation and own flight capacity .. 66
Table 4.4 The parameter assumptions of renting activities... 66
Table 4.5 The parameter assumptions of trucks capacities and handling time at nodes ... 67
Table 4.6 The assumption of scenarios ... 69
Table 4.7 The nodes in large-scale network ... 70
Table 4.8 The parameters assumption of demand and time value function in the large-scale network ... 73
Table 4.9 The scenario assumption for Japan earthquake... 74
Table 4.10 The result of path, freight quantities and transportation time in illustrative example ... 75
Table 4.11 The truck re-allocation and renting capacities in illustrative example ... 76
Table 4.12 The result of scenario 1 (links failed) ... 77
x
Table 4.14 The result of scenario 3 ... 79
Table 4.15 The result of scenario 4 ... 80
Table 4.16 The result of scenario 5 ... 81
Table 4.17 The alternative routes for HKG hub failure ... 85
Table 4.18 Renting capacities for HKG hub failure ... 86
Table 4.19 own trucks re-allocation at nodes for HKG hub failure ... 88
Table 4.20 The amounts of own trucks re-allocation and renting capacities for failed HKG hub ... 89
Table 4.21 Cargo time value and recovery time for HKG hub failure ... 90
Table 4.22 The alternative routes for Japan Earthquake in the two situations ... 91
Table 4.23 Renting capacities for Japan Earthquake ... 92
Table 4.24 The alternative routes for Icelandic volcano eruptions ... 93
Table 4.25 Renting capacities for Icelandic volcano eruptions ... 94
Table 4.26 The amounts of own trucks re-allocation and renting capacities for all scenarios 95 Table 4.27 Total cargo time value and incremental recovery cost for different scenarios... 96
I. Introduction
1.1 Research Background and Motivations
The supply chain currently is threatened by natural disasters andartificial disruptions. The possible reasons may be twofold. First, if we put the emphasis on the natural disasters, we can find the number of natural disasters shoot up during last ten year in Figure 1.1 . Secondly, due to global supply chains, ever-shrinking product lifecycles, and volatile and unpredictable markets, the effect of these disasters to the supply chain are heightened. (Sheffi, 2005) The information implied behind these phenomenons is that supply chain is much easier to be disrupted than before.
Figure 1.1 Natural disasters reported from 1900 to 2010 (EM-DAT, 2010)
As soon as the major disruption happens, it usually cause catastrophic consequences in the supply chain, for instance the event of the tsunami in 2004, the hurricane Katrina and Rita in 2005, Haiti Earthquake in 2010, Iceland volcano in 2010, Japan earthquake in 2011 and 9/11 attacks in 2001. We pick the Japan earthquake event to illustrate the impact it makes. The 8.9 magnitude Japan quake and ensuing tsunami destroyed infrastructures and caused plant
closures. The event threated to the supply chain operation and forced the firms around the world to slow production due to a lack of parts. Sony Ericsson, for example, suffered a loss of 50 million euro during the three months after Japanese earthquake happened and is cut sales by 1.5m phones in the quarter because of supply chain constraints. (BBC News) Not only the production side was affected, but also transportation. The demand of air freight industry fell because most technologic companies or semiconductor enterprises were closed. Another factor to affect the transportation industry is the destruction of the transportation
infrastructures. Japan quake caused the closure in Narita International Airport and Haneda International Airport. Six ports were broken. The flights were canceled and works were all delayed. Executive Director of Hactl indicated that the quake and the subsequent tsunami crisis made a significant decline in export and import volumes to and from Japan in March.
According to its catastrophic impacts, many enterprises are motivated to draw up different recovery strategies to prevent the natural and man-made disasters affecting the entire supply chain, especially for the transportation system. Transportation refers to the movement of product from one location to another as it makes its way from the beginning of a supply chain to the customer’s handle. It is one of key element in a logistics chain. (Tseng et al., 2005)The efficiency of a transportation system help a supply chain closed to the success. Conversely, if goods delivery is delayed, it can shut down the entire production process and part of supply chain. Thus, enterprises should pay attention to the disruption in transportation system when they want to enhance the supply chain resilience.
The subject in this research, the international express industry, is one of the fastest growing sectors in the global economy. Express operators provide guaranteed, fast, reliable, on demand, world-wide, integrated, door-to-door movement of shipments which are tracked and controlled throughout the journey. They simplify and speed the process of transporting goods and belong to “Business Class” of cargo services. (OE Forecasting, 2009) In summary, the core business of the express industry is the provision of value-added, door-to-door
transport and highly time-sensitive shipments, including documents, parcels and merchandise goods. If the disaster disrupts the system or process, express service can’t realize its core value, especially time-sensitive delivery, to satisfy the customers demand. Therefore, the international express industry is more threatened than other transportation services in the face
of severe disruptions, for example, natural and man-made disaster . (Other services involve air freight, ocean freight and overland transport) Setting up the recovery plans or resilient
strategies is important to the express company, particularly international express, and can mitigate the impact in effect.
Nowadays the express companies or transportation companies rarely respondthe severe disruption through the systematical measure to decide how to transport the cargos in the efficient way. The decisions are usually made by discussion, case by case, and
unsystematically. The most common way to meet an emergency is to post the disaster
information in the website and inform the customers that cargos would be delayed. We believe there is still substantial room for improvement. Thus, according to the above mentioned findings we are going to develop a quantitative method which is used to find the adequate resilient strategies for the express company after the disruption happens.
We consider that express company concerns not only how much they spend in the recovery activities but also how many cargos they deliver in the aftermath of a disruption. Although not to complete freight missions due to natural disasters or terrorist attacks is not the carrier’s responsibility, we still believe that recovering the transportation service actively even during the disruption is the better way to run a business.
1.2 Research Objectives
Based on our motivations, the aim of this research is to study what resilient strategies should be taken by express companies when the delivered activities are broken off by the natural and man-made disruptions and provide a quantitative method to find these strategies.
The purposes and contributions can be described respectively as follows: 1. Sort out the materials for proactive and reactive recovery strategies in the
transportation domain by literature reviews, expert interviews and the information available online. Afterwards, obtain the possible recovery strategies which can be employed by international express.
2. Develop a quantitative resilience model considering the feature of express industry which is highly time-sensitive. The model is able to search the optimal reactive actions.
3. Provide strategic directions and actions that help decide investment balance between proactive and reactive resilient strategies in the way of sensitivity analysis.
1.3 Research Scope
1. Disruption category
Decision makers of the enterprise need to have a clear understanding of the sources of uncertainty and consequences of the risks to the system in order to prevent disruptions and respond to disturbances, shocks, or incidents timely and efficiently. (Mansouri et al. 2009) Thus, we need to identify the threats that make the supply chain disruption in this research in order to develop the resilient strategies. The threats are categorized by different sorting methods from the literatures but in our studies we focus on the external disruptions including the natural disaster (e.g. tsunamis, earthquakes, floods, landslides, hurricanes) and the
man-made disaster (e.g. arson and terrorist attacks). These disruptions are infrequent and cause catastrophic consequences in the transportation system which fall on the Quadrant I in
Figure 1.2.
Figure 1.2 Generic vulnerability matrix (Ta et al. 2010)
2. Geography scope
The research focuses on the global delivery network from the service centers in original country to the service center in destination country. It means we consider the intermodal transportation including the ground and air transport and put the stress on handling the international problem. The other available networks are also considered after the disruption, for example rail and sea.
3. Time scope
The resilient strategies we discuss in this study are used in recovery phase. The aim of the recovery phase is to take appropriate strategies to regain operability as fast as possible after the occurrence of a disastrous event. The strategy taken in the recovery phase is called the reactive strategy.
4. Research object
In this study, international express company which has their own aircrafts and trucks is our research object. The service it provides is highly time-sensitive.
Typically, the types of goods transported by express services are high-value and low-weight items such as electronic components, designer fashions, and pharmaceutical
products. However, express delivery is sometimes called on to delivery urgent shipments of large articles such as parts for aircraft and equipment for mining, construction, and
manufacturing operations. (Oxford Economic Forecasting, 2009) We identify the products delivered byexpress company in our research is the high value-added, low-weight and urgently-needed items.
In this article, the resilience model is based on the international express delivery network from international express company perspective, focusing on one kind of threat: external disruptions. Moreover, the reactive strategies are taken as the methods to enhance the resilience.
1.4 Research Procedure
The research is organized by five chapters as follows in Figure 1.2.
In chapter 1, the motivation and objective for the study subject is described. Chapter 2 presents an overview of the literature related to resilience concept in supply chain and transportation. We also provide an overview of resilient strategies and quantitative methods on resilient supply chain and transportation system. The mathematical model we proposed is developed simultaneously considering the international express industry characteristics in Chapter 3 while in Chapter 4 we conduct numerical experiments to illustrate the application of the model and provide the applied example to the model. The final chapter, we conclude with a discussion of the implications of our research and outline directions for future research.
II. Literature Review
2.1 Resilience Concept
In this section, we will introduce the concept about resilience from general, supply chain and transportation aspects first. Generally, the topic of supply chain resilience emerged from about 2004 and has become more widely recognized recently. (Christopher & Peck, 2004, Sheffi, 2005 ). The resilience of transportation has been addressed to a limited degree before 2006 (Murray-Tuite, 2006). Only in recent years has it emerged as an attribute which is concerned by state departments of transportation (DOTs) on the transportation infrastructure and freight transportation systems (Ta et al., 2009, Ta et al., 2010).
Finally, the literatures about disaster resilience and its quantitative measure will be reviewed.
2.1.1The General Resilience Concept
By no means is resilience a new concept or a new theoretical perspective. The concept of resilience has been used extensively in engineering, ecological sciences, and organizational research. The term resilience was first proposed in ecological research (Holling, 1973) to distinguish between a system (an ecosystem, society or organization ,for example) that persists in a state of equilibrium (stability) and how dynamic systems behave when they are stressed and move from this equilibrium.
In engineering, a very basic definition of resilience can be found: the tendency of a material to return to its original shape after the removal of a stress that has produced elastic strain (Merriam-Webster, 2007). However, when an organization focuses on resilience, it is prepared to adapt to a new set of circumstances following a disturbance. The organization should not aim to recover and rebuild itself to be the same as it was before disaster struck, but should recover to a new equilibrium. (Dalziell & McManus, 2004)
The study written by Gunderson and Pritchard (2002) characterize two general types of system resilience, termed engineering resilience and ecological resilience.
1. Engineering resilience is measured by the time required to return to prior steady state operations after a disruption. Implicit in engineering resilience is the notion that the system is stable and has a single equilibrium condition representing the longterm steady state behavior of the system.
2. Ecological resilience is defined as the magnitude of disturbance that can be absorbed before the system restructures, which implies a focus on maintaining existence of function.
2.1.2 Supply Chain Resilience
The concept of resilient supply chain is formed by several scholars, including Sheffi, Christopher, and Peck. Before we introduce the concept, the origin of vulnerability and resilience and their relation will be referred to because they are closely related to the formulation of resilience concept in supply chain management.
1. The origin of vulnerability and resilience
The terms, vulnerability and resilience, used in supply chain are derived from disruption risk management. (Kleindorfer & Saad, 2005) However, the framework of disruption risk management builds on the supply chain risk management theory. The definition of Supply chain risk management(SCRM) is to collaborate with partners in a supply chain apply risk management process tools to deal with risks and uncertainties caused by, or impacting on, logistics related activities or resources (Norrman and Lindroth, 2002). In contrast, Disruption risk management and SCRM have the same process that are understanding the risks ( risk estimation and risk evaluation) and then minimizing their impact(Norrman & Jansson, 2004), but they focus on different risk categories. There are two broad categories of risk in the SCRM area affecting supply chain design and management: (1) risks arising from the
problems of coordinating supply and demand, and (2) risks arising from disruptions to normal activities. (Kleindorfer & Saad, 2005) Disruption risk management is concerned with the second category of risks including operational risks (equipment malfunctions, unforeseen
discontinuities in supply, human-centered issues from strikes to fraud), and risks arising from natural hazards, terrorism, and political instability. (Kleindorfer & Saad, 2005)
Vulnerabilities could be explained as situations where organizations are not prepared for the magnitude of the risks or uncertainties (and therefore their impacts). (Asbjornslett, 2008) In other words, it is a representation of lacking robustness or resilience to internal and external threats. From risk management aspect, decision makers can prevent disruptions and increase resilience relying on understanding of the vulnerability in supply chain. Nair et al. (2010) also mentions from maritime transportation, if someone wants to determine the best set of recovery actions that can be taken to enhance port resilience, measuring the port
vulnerability is required.
In general terms, the relationship between vulnerability and resilience is inseparable.
2. The concept of supply chain resilience
Supply chain resilience is defined as the ability of a system to quickly react to the undesired events when they happen and quickly return to its original state or move to a new, more desirable state after being disturbed(Christopher & Peck, 2004). Falasca (2008) also defines supply chain resilience to be the ability of a supply chain system to reduce the
probabilities of a disruption, to reduce the consequences of those disruptions once they occur, and to reduce the time to recover normal performance.
SC managers today need to manage risks in a complex, dynamic and highly vulnerable environment. They are becoming increasingly aware of the concept of vulnerability and resilience. How to make the enterprise become flexible is the issue managers concerned with. From the organizational aspect, Rose (2004) describes that a resilient organization is able to quickly return to normal (or even improved) operations after such an event has occurred. The notion of organizational resilience is the ability of an organization to successfully confront the unforeseen. It has always been a core element of success. (Sheffi, 2005)
In the past, supply chain resilience was thought to be the ability to manage risk. To date, it is not only the ability to manage risk but also making business be better positioned than competitors to deal with disruption and even gain advantage from disruption. (Sheffi, 2005)
Though we emphasize the importance of resilience, it is worthy to note that many recovery actions that can increase resilience conflict with the business goals such as reducing costs and increasing operational efficiency. (Falasca, 2008)
2.1.3 Transportation System and Infrastructure Resilience
The freight transportation system resilience is defined as ‘the ability for the system to absorb the consequences of disruptions to reduce the impacts of disruptions and maintain freight mobility’. (Ta et al. 2009) He also provides a definition for resilience including the physical, user, and organizational dimensions of a freight system presented in Table 2.1. He thinks there is an intricate relationship between the three dimensions. Murray-Tuite (2006) also considers several dimensions but from different angles. He states a resilient
transportation system has ten properties: redundancy, diversity, efficiency, autonomous components, strength, adaptability, collaboration, mobility, safety, and the ability to recover quickly. He measures the transportation resilience through the evaluation matrix of last four dimensions in the context of vehicular traffic network performance.
Concept Definition of resilience
Infrastructure resilience Ability of the network to move goods in the face of infrastructure failure, either through a reduction in capacity, a complete failure, or a failure in the information infrastructure to provide information
Enterprise resilience (user)
Ability of an enterprise to move goods in a timely and efficient manner in the face of infrastructure disruption
Managing organization resilience Capacity to meet priorities and achieve goals in a timely and efficient manner in order to contain losses. (G. D. Haddow, & J. Bullock, 2004)
Table 2.1 Resilience definition from three dimensions of the freight transportation system (Ta et al. 2009)
More researches would define the resilience concept from the perspective of
infrastructure system. (Mansouri et al., 2009, Nair et al., 2010) Both they think the inherent capacity is important. The resilience definition adopted by Nair et al. (2010) captures the impact of the inherent capacity redundancy and short-term recovery actions to an Intermodal (IM) component. The inherent capacity redundancy of an IM component can mitigate the effects of disruptions. Short-term recovery actions taken to reverse, contain, or ameliorate conditions on the ground help in prompt resumption of component activities. Thus, the resilience is the innate ability of the IM component to weather the disruption and the positive effects of short-term recovery plans to increase component capacity. Mansouri et al. (2009) define the resilience of an infrastructure system such as the MITS (Maritime Infrastructure and Transportation Systems) as a function of system’s vulnerability against potential disruption, and its adaptive capacity in recovering to an acceptable level of service within a reasonable timeframe after being affected.
2.1.4 Disaster Resilience
Because our research focuses on the natural and man-made disruptions, we simply introduce the meaning and application of natural disaster resilience as following.
Different aspects of the concept of disaster resilience are currently being studied from a number of viewpoints within the academic research community. Many studies focus on the physical (technological) aspects of a system or the social (human) aspects of a system. But there is still significant discussion on combined human–environment interactions
(socio-ecological systems). (Zobel, 2011) Due to the diversity of perspectives presented in these different subjects, the concept of disaster resilience has developed a large number of different working definitions. (Zhou et al., 2010). We will not go into particulars here.
As mentioned before, the concept of resilience is related to the capacity of physical and human systems to respond to and recover from extreme events, and it has gained prominence in recent years as a topic in the field of disaster research (Bruneau et al., 2003; Rose & Liao, 2005).Resilience also can be thought of as an extension of the traditional concept of resistance, defined as the measures that enhance the performance of structures, infrastructure elements, and institutions, in reducing losses from a disaster. But while disaster resistance emphasizes the importance of pre-disaster mitigation, the concept of resilience needs to be extended in order to include improvements in the flexibility and performance of a system both during and after a disaster. (Falasca, 2008)
The definition of resilience from Subcommittee on Disaster Reduction (2005) is the ability of a community or system to adapt to hazards so as to maintain an acceptable level of service. Bruneau et al. (2003) also describe the resilience is the ability of social units such as organizations to mitigate hazards, to contain the effects of disasters when they occur and to carry out recovery activities in order to minimize social disruption and to mitigate the effects for potential future disasters.
As initially proposed by Bruneau et al. (2003), disaster resilience is characterized by four properties, which are robustness, rapidity, resourcefulness and redundancy. Zobel (2010) rewrites the meaning of them as following.
1. Robustness—the strength of a system, or its ability to resist the impact of a disaster event, in terms of the amount of damage or loss of functionality that results because of the event.
2. Rapidity—the rate or speed at which a system is able to recover to an acceptable level of functionality, after the occurrence of a disaster event.
3. Resourcefulness—the level of capability for dynamically responding to a disaster event, by identifying and implementing solutions to improve rapidity and/or robustness.
4. Redundancy—the extent to which components of the system are substitutable, and therefore able to be replaced or augmented when functionality has been lost or reduced.
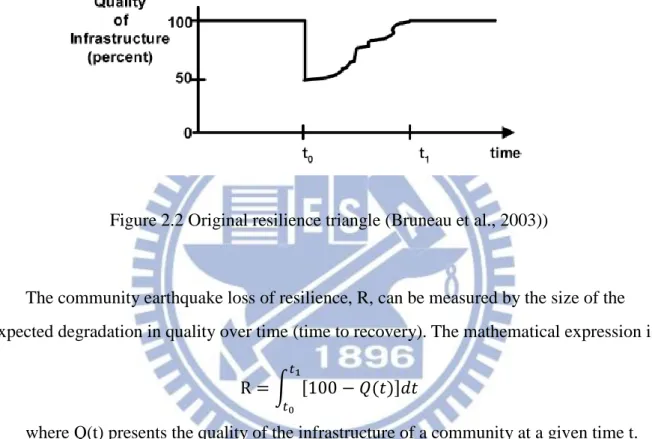
Bruneau et al. (2003) also proposed the resilience triangle, which use the characterization of system performance to conceptualize of resilience illustrating in Figure1.
Figure 2.2 Original resilience triangle (Bruneau et al., 2003))
The community earthquake loss of resilience, R, can be measured by the size of the
expected degradation in quality over time (time to recovery). The mathematical expression is R = ∫ [100 − 𝑄(𝑡)]𝑑𝑡
𝑡1
𝑡0
where Q(t) presents the quality of the infrastructure of a community at a given time t. Performance at the vertical axis can range from 0% to 100%, where 100% means no degradation in service and 0% means no service is available. When an earthquake occurs at time 𝑡0 , it could cause sufficient damage to the infrastructure such that the quality is immediately reduced. Restoration of the infrastructure is expected to occur over time until time 𝑡1. At time 𝑡1 , it is completely rebound to the former state.
This concept was adapted by Dorbritz (2011) to assess the disaster resilience of public transportation systems (Figure 2.3). He states that initial reduction of the system performance when a failure occurs can serve as a measure for robustness and redundancy. Rapidity impacts
the duration of recovery and resourcefulness can present the shape of the system performance curve after the event occurs.
Figure 2.3 System performance, degraded operation state and disaster impacts(R. Dorbritz, 2011)
Dorbritz (2011) thinks the resilience concept should consider prevention, intervention and recovery and divides the time period into three phases.
1. The prevention phase
This phase aims to increase the ability of systems to withstand the impacts of disastrous events on the system performance before such an event occurs. Systems should be designed in a way such they are maximally robust and the impacts on the system performance are
minimized
2. The intervention phase
In this phase, the organization tries to suggest appropriate strategies to positively
influence the disaster spreading process during the impacts of them. Catastrophe management and anticipating order of failures are example for intervention measures.
After the occurrence of a disastrous event, large parts of the system may fail such that even the entire network might blockade. Recovery strategies try to regain operability as fast as possible. Usually, recovery measures induce much higher costs than preventive ones.
Experiences made in a recovery phase can be used to enhance the disaster resilience before a next occurrence. (Dorbritz, 2011)
Essential characteristics of resilience
According to above literature, we can sort out the relative properties of resilience from Murray-Tuite (2006), Tierney et al. (2007), Dorbritz (2011) and C. Ta el at. (2009) as the following table 2.2.
Resilience properties
Definition the application area
Robustness (Strength)
Ability of systems to withstand disaster forces without significant degradation or loss of performance
disaster resilience
System’s ability to withstand an event Cities resilience
Redundancy Extent to which systems are
substitutable, that is capable of satisfying functional requirements, if significant degradation occurs
disaster resilience
Availability of more than one resource to provide a system function
freight transportation system resilience
Resourcefulness Ability to diagnose and prioritize problems, to initiate solutions by identifying and mobilizing material, monetary, informational, technological
and human resources
Rapidity Capacity to restore functionality in a timely way, containing losses and avoiding disruptions
disaster resilience
An acceptable level of service can be restored rapidly and with minimal outside assistance after an event occurs
Transportation network
Autonomous components
Parts of a system that have the ability to operate independently
freight transportation system resilience,
Cities resilience
Collaboration Engagement of stakeholders and users in a freight transportation system to promote interaction, share ideas , build trust, and establish routine communication
freight transportation system resilience
Information and resources are shared among components or stakeholders.
Cities resilience
Efficiency Optimization of input against output freight transportation system resilience,
Cities resilience
Adaptability System flexibility and a capacity for learning from past experiences
freight transportation system resilience,
cities resilience
Interdependence Connectedness of components of a
system or the dimensions of a system, including the network of relationships
freight transportation system resilience
across components of a system, across dimensions of a system, and between components and dimensions
Table 2.2 The properties of resilience
We find the properties, autonomous components and interdependence, are a little contradictory. The property of autonomous components asks the system to operate independently. However, interdependence hopes that there is connectedness across dimensions of a system or components.
2.2 Resilient Strategies in the Supply Chain and Transportation
In this section, we will review the literatures about recovery strategy before and after the disruptions occurs.
There is less recovery strategies provided for private transportation carriers. Most of researches and materials discuss it from the enterprise in supply chain and government perspectives. Thus, we will organize the recovery strategies from these two perspectives in order to develop our resilient strategies in the next chapter. While reviewing the literatures, we try to focus on transportation part even.
2.2.1The Government Dimension
The government of the nation is given the responsibility to protect the community from harm when a major disaster happens. Several organizations, for example, Office of Disaster Management, Executive Yuan in Taiwan, National Fire Protection Association (NFPA) in America, would publish documents relating to preparedness for, response to, and recovery from disasters. These programs consider the response for emergency relief to the community and what the government and private sections should do to spring back to normal situation from the government’s point view, if the critical infrastructures shut down. Moreover,
different departments will enact relative plans and strategies in the detail, for example United Stated Department of Transportation which provides the transportation recovery rules to reduce the consequences of a disruption.
"Standard on Disaster/Emergency Management and Business Continuity
Programs"(2007) is published by the National Fire Protection Association (NFPA) from America. It is developed through a consensus standards development process approved by the American National Standards Institute. The standard provides disaster and emergency
management and business continuity programs, the criteria to assess current programs from varied viewpoints. It can apply to public, not-for-profit, and private entities on fire and other safety issues.
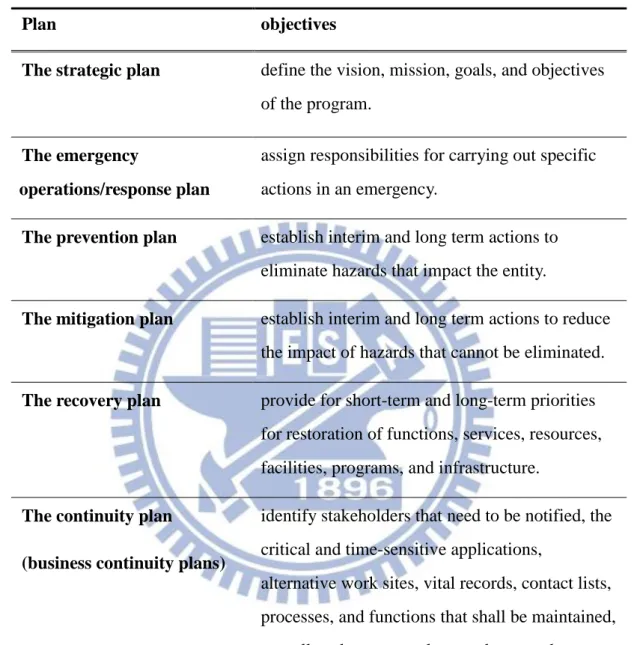
The program shall follow a planning process which is the strategy, prevention, mitigation, emergency operations/response, business continuity, and recovery plans. The objective of each plan is described in Table 2.3.
Plan objectives
The strategic plan define the vision, mission, goals, and objectives of the program.
The emergency
operations/response plan
assign responsibilities for carrying out specific actions in an emergency.
The prevention plan establish interim and long term actions to eliminate hazards that impact the entity.
The mitigation plan establish interim and long term actions to reduce the impact of hazards that cannot be eliminated.
The recovery plan provide for short-term and long-term priorities for restoration of functions, services, resources, facilities, programs, and infrastructure.
The continuity plan (business continuity plans)
identify stakeholders that need to be notified, the critical and time-sensitive applications,
alternative work sites, vital records, contact lists, processes, and functions that shall be maintained, as well as the personnel, procedures, and
resources that are needed while the entity is recovering
Table 2.3 The objective of each plan
The prevention plan and mitigation plan are similar, but the prevention plan emphasizes on how to reduce the occurrence of hazards, however, the mitigation plan emphasizes on how to reduce the impact of hazards when we can’t avoid hazards.
Recovery planning in continuity plans for public sector normally includes bringing infrastructure and individuals back to pre-incident conditions through implementing mitigation measures to facilitate short- and long-term recovery. In addition, continuity of operations plans might use business impact analysis to identify critical governmental functions. Business continuity planning in the private sector incorporates both the initial activities to respond to an emergency situation and the restoration of its functions to
pre-incident levels. The meanings of both plans in public sector and private sector are much the same, but still have difference.
In this study, recovering plan and continuity plan are much close to what we want to explore.
From the government viewpoint, the transportation network takes millions of people to and from work, school, and vacation destinations every day, and transports goods and services from one coast to the other. (Office of Intelligence, Security, and Emergency Response, 2009) Critical infrastructures in transportation systems play an essential role in communitywide disaster mitigation, response, and recovery. Therefore, they are high-priority targets for resilience enhancement. (Tierney & Bruneau, 2007)
Private transportation industry stakeholder, defined in “The National Transportation Recovery Strategy (NTRS) (2009)”, is an owner or manager of a private company specializing in transportation services, assets, systems, or infrastructure, for example,
transportation carriers and third party logistics in Taiwan. For the government standpoint, the role of private transportation industry stakeholder is responsible for the local community to deliver goods and play an assistance role in rescue when a disaster occurs, so it is vital to the effective, safe, and timely recovery and restoration of its own transportation system or infrastructure. NTRS (2009) provides the recommendations on how private transportation industry stakeholders can prepare for and manage the transportation recovery process. We review the recovery actions that are took before and after an incident.
Before an incident
1. Enter into Mutual Aid Agreements: In accordance with applicable laws and regulations, entering into mutual aid agreements can obtain assistance with other transportation industry stakeholders.
2. Coordinate with Government and Other Transportation Industry
Stakeholders: Coordination efforts among all private companies or organizations and
government involved in the transportation network recovery process are vital to ensuring that restoration occurs safely and quickly.
3. Train: Train the staff to serve as technical or subject-matter experts in the response and recovery phases. Pre-identify these essential employees for the
transportation operation and set expectations and requirements so they can respond the incident quickly with no confusion.
4. Improve Materials and Construction Methods: Through risk assessments for the transportation entity, it can understand what those risks are and the probability of occurrence on the infrastructure. In order to mitigate these risks, the transportation entity can use the result of risk assessments to make improvements to the materials and
construction methods when building and maintaining the transportation asset or infrastructure.
5. Develop a Business Impact Analysis: Develop a business impact analysis (BIA) for the company to determine the financial losses that could incur if the company and the transportation system or infrastructure were to be damaged or destroyed. Consider the economic, logistical, and social impacts that the loss would inflict on the community at large.
6. Develop a Continuity of Operations Plan: Using the results from BIA, the companies are strongly encouraged to develop a business continuity and recovery plan for the transportation service, system, or infrastructure. Further, companies are
regular basis. There are several approaches needed to consider in continuity plans. (National Fire Protection Association, 2007)
(1) Succession: To designate at least three successors for each position to ensure that the leadership will continue to function effectively under emergency conditions. (2) Pre-delegation of emergency authorities: To ensure that sufficient enabling
measures are in effect to continue operations under emergency conditions. Emergency authorities have been enacted that specify the essential duties to be performed by the leadership during the emergency period and that enable the leadership to act if other associated entities are disrupted, and to re-delegate with appropriate limitations.
(3) Emergency action steps: Actions that facilitate the ability of personnel to respond quickly and efficiently to disasters/emergencies. Checklists, action lists, and/or standard operating procedures (SOPs) have been written that identify emergency assignments, responsibilities, and emergency duty locations. Procedures should also exist for alerting, notifying, locating, and recalling key members of the entity. The SOPs and notification procedures should be integrated.
(4) Primary and alternate emergency operations centers: A facility or capability from which direction and control is exercised in an emergency. This type of center or capability is designated to ensure that the capacity exists for the leadership to direct and control operations from a centralized facility or capability in the event of an emergency.
(5) Alternate operating or backup facilities: Provisions also exist for alternate site(s) for departments or agencies having emergency functions or continuing operations.
During Recovery
After the incident occurred, the government suggests the private transportation industry stakeholder doing the following actions to respond it.
1. Conduct Damage Assessments: Be prepared to assess the impact of the incident on your transportation service, system, or infrastructure and the impact this damage has on the overall transportation network.
2. Help the government to implement the recovery actions : During the recovery period, the private transportation industry stakeholder should be fully involved in all means of information sharing in coordination with government and other private companies.
Company’s employees may be asked to advise government decision-makers, so the company may provide subject-matter expertise’s suggestions to the government. The company also should prepare to provide critical transportation resources to community for critical facilities, such as hospitals, during the initial response and recovery phase.
3. Implement Improved Materials and Construction Methods: The new, improved materials and construction methods may be strongly encouraged or required by regulators to prevent similar damage from occurring again.
2.2.2 The Private Sectors Dimension
The approaches of mitigating the supply chain disruptions can be divided into the two broad categories of proactive and reactive response from the corporate enterprise perspective. A reactive response has minimal redundancies as supplies are acquired and delivered only in real time and a proactive response is based upon building ex ante capacity (Knemeyer, et al., 2009). Most researches place emphasis on proactive rather than reactive actions because ‘prevention is better than cure’. (Weichselgartner, 2001, Kleindorfer & Saad, 2005)
We then classify the proactive and reactive response strategies as following:
Proactive response:
The aim of proactive response is to reduce the probabilities of a disruption and reduce the consequences of those disruptions once they occur. If the firm takes the proactive action in advance of a disruption, it incurs the cost of the action regardless of whether a disruption
occurs. (Tomlin, 2006) It is called themitigation approach in the study of Tomlin (2006) and Colicchia et al. (2008).
There are some manners as following. 1. Supply chain network engineering
This method is kind of risk assessment measure. Through risk assessment exercise, business can find the vulnerabilities of critical nodes and links in the network. Business uses mapping tool to help in identification of ‘pinch point’ and ‘critical paths’. Pinch points are defined as bottlenecks where there is a limit of capacity and where alternative options may not be available. For example, ports capable of taking large container vessels or central distribution facilities which if they were to become unavailable would place a heavy strain on the rest of the system. Critical path in the supply chain network may have the characteristics like long lead-times, poor visibility and high levels of identifiable risk. (Christopher & H. Peck, 2004)
2. Supply management (1) Flexible supply base
Single sourcing, where one supplier is responsible for the supply of a specific item, is dangerous in terms of resilience, although it will enable a firm to reduce cost. It may be desirable to have a lead supplier, but possible alternative sources should be available wherever. (Christopher & Peck, 2004) A flexible supply base not only enables a firm to handle regular demand fluctuations, it can also be used to maintain continuous supply of materials when a major disruption occurs. (Tang, 2006)
(2)Make-and-buy strategy
A supply chain is more resilient, if certain products are produced in-house while other products are outsourced to other suppliers. When a supply disruption occurs, the make-and-buy strategy offers flexibilities that allow firms to shift production quickly. (Tang, 2006)
3. Product management (1) Postponement
Postponement strategy utilizes product or process design concepts such as standardization, commonality and modular design, to delay the point of product
differentiation. (Tang, 2006) It enables a firm keeps products in semi-finished in generic form and customizes them until the demand information is more accurate. (Sheffi,2005) In the context of disruption recovery, the postponement strategy offers a cost-effective and time-efficient contingency plan that allows a supply chain to use a slightly different component from other suppliers for the generic products and reconfigure them quickly in the event of supply disruption. (Tang, 2006)
(2) Strategic stock
Traditionally, a firm considers carrying additional inventories of certain critical components to keep the supply chain from a disruption in supply. In the “just-in-time” era, a firm may consider storing some inventories at certain “strategic” locations (warehouse, logistics hubs, distribution centers) to be shared by multiple supply chain partners
(retailers, repair centers, etc.). This strategy can deal with regular demand fluctuations problem. When a disruption occurs, the shared inventories at strategic locations will allow a firm to deploy these stocks quickly to the affected area as well. (Tang, 2006)
4. Supply chain collaboration from upstream to downstream (visibility) Due to the increased globalization of supply chains and the prevalent use of subcontract manufacturing and offshore sourcing, the members of supply chain and the length of time took to complete all the works are increased. (Christopher &Lee, 2004) The situation leads supply chain to the lack of visibility and to explore in the risk, like demand fluctuation, because the member of a supply chain has no detailed information of what goes on in other parts of the chain.
Visibility implies a clear view of upstream and downstream inventories, demand and supply conditions, and production and purchasing schedules for example. It is the ability that makes supply chain respond rapidly to unpredictable changes in demand or supply. (Christopher & Peck, 2004)
On the other hand, the achievement of supply chain visibility is based upon collaborative working across supply chain members. The underlying principle of
collaborative working is sharing the information to mitigate risk. Further, the information sharing can aid the creation of supply chain resilience to identify the sources of risk and uncertainty at each node and link in the supply chain. (Christopher & Peck, 2004)
5. Process improvement
Companies can achieve the aim of reducing the likelihood of disruption occurrence based on the analysis of the processes. (Colicchia et al., 2008) Sheffi (2005) suggests that a company can adopt standardized processes to increase supply chain flexibility. The method is to move production among plants by using interchangeable and generic parts in many products, relying on similar and identical plant designs and cross-training employee. It allows a company to respond quickly to a disruption by reallocating resources to the greatest need place.
Another measure is simplified processes by reducing the number of stages or activities involved, perform these activities in parallel rather than in series and e-based rather than paper-based. At the same time these simplified processes are designed around minimal batch sizes. The emphasis is on flexibility rather than economies of scale. (Christopher & Peck, 2004) Company also can inspect the non-value adding time from a customer perspective to simplify processes.
6. Enhance transportation resilience
(1) Creating the robust network : adding additional links to the network.
(2) Building ex ante capacity : ordering spare parts or backup equipment; prepositioning resources in anticipation of potential recovery activities.
(3) Assistant with technologies: implementation of advanced technologies.
7. Organization culture
Organization culture is a factor that clearly distinguishes those companies that recover quickly from those that falter after a disruption. (Sheffi, 2005) There is a requirement to create a risk management culture within the business today.
(1) Deliver the information to the leader
As in every case of culture change at an organizational level, nothing is possible without leadership from the top of the organization. A supply chain risk management team should be created within the business and charge with the regularly updating supply chain risk register to report to the main Boardroom through the supply chain director on a least a quarterly basis. The team will need to be cross-functional and to be able to audit risk using the frameworks and tools. (Christopher & Peck, 2004)
(2) Continuous communication among informed employees
Organization keeps all personnel aware of the strategic goals, tactical factors, and day-by-day pulse of the business. When a disruption takes place, employees know the company’s status and can make better decisions in the face of the unforeseen. (Sheffi, 2005)
(3) Distributed power to the team and individual
Make teams and individual be empowered to take necessary action before a potential disruption is visible. The organization can respond risks quickly, significantly enhancing the chances of reducing the damage. (Sheffi, 2005)
Resilient and flexible organizations will regard disruption as normal situation. (Sheffi, 2005)
Reactive response:
In generally, the reactive response that business usually gets after a disruption is the contingency plan. In the supply chain, it is viable only if suppliers have volume flexibility, that is, the ability to temporarily increase their processing capacity. (Tomlin, 2006)
Christopher and Lee (2004) propose to define contingency plans in case shipment schedules are deviated from plan. In the explorative study of Norrman and Jansson (2004), they describe how Ericsson has implemented a supply chain risk management process and define the contingency plans as business continuity management plans. In other words, the contingency plans are plans and actions which provide alternative modes of operation for those activities or business processes which might bring a damaging or loss to the supply chain if the processes are interrupted. However, Craighead et al. (2007) have different views on contingent plan. He depicts that a contingent response operates in a proactive mode for low values of disaster intensity, and activates a reactive response if the intensity exceeds a certain threshold. In the pertinent literature, we find that contingency plan approach is generally considered a reactive response in order to manage catastrophic risks rather than minor impact risks. (Kleindorfer & Saad, 2005) Thus, we will identify the contingency plan as the proactive response in our research.
Norrman and Jansson (2004) further divide contingency plans into: response plans (immediate reaction to a problem),
recovery plans (actions needed to resume the essential parts of a process or a business)
demand management and transportation strategy.
1. Customers demand management
Sometimes business decreases the risk of disruption relying on influencing the customers demand. We also can use these methods to deal with the customers demand when the
disruptions occur. Tang (2006) introduces two strategies: (1) Revenue management
Revenue management via dynamic pricing and promotion can be an effective way to manage demand when the supply of a particular product is disrupted. Specifically, a retailer can use pricing mechanism to entice customers to choose products that are widely available. For example, when Dell was facing supply disruptions from their Taiwanese suppliers after an earthquake in 1999, Dell immediately deployed a contingency plan by offering special “low-cost upgrade” options to customers if they chose similar computers with components from other suppliers.
(2) Assortment planning
The assortment planning means how to decide the set of products on display, the location of each product on the shelves and the number of facings for each product. The retailers usually used it to influence consumer product choice and customer demand. When certain products are facing supply disruptions, companies can utilize assortment planning to entice customers to purchase products that are widely available.
2. Transportation recovering strategy
Another method to quickly return system’s capability to original state in reactive manner is to implement potential transportation strategies. Nair et al. (2010), for example, propose a quantitative measure to determine the best set of post-disaster recovery actions to improve security at nodal facilities in an IM network. These potential recovery activities include reconstruction of damaged section and rent big ship for example.
Tang (2006) also provides three basic approaches to add more flexibility to the transportation system.
(1) Multi-modal transportation
To prevent the supply chain operations from coming to a halt when disruptions occur in the ocean, in the air, on the road, some companies prepare multiple modes of
transportation in advance to maintain a flexible logistics. For example, Lee (2004) presents the Seven-Eleven Japan’s case study, able to assure supply continuity through the use of different modes.
(2) Multi-carrier transportation
Companies can form an alliance to ensure continuous flow of materials.
Various air cargo companies such as Aeroméxico Cargo, KLM Cargo, Delta Air Logistics, Air France Cargo, CSA Czech Airline Cargo, Korean Air Cargo, etc. have formed an alliance called SkyTeam Cargo that will enable them to switch carriers quickly in the event of political disruptions (landing rights, labour strikes, etc.). Moreover, this alliance has enabled SkyTeam Cargo to provide low-cost global deliveries to 500 destinations in 110 countries.
(3) The alternative routes
We also can implement the alternative routes so as to increase the efficiency of the transportation and ensure smooth material flows along the supply chains. For example, due to long delays at the west coast ports and heavy traffic jams along various west coast freeways, some east coast companies are encouraging shippers to develop new routes in addition to the traditional route. Specifically, after the west coast ports were shut down for 2 weeks in 2002, some shippers considered shipping various manufacturing goods from Asia to east coast ports via Panama Canal. (Tang, 2006)
Some studies compare the proactive action with reactive actions with regard to the cost that companies pay. There are discussions below.
Proactive costs include investment in building an adequate level of inventory and storage facilities, and investment in a robust infrastructure. However, proactive response may result in underutilized resources if the disasters are not frequent or if the demand is volatile. In contrast, the real-time (reactive) response requires agility, implying rapid response and flexibility. Although the utilization of resource in reactive response is high, the cost of procuring resources at a short notice and in a chaotic environment can also be very high. (Chakravarty, 2011)
Thus, there is a trade-off between efficiency and redundancy.
Conventionally surplus capacity and inventory have been seen only as ‘waste’ and are therefore undesirable. However, the strategic disposition of additional capacity and/or inventory at potential critical points can be extremely beneficial in the creation of resilience within the supply chain. The trade-offs inevitably involve the judgemental balancing of the cost involved in maintaining slack capacity and inventory, against the probability and likely impact of a negative event. (Christopher & Lee, 2004) Christopher & Lee (2004) consider that company doesn’t need to save the days of buffering every stage in the supply chain with safety stock or excess capacity. They suggest the strategic and selective use of ‘slack’ to increase supply chain resilience. The cost of proactive decisions must be balanced with the cost of reactive decision. (Chakravarty, 2011)
However, Weichselgartner (2001) thinks the approaches of mitigating natural disasters must place emphasis on pro-active rather than reactive actions. But other scholars like Colicchia et al. (2008) and Tomlin (2006) believe that a firm is not limited to choosing a single tactic. An effective risk management strategy should consider a combination of tactics.
2.3Quantitative Methods on Resilience
Despite the increasing number of researches published on supply chain and
transportation resilience, there has been little application of quantitative modeling techniques to both topics. (Falasca, 2008) Nonetheless, we try to provide a review of the quantitative methods on resilience in this section and lay more stress on transportation resilience than supply chain resilience. We then find that there are different methods to measure the resilience.
Most quantitative researches in transportation area develop the methods to explore the network resilience. (Murray-Tuite, 2006, Dorbritz, 2011, Chen and Miller-Hooks, 2011, Nair et al., 2010 )
Murray-Tuite (2006) combines methods of multiple metrics and simulation to provide a promising approach for transportation network resilience. The contribution of this paper is to address the measurement of transportation resilience through the evaluation of four
dimensions (adaptability, mobility, safety, and the ability to recover quickly) by multiple metrics that will aid future development of a single measure of resilience. It is also the first paper to examine the impacts of traffic assignment on resilience. The simulation methodology is used to generate the user equilibrium (UE) and system optimum (SO) traffic assignments for a test network. The UE assignment presents minimizing travel time for individuals, while the SO assignment presents minimizing the travel time for all vehicles in the network. The output of the simulation is then used to evaluate four dimensions. In this study, the user equilibrium results perform better in adaptability and safety while system optimum yields better mobility and faster recovery.
Dorbritz (2011) analyzes the topological and operational disaster resilience of transportation networks. The study aims to anticipate order of large-scale failures and to suggest resilience enhancements for increasing the disaster resilience by assessing the topological and operational consequences of failures. The Swiss railway and Zurich’s
tramway network are modeled and represented. Two different aspects of the disaster resilience can be analyzed: the infrastructural and operational aspect. The infrastructural aspect is the
topological features of the “scale-free networks“. The infrastructural aspect does not consider any operational data such as line paths, track and station capacities and frequencies of the lines. The second aspect, operational resilience, will be assessed by giving above information that can present which extent and where the system performance is reduced in degraded operation. The results indicate that the topological importance of infrastructures and the operational one often do not coincide.
Both Chen & Miller-Hooks (2011) and Nair et al. (2010) propose quantitative measures for the intermodal (IM) freight transport system. The methodology used by Nair et al. (2010) is based on Chen & Miller-Hooks’ (2011) concept.
To address the need for a tool for such measurement for quantifying the vulnerability of IM freight systems, L. Chen & E. Miller-Hooks (2011) designed an indicator of network resilience that quantifies the ability of an IM freight transport network to resist and recover from disruptions due to natural or human-caused disaster. Their resilience indicator considers the network’s inherent ability to cope with the negative consequences of disruptions and accounts for the impact of potential recovery activities that might be taken in the immediate aftermath of the disruption while adhering to a fixed budget. They propose a stochastic combinatorial program for quantifying network resilience as a function of throughput that can be reached post-disaster. Solution of the program also aids in identifying the optimal
post-event action to achieve the maximum resilience level. No prior work provides such means of quantifying an IM network’s vulnerability with consideration for the recovery actions, which is critical for developing insights necessary for improving IM freight transportation security
The aim of a quantitative measure of resilience in Nair et al. (2010) is to determine the best set of actions to improve security at nodal facilities in an IM network. Resilience accounts for both the innate reliability of a facility and the ability of short-term recovery actions to mitigate negative effects. It also develops the necessary steps to apply this concept to an existing port through a case-based analysis. First, a network representation for the system with all its essential processes and stakeholders is generated. Second, the disruption scenarios are developed. The third step is the evaluation of all recovery tools at the disposal of