行政院國家科學委員會專題研究計畫 成果報告
子計畫三:網路合作設計中社群建構知識的研究:創造力與
高層次思考在自然與科技領域之開展(3/3)
計畫類別: 整合型計畫 計畫編號: NSC92-2520-S-009-004- 執行期間: 92 年 08 月 01 日至 93 年 07 月 31 日 執行單位: 國立交通大學教育學程中心 計畫主持人: 林珊如 報告類型: 完整報告 報告附件: 出席國際會議研究心得報告及發表論文 處理方式: 本計畫可公開查詢中 華 民 國 93 年 9 月 20 日
合作學習異質化分組之自動化系統:DIANA
過去的研究指出進合作學習時,老師如能對分組提出完善的規劃,更能發揮合作學習的效 果,尤其建議組成異質化的合作學習小組,此外,如能考慮與學習成果息息相關的心理變 項,會比只考慮背景變項來得更有意義。本研究小組以基因演算法來執行分組的計算,分 組的目標是對全班每一位同學力求公平、學習機會均等、分組有彈性、且對老師而言不至 於太麻煩。66 位大學生參與本研究為受試,DIANA 系統先將受試的思考型態以修正過的 K-means clustering 分為三個同質群,從三個群體各抽取一位學生形成一個隊伍,其三角 形 座 標 都 必 須 相 似 於三 群 的 三 個 中 心 點 所 組 成 的 原 型 三 角 型(cluster centers as the prototype)。以上述方式組成 12 異質組(36 人),又稱為實驗組;另有 10 組隨機組合的隊 伍為控制組。他們一起學習基本的大一電腦課程,並須繳交鋪設一個公司網路的設計報 告,實驗組的成績遠高於控制組,且實驗組的工作滿意度也高於控制組。DIANA: A computer supported grouping system
to assist teachers in assigning heterogeneous groups
Abstract
This study encourages teachers to deliberately organize groups in conducting small group learning. Heterogeneous grouping is particularly recommended and psychological factors that are closely related to group outcomes can be considered as the grouping factors. A computer supported grouping system, DIANA, using genetic algorithm was designed to achieve goals of fairness, equity, flexibility, and easy implementation for teachers. The grouping adequacy is considered both in individual level and whole class level so that an allocation of a student to a suitable group does not increase debts of other groups. Thirty-six computer science students were first segregated into three clusters using a modified K-means clustering. The triangle shape of the cluster centers can be viewed as the representative shape of all heterogeneous groups. Then from each cluster, a student is selected to form a group and finally 12 heterogeneous groups were formed based on three thinking styles (Sternberg, 1994, 1998). In the study, groups had to design a task about computer network. We found the performance of the heterogeneous groups was higher and the variation among theses groups was relatively smaller than those of 10 random groups (N = 30). Besides, more subjects in the heterogeneous groups felt satisfied with group members’ attitudes, cooperative process, and group outcome than those of random groups. The random groups expressed the least satisfaction about cooperative process compared with
satisfactions about member attitude and group outcome. In final section, several suggestions for implementation and future studies are offered.
Keywords: cooperative learning, small grouping learning, computer assisted grouping system, group composition, thinking styles, university students
Introduction
Cooperative learning has long been recognized as an important and effective teaching method (Cohen, 1994a; Johnson & Johnson, 1989; Sharan, 1999; Slavin, 1995). Research results show that cooperative learning benefits students in cognitive perspective (such as gaining higher achievement), affect perspective (such as positive motivation), and behavior perspective (such as social skills). Researchers (Abrami, Chambers, Poulsen, De Simone, d’Apollonia,S.,& Howden, 1995; Cohen, 1994b; Johson & Johson, 1994; Kagan, 1994; Sharan & Sharan, 1992; Slavin, 1995) also suggest that several factors influence the effectiveness of cooperative learning. For example, group interdependence, group development, task demands, resource and process during
cooperation, and interracial and interethnic relations. The relations among these factors were also searched. In general, previous studies have formed a solid bank of evidences to guide teachers’ implementation.
However, teachers often found management of cooperative learning or any form of small group learning quite difficult. Many teachers realized that students lack of social skills to work with peers (Johson & Johson, 1991). Some faced the problems of social loafing (Steiner, 1972) and others admitted time consuming problem (Fox & Lorge, 1962). In fact simply putting students to work together may not promise quality cooperative learning. From the review of Cohen (1994b) and process loss perspective of Steiner (1972), teacher should pay particular attention to design an adequate cooperative task. From the review of Johnson and Johnson (1990) and Slavin (1995), positive interdependence among group members, members’ meaningful interaction, individual accountability for learning, training for collaborative skills, and group rewards are essential. Besides, one of the major problems occurs in the very beginning of group process: teachers do not know how to compose groups that leads to a successful teamwork. If teachers are able to assign students to adequate groups, students are more likely to have a successful start of cooperative learning.
In composing groups, teachers must make 2 critical decisions, first, what characteristics of
students should be considered in forming a cooperative learning group. Some researchers (Cohen, 1997; Cordero, Di Tomaso, & Farris, 1996; Savicki, Kelley, & Lingenfelter, 1996) suggest
composing groups by students’ background categories (such as ability, gender, or race). However, research results have shown psychological features (such as self efficacy, Bandura, 1997 or learning styles, Sternberg, 1998) strongly affect group learning outcomes. Therefore it is reasonably to take these psychological features into account in forming groups. Second, teacher has to consider what type of group is of more valuable. As far, many researchers in cooperative learning and small group learning suggest heterogeneous groups as more effective both in performance and group process (Dembo, 1994).
When teachers are willing to attempt a more sophisticated way of grouping, i.e., using multiple psychological variables as grouping factors to form heterogeneous groups, the heavy computation of this grouping technique may become an obstacle of implementation. Therefore, we designed a computer-supported grouping system – DIANA to assist teachers and the advantages of this system are descried in the following section. This system is a recent improved version in a 4-year project (1999-2003) on Internet-based cooperative learning. One of the major goals of this project is on grouping techniques and grouping effect examination.
The rest of this paper is organized as follows. The second section introduces literature review about grouping rationales in cooperative learning (or small group learning) and the grouping variable, thinking styles, used in this study. It also introduces a previous attempt of grouping technique in our research group, the advantages and weakness. Section three illustrates in detail the new, improved grouping method. Then section four contains the experiment procedures and results. In the final section discussion and implications are presented.
Literature Review
How teachers usually compose groups?
Most of the time, there are three ways, as in the following, that students are organized into groups.
1. Students choose their own groups.
Abrami, et al. (1995) indicates if students are allowed to form groups by themselves, they often choose teammates based on friendship or interests about learning topics. Friendship groups are very likely leading to homogeneous group, no matter in terms of ability, race, or gender. It facilitated cooperation as a result of harmonious communication. Interest groups can be
composed in different size. Students in a large group may not interact efficiently and those in a small group cannot take the advantage of sharing multiple perspectives. However, shy or less sociable students are easily left out when students can form their own groups.
2.Students are grouped by teacher randomly or spontaneously.
In many occasions, teachers assign students to groups. One of the most simple and frequent used grouping method is to form proximity groups that member works with his/her neighbors (Abrami, et al., 1995). Besides, teachers often assign students to groups in a random or any spontaneous way. For example, teachers ask students to read aloud in order of a set of random colors. All students who read the same color, say, red, form a group. In this case, no one will be rejected or left out and it spends less time to structure group. However, spontaneous groups are not suitable for complex tasks, because some groups may compose of low-ability students. Cohen (1994b) also indicates that random or spontaneous grouping may unintentionally compose students of unbalance status (ethnic or social economic). Thus white (or higher social status) students easily dominate minority (lower status) students for they are more active and influential.
3. Students are grouped by teacher according to their characteristics.
When teacher form groups in a deliberate way, ability or prior achievement is the most salient characteristic that teachers consider to assign students to groups. Abrami, et al. (1995) indicates that heterogeneous-ability group benefits high-ability students as well as low-ability students in learning. However, high-ability students may easily complain about spending much time to teach others, and low-ability students may feel singled out for needing special attention. On the contrary, adequate use of homogeneous-ability grouping can encourage high ability students to work to their potential. Unfortunately, the polarization of whole classroom may occur.
Webb (1989) reviewed studies on helping behaviors in cooperative groups. She found when students were assigned in homogeneous groups, all-high-ability or all-low-ability groups, they often ask for terminal help (e.g., tell me the correct answer) or surface information. Students lacked the motivation to explain or discuss. Moreover, members in all-low-ability groups hesitate to ask for any help. Therefore, in forming cooperative learning groups, it is better to include both high and low ability people in a group.
Many researchers (Abrami, et al., 1995; Cohen, 1986, 1994a; Web, 1985) suggest that other characteristics are also closely related to learning performance and effective interaction in cooperative learning, for example, gender, ethnic or social economic status, and certain
personality. Webb (1985) suggests to form gender heterogeneous groups because when boys and girls are equal numbered, everyone in the group may obtain enough assistance. If boys
outnumber girls or vice versa, boys can get more assistance. Besides, when girls are more than boys in a group, girls tend to leave all the problems for boys. In college level, Savicki, Kelley, and Lingenfelter (1996) composed cooperative learning groups by gender. Three groups were formed, one heterogeneous where female and male students worked together and two
homogeneous groups, female-only and male-only. This study observed how groups used computer-mediated communication to discuss psychological issues in a psychology class. However, they found female-only group sent more CMC words and were more satisfied with the group process.
Huxham & Land (2000) considered individuals’ psychological feature to “engineer” group performance through heterogeneous grouping. They differentiated students’ working roles as activist, reflector, theorist, and pragmatist, and then assigned students of various roles to groups. This grouping method intends to not only control between-group difference but also increase within-group difference. The results show that the heterogeneous groups performed as well as the random groups.
Heterogeneous group versus homogeneous group
In general, considering students’ characteristics, teachers may group students in two alternative ways, to form heterogeneous group or homogeneous group. Heterogeneous group provides an ample chance for students to learning how to work effectively with different people. Many studies (Cohen, 1994a; Johnson & Johnson, 1994) found that heterogeneous grouping enable students to achieve better in academic knowledge and social skills. But the range of member difference within group should not be too extreme to prevent the impairment of possible cooperation (Webb, 1989). On the other hand, homogeneous groups were organized to have smooth communication.
Many researchers suggest form heterogeneous groups because it promotes positive
interdependence in the process of cooperation. Hence, in this study our grouping goal is to achieve suitable heterogeneity.
Thinking styles as the characteristic in composing cooperative groups
outcome of cooperative learning. Thinking style is proposed by Sternberg (1998) to describe personal habits and attitudes of utilizing one’s own thinking. It is not talent or ability per se but personal preferences of the directions to bring out intelligence. Sternberg uses an analogy of mental government to indicate how we manage our various cognitive capacities and how people conduct their mental government in different manners.
People show different thinking styles and Sternberg (1998) suggests 13 styles. For example, legislative thinking style people like to think innovative ideas and do things according to their own rules so they tend to neglect pre-structuralized rules in doing works. Executive thinking style people tend to follow prescribed rules in performing their works and they like ideas that can be fully understand. Judicial people do not pay much attention to follow rules or not; instead they like to judge and compare various ideas, even rules. Legislative, executive, and judicial thinking styles are three examples of various functions of mental government. For a detail description of all 13 thinking styles belonging to 5 dimensions, please see the book of Sternberg (1998).
Sternberg (1998) indicates if one’s thinking style matches the environmental conditions one would perform well. Whereas individuals may not learn well, if their thinking styles are incompatible with the environment requirements. Sternberg (1996) also suggests teachers to compose cooperative teams according to students’ various thinking styles, specifically to invite three members of the above three thinking styles to complement each other in carrying out a task. He proposes that groups composed of people with different thinking styles would perform better. If teachers intend to use psychological variable, such as thinking styles, as grouping factors, there are two problems to be solved. First, because psychological variables are often continuous data, it is difficult to find out a reasonable cut-off score so as to categorize students as high or low scorers. Second, instead of considering one single demographic variable, if multiple
psychological variables serve as the grouping factors, grouping would become very complicated. Our grouping strategy must solve these problems. Besides, the goal of our grouping strategy is to assign students to the most suitable group so that all groups have similar capacities to achieve high.
The computational study on grouping
As described in the introduction section, our research team has worked on Internet based
cooperative learning for quite some time (Lin & Sun, 2000, 2001) and designed several computer supported grouping techniques. One previous version of our grouping methods is introduced in detail in the following.
This heterogeneous grouping technique adopts artificial intelligence algorithm following the principle of Random Mutation Hill Climbing (RMHC, Russell & Norvig, 1996) and is named RMHC grouping. In this algorithm, each student is treated as a spot in a space that is denoted as a vector of several numbers measured by the thinking style scales (Lin & Chao, 1999). The differences between students are conceived as Euclidian distance in this given space. Any pair of three students may form a triangle shape in the space and is considered as a group. Based on such
convertibility, the goal to compose heterogeneous groups of various thinking styles is transferred to find out the bigger triangles as far as possible.
If the difference within group is defined by distance, we can know the optimal solution would be found by the following exhaustive algorithm. The first step is to construct distance matrix of all possible pairs, then the pairs with the largest distance are aggregated, and go on until there are three spots aggregated each other, a group produced. Repeat aggregating all other possible triads until no more triad can be found. Because the complexity of such exhaustive algorithm is too heavy, we adopted RMHC to find the near global optimal solution quickly.
Though these algorithms assign students to groups according to the difference of thinking styles within group, within-group difference decreases gradually when all possible groups were organized. For groups having the smallest heterogeneity, they are relatively homogeneous in nature. And the most problematic part is how to decide the cut-off point for heterogeneous and homogeneous groups.
RMHC grouping algorithm based on computing distance intuitively seems reasonable, but it ends up drive away from the original goal – forming heterogeneous groups. Groups recommended by this algorithm became more and more non-heterogeneous. The problem is illustrated using an example of six students in a class in Figure 1. In this case, teacher aims to group them for two groups according to two psychological characteristics. Each student can be viewed as a spot in a two-dimensional space in the first sequence of Figure 1. In sequence 2, A, B and C are assigned to a group that is the most heterogeneous one among all possibilities. If A, B and C is assigned as group 1, then D, E and F are remained inevitably to form group 2. However, group 2 of D, E and F is not heterogeneous relatively. Thus assigning C into group 1 increases debts of group 2 (becoming rather homogeneous) and thus jeopardizes the original grouping goal. Therefore, this outcome contradicts the goal of heterogeneous grouping in the whole class level. The grouping method using greedy strategy may end up with such troublesome solution because it considers individual benefit rather than benefits of all individuals as a whole.
Considering educational equity, we suggest that every student should benefit from cooperative learning. To achieve this goal, teachers must seek a strategy to assign every student into an adequate group for a successful start of cooperative learning. We should not cause non-uniform groups due to form some top-grade groups. Actually, the optimal grouping recommended is to assign A, B, and E to group 1, while C, D, and F to group 2 as shown in sequence 3 of Figure 1. Members of these two groups are various within groups and the allocation of a student to a suitable group does not harm the composition of other groups. Therefore, we proposed a novel computer-assisted grouping system, described in the following section, to solve the problems of previous RMHC grouping technique.
A B C D E F A B C D E F A B C D E F 1. Students spread on the two
dimensions space
2. Grouping basing on
distance 3. The optimal groups
Figure 1: An example of the grouping algorithm based on distance
The computer-assisted grouping system, DIANA
The new grouping system, DIANA (Difference withIn groups And Non-difference Among groups), considers teachers’ practical needs and flexibility at the same time. It can achieve at least 4 goals. First, because of instructional requirement of fairness, this grouping technique must form group of the same size. Second, for educational equity, all students should be taken care of and assigned to the most suitable group. Third, for the concern of flexibility, teachers can consider no matter single or multiple psychological variables or background information in forming groups. Fourth, following research recommendation, the goal is to form heterogeneous groups.
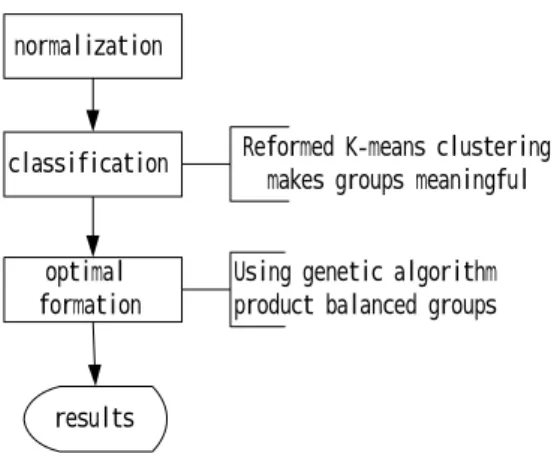
When teacher uses DIANA grouping system, the first step is to input students’ single or multiple characteristic(s) measured by psychological questionnaires. Next, teachers must determine group size with considerations of instructional objects and ease of management. The DIANA system then performs computation and recommends heterogeneous group compositions. Finally, teacher receives a grouping result report including each student’s characteristic(s) and team number. This system consists of three stages, 1) normalization, 2) classification and 3) optimal formation. Figure 2 shows the flow chart. During the normalization stage, all data are normalizes to the range between 0 and 1. Thereby, each factor is of equal weight.
normalization
Reformed K-means clustering makes groups meaningful
results
Using genetic algorithm product balanced groups classification
optimal formation
Because the goal is to keep a certain degree of diversity within group and to maintain a certain degree of balance between groups, after normalization, students are classified to various clusters in the second stage of classification. We separate subjects into several meaningful and distinctive clusters. Individuals in each cluster must gather around their cluster centers and very few people are left in between clusters so that clusters are as dispersed as possible. Then from each cluster, a student is picked out to a group to ensure member’s distinctive features. Thus we equally
emphasize individual preferment and global preferment.
Besides, we set the initial cluster center at the utmost of each dimension in order to produce the greatest distinct types. This method is easy to compute and must converge. K-means clustering needs to decide the exact number of cluster in the beginning of computation but that is always a very difficult decision when everything is uncertain. Fortunately, our method forsakes teacher from doing this awkward decision, because the number of clusters is the number of members within a group. Because one student was selected from each cluster to form a group, therefore the triangle shape of three cluster centers can be viewed as the prototype shape for all
heterogeneous groups. The shape served as the control of heterogeneity within groups and the maintenance of balance among groups.
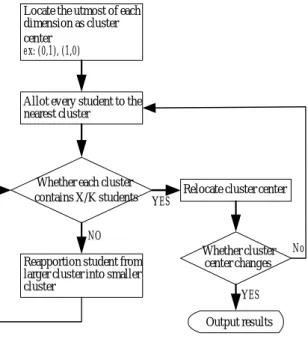
The technique of classification we adopt is a refined K-means clustering method and the flow chart is shown in figure 3. The steps of the refined K-means clustering are:
1. Deciding the initial locations of all cluster centers.
2. Allotting every student to the nearest cluster among all possibilities. 3. Reapportion student for equal amount of groups.
4. Relocating the cluster center. If cluster center is changed, goes to step 2. Locate the utmost of each
dimension as cluster center
ex: (0,1), (1,0)
Allot every student to the nearest cluster
Whether each cluster contains X/K students
Reapportion student from larger cluster into smaller cluster
NO
Relocate cluster center
Whether cluster center changes YES YES No Output results
Figure 3: Flow chart of classification stage: X students are to be assigned to K groups.
After ascertaining students’ cluster identity, this system begins to form groups in the third stage, optimal formation. In order to get optimal solution, we adopted genetic algorithm (GA, Holland,
1975) to evolve the approximate solution. GA is a framework abstracted of biological evolution. In GA system, genetics-inspired operators of crossover, mutation, and inversion are used to move from one population of chromosomes to a new population, and a better solution evaluated after some generations. In our optimal formation stage, the design of genetic algorithm is listed in the following:
1. Chromosome:
One chromosome represents one group, that is, each gene of chromosome is one student of each cluster. Therefore, the length of chromosome equals the number of cluster (the group size we want to form). The population size equals to the numbers of the subject divided by the group size. For example, if there are ninety-nine students in a class and we are to form three-person (triad) group. That is, the population contains thirty-three chromosomes with length of three (see figure 4). A D G B E H C F I A B C D E F G H I Three clusters formed after
classification stage Chromosome 1 Chromosome 2 Chromosome 3 Cluster 1 Cluster 3 Cluster 2
Randomly select from cluster 1 Randomly select from cluster 2 Randomly select from cluster 3
The initial population of three chromosomes with length of three
Figure 4: The decoding of chromosome and the initial population
2. Fitness:
To avoid the problem of RMHC grouping method, we give up using distance as within-group difference. A critical modification takes place here. Because one student was selected from each cluster to form a group, therefore the shape of the final cluster centers can be viewed as the prototype shape for all heterogeneous groups. The shape served as the control of heterogeneity within groups and the maintenance of balance among groups. In Figure 5, the triangle of three final cluster centers is searched and served as the targeted shape. Next, we compute differences between the shape of the chromosome and the targeted shape. Finally, the fitness of any
chromosome is determined by the inverse of the absolute value of the difference. Hence, the greater fitness value the better it perform.
3. Crossover:
Two chromosomes are randomly selected from current population and then cross over at a randomly chosen point to form two offspring. In this study, we do not do crossover with probability but do if the fitness of the offspring become better then parents.
4. Mutation:
improvement.
In the optimal formation stage of DIANA grouping system, the GA works as follows: 1. Start with a randomly generated population based on the result of classification stage. 2. Calculate the fitness of each chromosome in the population.
3. Randomly select two chromosomes and check if the fitness becomes greater after crossover. If it becomes greater, do crossover; else do mutation with probability 0.001.
4. Replace the current population with the new population. 5. Go to step 2.
Each iteration of this process is called a generation. In this study, we set generation size as 500. The previous RMHC method used distance to represent within-group difference would lead to greedy algorithm. Therefore, it forms the most heterogeneous group and many other non-heterogeneous groups, so that in general it destroys the global grouping performance. Although this modified DIANA algorithm seems like hill-claiming, it does not fall into local optimal. DIANA method can not generate the most heterogeneous groups, but it keeps all groups in similar degree of heterogeneity and prevents extreme homogeneous grouping.
Then an experiment was conducted to examine the grouping effect produced by DIANA system compared with random assigned groups. The research questions are listed as follows.
Research Questions
1. Which groups, heterogeneous or random, perform better in cooperative learning?
2. Which groups, heterogeneous or random, make better subjective comments about partners, process of the cooperative learning, and group outcomes?
Experiment
A between-subject design was adopted. The treatment was the grouping method (2 levels: heterogeneous or random grouping) and the dependent variable was the achievement of
cooperative learning. Besides, subjects’ perception about cooperative process was investigated. Subjects
Subjects were 66 computer-science freshmen enrolled in a beginning level class of computer science at a technology university in northern Taiwan. Because it was their first semester of university learning, students were not familiar with each other. Three students were assigned to a group. Subjects were randomly split into two sectors. The first sector including 36 students was recommended by DIANA system to form 12 groups. While the second sector with 30 students were randomly composed as 10 groups. All teams were asked to work together for a cooperative design project during a 4-week period.
Group task
During four-week class period, the groups have to design a computer network (Intranet and Internet) connecting offices of a company. The floor map for the company and the management hierarchy, for the further consideration of network security, were provided. The goal of the task was to specify hardware and software needed, to propose specific network functions, to provide
mail system for employees, to design network security, and finally lay out a network typology. Groups were told to discuss, work together, and document the cooperative process. They must report personal accountability, i.e., who is in charge of which part of the project. A weekly evaluation of group members’ work was also required to avoid social loafing.
Assessment of group task
Two computer science graduate students with substantial teaching-assistant experiences rated all group tasks. If a group finished one requirement of the group task in any one of the correct ways, they gained one correct score. If a group presented a solution for any requirement of the group task, no matter the solution was correct or not, we counted this solution as one completion score. The percentage of correct score over all requirements was called the accuracy of the request (AR). Sometimes a group may not be able to finish all requirements and the percentage of correct score over whatever they complete was called the accuracy of completion (AC). AR and AC together count for the total score as the formula in the following.
score completion score correct request the score correct = = AC AR Total score = AC AR AC AR 2 + × × = score completion request the score correct 2 + × Experiment process
The experiment was conducted in the spring of 2003.
1. In the third week of semester (pretest time), students were asked to fill in the thinking style questionnaire and then data was input into DIANA system for use of grouping.
2. Before experiment (the 9th to 12th week), group list was announced and the teacher asked group members to get familiar with each other during class.
3. In the first week of group work (9th week), students were asked to plan their cooperative process. In the following weeks of group work, teacher taught according to the instructional plan but saved one-hour class time for group work to ensure members did engage in the group process. To emphasize personal accountability and cooperation, from the second to the last week of the group process, every member took turn for the wrap up and hand in the group work.
4. After the completion of group task in the 13th week, a questionnaire about perceptions of member’s attitude (7 items), cooperative process (4 items), and group outcome (3 items) was distributed to all subjects. The item is in 5-point Likert scale. Typical item of group members’ attitude states. ”Other members of my team bring in critical knowledge and skills to work on the assigned group task.” An item of cooperative process indicates. ”Discussion in my team easily reaches effective conclusion.” The statement of group outcome denotes ”I am satisfied with the outcome of my team.”
Results
Table 1 shows means, standard deviations, and correlation matrix of three thinking styles for all subjects. In this study, because the executive style and judicial style appears to be correlated significantly (in Table 1), it is impossible to find obvious and exclusive legislative, judicial, or executive thinkers in order to for heterogeneous groups. However, our grouping system is able to solve this problem.
Table 1. The description statistics and correlation matrix of thinking styles served as grouping factors
Thinking style Mean SD Exe Leg Jud Executive 31.93 3.42 --
Legislative 30.33 3.73 .247 --
Judicial 25.33 4.56 .408** .200 -- ** p < .01
Figure 5 shows the result of the classification stage. It classed students into three clusters with centers in (0.82, 0.79, 0.59), (0.79, 0.87, 0.75), and (0.66, 0.74, 0.57) respectively. Cluster 1 seems to be composed by high legislative scorers, cluster 2 by high executive and high judicial ones, and cluster 3 by the lowest scorers in three thinking styles. Then genetic algorithm was performed to search an optimal solution.
Figure 5: The result of the classification stage in the small sample of 36 college students. The triangle is formed by the final cluster centers.
Achievement for heterogeneous groups and random groups
In the statistical test of achievement difference, a non-traditional of significance was used: p < .1.
Because the group size is small (12 for heterogeneous groups and 10 for random groups), the
Red: Cluster 1 Blue: Cluster 2 Yellow: Cluster 3 Center Cluster 1: (0.82, 0.79, 0.59) Center Cluster 2: (0.79, 0.87, 0.75) Center Cluster 3: (0.66, 0.74, 0.57) • : students’ thinking style ● : Cluster center
comparison involving these groups have relatively low power, and thus traditional cutoff value (p
< .05) would lead to unacceptable high probabilities of type II errors.
The accuracy of completion score (AC) in Table 2 conveys if groups tried to solve a problem, about 82% to 85% they could solve the problem (heterogeneous groups 85.77% and random
groups 82.42%). Differences between the heterogeneous and random groups were not significant. It indicates that no matter heterogeneous or random, were of the same capability in solving
problems. However, the accuracy of request score (AR) shows that the heterogeneous groups correctively solved 64.13% of all requirements of the group task that is significantly more than what the random groups could do (48.4%). It suggests that the heterogeneous groups seems cooperate in a more effective manner so that these groups could solve more problems than the random groups. The total score takes AR and AC scores into account and the differences between the heterogeneous and random groups were also significant.
Table 2. Descriptive statistics and t test of achievement differences between the heterogeneous and random groups.
Group # Mean SD t-test (p) AR Random groups Heterogeneous groups 10 12 .4840 .6413 .2748 .1548 -1.691 (.106 *) AC Random groups Heterogeneous groups 10 12 .8242 .8577 .1908 .0942 -.540 (.595) Total Score Random groups Heterogeneous groups 10 12 .5759 .7237 .2641 .1284 -1.716 (.102 *) * P < .10
AR: accuracy of request; AC: accuracy of completion
Also in Table 2 the standard deviations of AR, AC and total score of the heterogeneous groups seems smaller than those of the random groups. Then, a F-test was used to examine the differences. Table 3 shows that standard deviations of AR, AC, and total score in the
heterogeneous groups were significantly greater than those in the random groups. In general, the heterogeneous and random groups were equally good at solving problems. But the
heterogeneous groups were more effective and differences among 12 heterogeneous groups were small. Comparatively, the random groups were less effective while group differences were larger. Table 3. F-tests of achievement variance differences of the heterogeneous and random groups.
Group # SD F-test AR Random groups Heterogeneous groups 10 12 .2748 .1548 3.151 ** AC Random groups Heterogeneous groups 10 12 .1908 .0942 4.264 ** Total Score Random groups Heterogeneous groups 10 12 .2641 .1284 4.231 ** * p< .01
Subjective perceptions about interaction
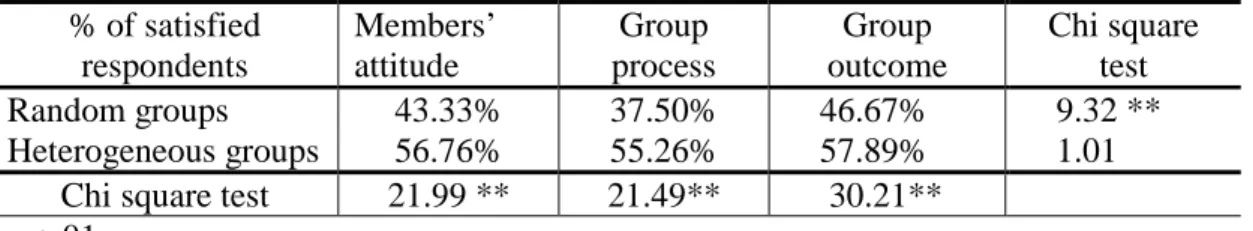
If a subject responds positively to the questionnaire (4 and 5 in the 5-ponit scale), it is counted as a satisfied respondent, else (1 to 3) as a non-satisfied respondent. Table 4 shows that more subjects in the heterogeneous groups respond positively than those in the random groups, no matter about members’ attitudes (Chi square = 21.99), group process (Chi square = 21.49), and group outcome (Chi square = 30.21). It suggests that more subjects in the heterogeneous groups felt satisfied with members’ attitudes, cooperative process, and group outcome than those in the random groups. Furthermore, for the random groups, they perceived significantly different degrees of satisfaction about member attitudes, group process, and group outcome (Chi square = 9.32). The random groups express the least satisfaction about cooperative process (37.50%) compared with satisfactions about members attitude (43.33%) and group outcome (46.67%). Table 4. Percentage of satisfied respondents of the heterogeneous and random groups and chi square analysis. % of satisfied respondents Members’ attitude Group process Group outcome Chi square test Random groups Heterogeneous groups 43.33% 56.76% 37.50% 55.26% 46.67% 57.89% 9.32 ** 1.01 Chi square test 21.99 ** 21.49** 30.21**
p< .01
Conclusions and Implications
In this study a computer supported grouping system, DIANA, was developed to assist teachers in conducting any form of small learning groups. From the literature review and the experiences brought from our previous attempt of a less successful grouping technique, we hope DIANA can achieve at least several goals. First, DIANA must be able to form group of the same size. Then, we hope DIANA can assign students to suitable groups but not to increase debts of other groups. For teachers’ convenience, we hope this grouping technique can consider multiple psychological variables or background information at the same time. Of the most importance, the grouping adequacy is considered both at individual level and at whole class level. DIANA adopted genetic algorithm and the detail computational procedure was illustrated.
The grouping effect was examined in a college class of 66 computer science majors. We used a between-subject design with random assignment of subjects to experimental and random groups. Nonetheless, because the sample size was small, the generalization of the current findings to other samples, settings (e.g., academic universities), or fields other than computer science must be made with caution. Also because of small sample size, a non-traditional significance value (p < .1) was adopted. The reason of using this non-traditional value was explained above, but again the interpretation of the results has to be very conservative. Future studies can include larger samples from various fields to test effects of heterogeneous grouping.
clustering as three meaningful clusters based on thinking styles. The high legislative scorers were categorized as the cluster 1, the high executive and high judicial ones as the cluster 2, and cluster 3 the lowest scorers of three thinking styles. Because one student was selected from each cluster to form a group, therefore the triangle shape of three cluster centers can be viewed as the prototype shape for all heterogeneous groups. The shape served as the control of heterogeneity within groups and the maintenance of balance among groups. Then a genetic algorithm was performed to search an optimal solution.
The findings showed that both the heterogeneous groups recommended by DIANA and random groups could correctively solve about 80% of the problems they attempted. However,
considering all requirements of the group task, the heterogeneous groups correctively solved about 65% of all requirements that is more than what the random groups could do (about 50%). These findings reasonably suggest that all groups in the sample were of similar capacity.
Furthermore, the data suggests the heterogeneous groups worked in a more effective manner. The subjective perception of satisfaction confirmed this suggestion again. More subjects in the heterogeneous groups were satisfied about group learning than those in random groups. The random groups expressed the least satisfaction about cooperative process compared with satisfactions about member attitude and group outcome.
This study contributes to research on small group learning and cooperative learning. Previous attempts on grouping almost considered single variable, such as ability or achievement (Johnson & Johnson, 1994), or categorical background information, such as gender and ethnic (Webb, 1989, Cohen, 1982). DIANA can assist teachers to make more complex grouping decision. This system can take multiple continuous variables into account and grouping students with
psychological variables that are closely related to successful group learning outcome and helpful interaction.
However, using adequate grouping technique is merely a start of structuring effective groups. It does not always lead to a promising group outcome. Teachers need to pay attention to the
considerations, such as social skill training in advance of small group learning, the selection of an appropriate group task, and management to promote positive interdependence among group members.
Reference
Abrami, P. C., Chambers, B., Poulsen,C., De Simone, C., d’Apollonia, S., & Howden, J. (1995).
Classroom connections: Understanding and using cooperative learning. Toronto: Harcourt
Brace & Company.
Bandura, A. (1997). Self-efficacy: The exercise of control. New York: W. H. Freeman and
Company.
Cohen, E. G. (1982). Expectation states and interracial interaction in school setting. Annual Review of Sociology, 8, 209-235.
Cohen, E. G. (1994a). Restructuring the classroom: Conditions for productive small group.
Review of Education Research, 64(1), 1-35.
Cohen, E. G. (1994b). Designing groupwork (2nd ed.). New York: Teachers College Press.
Sociological theory in practice. New York: Teachers College Press.
Cordero, R., Di Tomaso, N., & Farris, G. F. (1996). Gender and race/ethnic composition of technical work group: relationship to creative productivity and morale. Journal of Engineering and Technology Management, 13, 205-221.
Dembo, M. H. (1994). Applying educational psychology (pp. 172). NY: Longman.
Fox, D. & Lorge, I. (1962). The relative quality of decisions written by individuals and by groups as the available time for problem solving is increased. Journal of Social Psychology, 57,
227-242.
Holland, J. H. (1975). Adaptation in natural and artificial system. University of Michigan Press.
(Second edition: MIT Press, 1992.)
Johnson, D. W. & Johnson, R. T. (1989). Cooperation and competition: Theory and research.
Edina, MN: interaction Book Company.
Johnson, D. W. & Johnson, R. T. (1994). Learning together and alone: Cooperative, competitive, and individualistic learning. Boston: Allyn and Bacon.
Johnson, D. W. & Johnson, R. T. (1990). Cooperation in the classroom. Edina, MN: interaction
Book Company.
Kagan, S. (1994). Cooperative learning (10th ed.). San Juan Capistrano, CA: Kagan Cooperative
Learning.
Lin, S. S. J. & Chao, I.-C. (1999). The Manual for use with Thinking Style Inventory-Taiwan version. Unpublished manual.
Lin, S. S. J., & Sun. C. T. (2000). Team-forming recommendation for Web-based cooperative learning: Learning effect and partner preference. Paper presented at the 2000 annual
meeting of National Association for Research on Science and Teaching, New Orleans, USA. Lin, S. S. J., & Sun, C. T. (2001). A content analysis of online discussion for networked
collaborative design. Paper to be presented at CAL 2001 meeting, University of Warwick,
Conventry, UK.
Lou, Y., Abrami, P. C., Spence, J. C., Poulsen, C., Chambers, B., & d’Apollonia, S. (1996). Within-class grouping: A meta-analysis. Review of Educational Research, 66(4), 423-458.
Russell, S. & Norvig, P. (1996). An introduction to artificial intelligence: A modern approach. Prentice Hall International.
Savicki, V., Kelley, M., & Lingenfelter, D. (1996). Gender and group composition in small task groups using computer-mediates communication. Computers in Human Behavior, 12(2),
209-224.
Sharan, S. (1999). Handbook of cooperative learning methods (2nd ed.). Westport, CT: Praeger.
Sharan, Y.,& Sharan, S. (1992). Expanding cooperative learning through group investigation.
New York: Teachers College Press.
Slavin, R. E. (1995). Cooperative Learning: Theory, research, and practice. Boston: Allyn and
Bacon.
Steiner, I. D. (1972). Group process and productivity. New York: Academic Press.
Sternberg, R. J. (1994). Thinking styles: Theory and assessment at the interface between intelligence and personality. In R. J. Sterberg & Ruzgis, P. (Eds.), Personality and Intelligence (pp.169-187). New York: Cambridge University Press.
Sternberg, R. J. (1998). Thinking styles. NY: Cambridge University Press.
Sternberg, R. J. & Louise, S. S. (1996). Teaching for thinking. Washington, DC :American
Psychological Association.
32-38.
Webb, N. (1989). Peer interaction and learning in small groups. International Journal of Educational Research, 13, 21-39.
Webb, N., Kenderski, C. M. (1985). Gender differences in small-group interaction and
achievement in high- and low-achieving cases. In L. C. Wilinson & C. B. Marrett (Eds.),
Gender influences in classroom interaction. Orlando, FL: Academic Press.
Acknowledgements
The authors would like to thank the National Science Council of the Republic of China for financially supporting this research under Contract No. NSC 2520-S-009-008 and NSC 91-2520-S-009-010.