國立交通大學
應用藝術研究所
碩士論文
探測使用者的負面情緒經驗—以搭乘公車為例
Probing the negative emotion of user experience from taking bus
研 究 生:陳佳志 指導教授:鄧怡莘 教授
探測使用者的負面情緒經驗—以搭乘公車為例
Probing the negative emotion of user experience from taking bus
研 究 生:陳佳志 Student:Chia-Chih Chen 指導教授:鄧怡莘 Advisor:Yi-Shin Deng 國立交通大學 應用藝術研究所 碩士論文 A Thesis
Submitted to Institute of Applied Arts College of Humanities and Social Science
National Chiao Tung University in partial Fulfillment of the Requirements
for the Degree of Master in Art in Design Feb 2010 Hsinchu, Taiwan 中華民國 九十九 年 二 月
i
致 謝
首先,很感謝百忙中抽空的口試老師:莊老師、小馬老師和指導老師鄧老師,謝謝你們的 寶貴意見和給予肯定。我很喜歡莊老師的親和力和嚴謹的研究態度,還有小馬老師總是可以用很 幽默風趣又讓人感到貼心的方式給予學生建議,以及鄧老師的苦口婆心和細心叮嚀(我想鄧老語 錄不是浪得虛名!),除了在論文上的幫助外,我真的受益良多。 也很謝謝我的指導老師 鄧怡莘老師,從進研究所以來就可以感受到老師的深不可測,因為 什麼都可以談,做研究、談設計、聊八卦、談感情、講未來、問這季日劇哪一部好看…在老師的 指導之下,過得很開心也很自在,因為就好像朋友般的師徒關係。雖然這個朋友有時挺嚴格的, 但我知道他是為我好,想到這點就啾甘心啊!(哈)當然,鄧老師有著做研究的嚴謹態度、靈活的思 維和敏銳的判斷力,加上隨時不斷自我要求更新的那種態度更是令人敬佩,在我心中一直是個優 質學者的楷模。 回想研究所生活及寫論文的過程,認識了各式各樣的奇人異士,也得到了好多的貴人相助, 不管是間接還是直接的,你(妳)們都幫助我順利完成人生中這一個重要的歷程。要感謝的人太多, 以下簡單介紹:總是可以把每件事弄得超好玩的炫劭(破壞行情的根本是你啊!)、超強手繪神手的 千慧(百無禁忌,真的是甚麼都畫!)、人生導師外加見過大風大浪的阿福課長(如果沒有與你的對 談,可能我一直走錯路!)、IF 得獎王的不在嘉(我都會跟我朋友炫耀你耶!)、大姐頭陳佩(我知道你 的內心和外表其實差異懸殊)、常讓研究室有時充滿特別氣氛的英文高手吐司貓佳欣、傻大姐個 性的粘 BB(到現在還是猜不透妳啊!哈!)、簡報王加細心王的雨虹大大、甚麼都知道甚麼都厲害的 翁神、拍過廣告又趕過通告的風鈴(很謝謝妳之前的托福口語衝刺班)、口試大猜題和論文工作坊 的固定班底科虎(每天早上一起去吃早餐感覺真不賴啊!)、熱心出借研究室位子的菁妏、酷酷的但 總是語出驚人的科克(同時也是很妙的室友,我很懷念大家躺在自己床上聊天到天亮的日子!)、擁 有一般女生沒有的知識又賢慧的瑞大、外表溫柔婉約的小孟(但我知道妳和瑞大是同一掛的!)、會 給予怪異關心和維他命 B 群的歐佩(哈!)、同一條船上互相打氣的采芳、國科會曾一起努力的鈺 喬、根本不像學長的鵬鵬和帥哥士堯(你們幫忙跑問卷真的大感謝!)…以及所上學弟妹們的打氣和 所有老師的相挺,加上所有接受我訪談和填問卷的熱心朋友們,真的有太多人要感謝,也很高興 能夠擁有這麼棒的研究所回憶。 最後,最感謝家裡的老爸、老媽這麼辛苦地支持我的學業、每天會陪我玩和鬧我的姐姐、一 直說我論文還要再半年卻還是幫我看論文的老哥、傳說中林同學對我那破英文的拯救、總是乖乖 地陪著我一同努力的佳蓓、在芬蘭交換學生時所遇到的心靈導師宜達建文夫婦、一起在芬蘭努力 做 project 的陳佩跟吳苑、在芬蘭開啟我 fashion 視野的泡泡…多虧你(妳)們的幫助及陪伴,我 才有這麼多采多姿的生活及回憶。 By 陳佳志 2010.Marchii
中文摘要
從 19 世紀開始就是工業量產的時代,如今,大部份的社會轉變為以服務為主的模式,從以 往購買一個產品到購買一段經驗的消費模式。在這資料爆炸的時代之下,這些支撐社會的服務以 有形或是無形的方式透過實質的物、溝通交流、環境資訊及行為而存在著。且服務的設計也連結 了文化的、社交的和人類間的互動,目的是提供人們更美好的生活經驗。近 10 年來使用者的生 活經驗和情緒開始被重視,由於情緒在生活中扮演了重要的角色,也被視為是生活經驗的中心; 除此之外,情緒更影響著人類的行為、期望和對未來的評估。然而,負面情緒經驗相關研究仍缺 乏,因此本研究旨在建立服務設計與生活中的負面情緒經驗間的相關性,以及對未來的服務設計 提出新的見解。 本研究使用了文化探針(cultural probes)、扎根理論,以及深度訪談與問卷調查來關注負面 情緒經驗與服務設計間的脈絡關係。透過乘客的自我記錄來發掘其負面情緒經驗,再把評價構造 法(EGM)作為深度訪談之腳本,並透過數量化一類分析來理解情緒與服務特質兩種變數間的關聯 性,最後由扎根理論來建立負面情緒經驗的關聯模式。 結果顯示,不同的負面情緒會由不同的刺激所喚起,乘客擁有調適自我的情緒反應,進而形 成所謂的行為/互動策略。利用情緒評價理論解釋公車的負面情緒經驗歷程,乘客關注內心的安 穩和負面的刺激形成了情緒評估的主要來源,這也是支持整段經驗的核心模板(core pattern)。 綜合以上研究結果建立出負面情緒產生的經驗模式,乘客之情緒反應行為和具體的服務特徵間的 連結關係被建立。最後,透過理解負面刺激的條件及學習乘客行為策略兩方面,對未來的公車服 務提出設計建議:公車服務設計必須喚起更多的同理心、給予乘客更多的掌控感、創造一個被信 任及準確的服務形象和大眾力量組成的反映管道,目的都是要讓乘客有個能夠安心搭乘的公車服 務系統。 關鍵字:負面情緒、文化探針、使用者經驗、服務設計、扎根理論iii
Abstract
Nowadays, most societies are becoming service-based. Consuming a service
means consuming an experience. In this informational age, the fields of cultural,
social, and human interaction can be connected by the service design. The service
design is a system challenge driven by the understanding of the human experience. As
well as the relation between design and positive emotion, the understanding of the
user experience has emerged between researchers and designers in the past decade.
However, the researches of empirically documented the link between the users’
negative emotion and service design are scant. In this thesis, the relationship between
the negative stimulus of service and the emotional response is investigated. The
context, the action, and the experience in the bus service are further discussed.
This study includes three methods, cultural probes, grounded theory, and survey.
The cultural probes are a user-centred approach which was conducted to explore
passengers’ negative emotional experience by self-documentation. The survey is
composed of an in-depth interview and a questionnaire, and the process of Evaluation
Grid Method (EGM) was done in the interview phase, the other point is that the
quantitative analyze of the questionnaire was conducted to study the accurate
relationship between the emotions and the service features by Quantitative Type I
analysis. Besides, the grounded theory was conducted to study the pattern of the
negative emotional experience through conceptualization and data review.
Results show that the different negative emotion could be aroused by the
different stimulus, and passengers had their own action / interaction strategies to
iv
theory, and the balance between a potential concern to seek inner peace and external
stimulus was delivered as a core pattern which support the whole experience. The
reason for the negative emotions is resulted from the existence of intervening
conditions reflect the stimulus to passenger, rather than the causal relationship from a
lopsided view. Furthermore, the model of negative emotional experience was
constructed by the correlations of the stimulus, the emotion, the action / interaction
strategy, and concrete service feature. As a result, understanding the passengers’
behavior can be inferred to the hardship points that suffered by passengers. According
to these findings of the study, in order to have a better bus service, the future service
should dedicated to evoke passengers’ empathy, give passengers more control, create
a trusted image, and an instant channel with the collection of public power. In
conclusion, all design implications are aim to make passengers feel peace in their
mind.
v
CONTENT
CHAPTER1 INTRODUCTION ... 1 1-1 BACKGROUND ... 1 1-2 MOTIVATION ... 2 1-3 OBJECTIVES ... 3 1-4 RESEARCH ISSUE ... 4 1-5 SCOPE ... 5 1-6 OUTLINE OF THESIS ... 6CHAPTER2 LITERATURE REVIEW ... 7
2-1 EMOTION STUDY ... 7 2-1-1 Emotion... 7 2-1-2 Classification ... 8 2-1-3 Self-report measures ... 9 2-1-4 Appraisal theory ... 9 2-1-5 Emotional influence... 10 2-1-6 Brief summary ... 11 2-2 SERVICE DESIGN ... 11 2-2-1 Introduction ... 12 2-2-2 Frameworks ... 13 2-2-3 Brief summary ... 15 2-3 RESEARCH METHODOLOGY ... 15
2-3-1 Personal involvement inventory... 15
2-3-2 Affinity diagram ... 16
2-3-3 Cultural probes ... 17
2-3-4 Grounded theory ... 18
2-3-5 Evaluation grid method ... 19
2-3-6 Hayashi's quantification theory type Ⅰ analysis ... 20
2-3-7 Brief summary ... 21
CHAPTER 3 METHOD ... 22
3-1 DATA COLLECTION PROCEDURE ... 23
3-1-1 Recruiting ... 23
3-1-2 Probes ... 25
3-1-3 Interview ... 29
3-2 QUESTIONNAIRE ... 33
vi
3-3-1 Correlations building by Hayashi’s quantification theory type Ⅰ analysis ... 35
3-3-2 Pattern finding by Grounded theory ... 36
CHAPTER 4 RESULT ... 38
4-1 AFFINITY DIAGRAM OF NEGATIVE BUS EXPERIENCE ... 38
4-2 HIERARCHICAL DIAGRAM OF PASSENGERS’ EVALUATION ... 40
4-3 CORRELATIONS BETWEEN SERVICE FEATURES AND EMOTIONS ... 43
4-4 CORE PATTERN OF PASSAGE ... 51
4-4-1 Open Coding ... 51
4-4-2 Axis Coding ... 54
4-4-3 Selective Coding ... 60
4-4-4 Brief summary ... 61
CHAPTER5 REVIEW AND DISCUSSION ... 62
5-1 CONTEXT OF APPRAISAL ... 63
5-1-1 The feeling of driver’s bad attitude was resulted from intervening conditions. ... 64
5-1-2 Influence from the other passengers and passengers own value are highly related. ... 65
5-1-3 When passengers distrust the service, they have to control the situation by themselves.. 66
5-1-4 Passengers have prior expectation before they enter the service. ... 68
5-2 EMOTIONAL RESPONSE... 69
5-2-1 Action / interaction strategy ... 69
5-2-2 To link the strategies and context ... 73
5-3 MODEL OF NEGATIVE EMOTIONAL EXPERIENCE ... 75
5-4 DESIGN IMPLICATIONS... 78
CHAPTER6 CONCLUSION ... 81
6-1 CONCLUSIONS ... 81
6-2 REVIEWS ... 82
6-3 VALUE OF RESEARCH ... 83
6-4 RECOMMENDATIONS FOR FUTURE RESEARCH ... 83
REFERENCE ... 84
APPENDIX: ... 89
APPENDIX 1:PROBES ... 90
APPENDIX 2:PERSONAL EVALUATION DIAGRAM ... 91
APPENDIX 3:FREQUENCY TABLE ... 99
APPENDIX 4:QUESTIONNAIRE ... 101
vii
TABLE CONTENT
Table 2-1 differentiating affective states (Frijda, 1994) ... 7
Table 2-2 classification of emotions ... 8
Table 2-3 the influence of emotion ... 11
Table 2-4 the difference between service and product... 13
Table 3-1 requirement setting ... 24
Table 3-2 Personal Involvement Inventory test ... 24
Table 3-3 the result of PII test and personal information ... 25
Table 3-4 the first part of questionnaire (explanatory variables) ... 34
Table 3-5 the second part of questionnaire (criterion variables) ... 34
Table 4-1 emotion clusters ... 43
Table 4-2 result of reproach analysis ... 45
Table 4-3 the result of distress analysis ... 46
Table 4-4 result of afraid analysis ... 47
Table 4-5 result of fatigue analysis ... 48
Table 4-6 result of disappointment analysis ... 49
Table 4-7 the result of open coding ... 52
Table 4-8 the phenomenon found by axis coding ... 54
Table 4-9 the phenomenon of control situation ... 56
Table 4-10 the phenomenon of adjustment ... 58
Table 4-11 the phenomenon of adaption ... 59
viii
FIGURE CONTENT
Figure 2-1 basic model of emotions ... 10
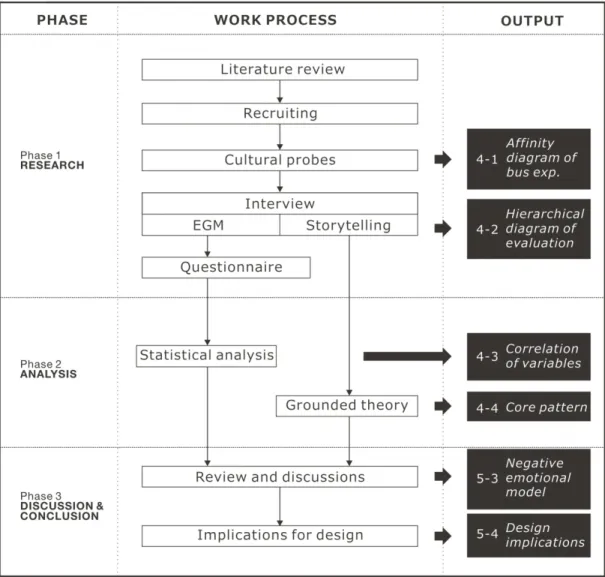
Figure 3-1 the process of this study ... 22
Figure 3-2 probes ... 26
Figure 3-3 Instruction ... 27
Figure 3-4 environmental photos from participants ... 27
Figure 3-5 Event recording ... 27
Figure 3-6 emotional check box ... 29
Figure 3-7 photos of interviews ... 30
Figure 3-8 tools for interview ... 31
Figure 3-9 the structure of EGM diagram ... 32
Figure 3-10 EGM drafts... 32
Figure 3-11 the process of conceptualization ... 36
Figure 3-12 the model of axis coding... 37
Figure 4-1 crucial factors in negative bus experience ... 39
Figure 4-2 unity of ideas ... 40
Figure 4-3 the hierarchical diagram of evaluation ... 42
Figure 4-4 the modified EGM diagram ... 44
Figure 4-5 the Hayashi’s quantification theory type I analysis by EGM diagram.... 50
Figure 4-6 the core pattern of controlling situation ... 60
Figure 5-1 the structure of discussions ... 62
Figure 5-2 the brief relevance between emotion and stimulus from the quantification theory type I analysis ... 63
Figure 5-3 the intervening conditions between driver and passenger ... 65
Figure 5-4 the relationship between passenger’s value and external influence .... 66
Figure 5-5 the passage of controlling situation... 67
Figure 5-6 the relationship between expectation and perception... 68
Figure 5-7 action / interaction strategy ... 69
Figure 5-8 the resource of the model building ... 75
1
Chapter1 Introduction
1-1
Background
The 19th and 20th century was all about industrialization, from cars to washing
machines, the product ruled the roost. Today most economies are becoming
service-based and people live in an information age (live│work, 2008). These services can be both tangible and intangible. They can involve artifacts and other
things including communication, environment and behaviors. The fields of cultural,
social and human interaction can be connected by service design, and it aims to
provide people wonderful experience (Miettinen, Koivisto, 2009). However, in the
last ten years, understanding user experience as well as the relation between design
and emotions has emerged among researchers and designers. The study of emotions is
relevant to human experience, Forlizzi & Battarbee (2004) pointed that emotion is the
center of human experience, an element taking place between user and interaction,
which provides a way to understand and communicate the experience. On the other
hand, emotions also have a strong influence on live experience. They are a key part of
experience, which influence people’s actions, expectations, and future evaluations
(Diener & Lucas, 2000, Battarbee , 2005).
In brief, service design is a system challenge driven by understanding of the human
experience. That is, the development from consuming a product that solving problems
to consuming a great experience that making people feel good. Therefore, emotion is
2
1-2
Motivation
People have many unsatisfactory experiences when they use banks, buses, health
services and insurance companies. These services don’t make people feel happier or
richer. Why are they not designed as well as the products we love to use such as an
Apple iPod or a BMW? (live│work, 2008)
In fact, people are driven by the pursuit for of pleasure and the avoidance of
displeasure. The purpose of design is to provide pleasure and minimize displeasure
(Jordan 2000, Battarbee 2005). However, most of literatures focus on studying
pleasure in order to create a satisfying design, only little literature has been focused
on negative emotion to understand human experience. When it comes to the
emotional influence, it is much easier to keep certain events in mind by the means of
emotional stimulus than events without stimulus. The negative emotion also leaves
memory deep in mind and clear to arouse (Isen, 1993; Brave, 2003; Norman et al.,
2003). Perhaps, it may be easier to capture and observe negative emotions than
positive ones within some experiences. Thus, the bus experience is chosen as a case
study in which negative emotions obviously can be found frequently.
Due to the long existence of the bus transportation system here in Taiwan, it has been
symbolically deemed as the blood vessel, by which big cities find their mobility and
vitality. Despite its convenience, the bus passengers still encounter many problems
and troubles which have been left unsolved. Compared with nice bus service in other
countries, such as Japan, they not only concern the service quality but take care
customers’ feeling. In Taiwan, there are still too many unsatisfactory experiences,
3
thesis focuses on the users' negative emotional experience while taking the bus
service.
1-3
Objectives
This thesis strives to connect the bus service features and qualities to the emotional
responses. The perceptions, the actions and the experiences of the bus passengers
were studied. This thesis includes three objectives:
a. Understanding the core pattern which supports the whole experience.
It is difficult to understand the whole emotional experience because every data seems
to reveal its importance. As a result, the information should be integrated into one
core process which covers and records key elements, such as behavioral descriptions
and interactive sequences. It could be regarded as stages and phases of a passage,
along with an explanation of what makes that passage move forward, halt, or take a
downward turn (Strauss & Corbin, 1990).
b. Constructing a model of negative emotional experience in the bus service. Although realizing the negative emotions is useful for designer to gain background
knowledge, there are still many factors that the designers cannot control. What kind of
negative emotions should be addressed by the designers? How to control those
emotions by design? The main goal is to develop a model that will explain how the
services arouse emotions and how the passengers act. Only when having a deep
understanding of the interactive context, the perception, and passenger’s behavior, a
4
c. Proposing implications to reduce the passengers’ negative emotion in the bus service.
By understanding the negative emotion of user experience, there are two main ways to
infer the implications for design. The first one is to analyze the context between
stimulus and emotions. The second one is to learn the mental decision from
passengers’ action / interaction strategies. Both ways can be seen as the foundations to
propose a bus service and to reduces or eliminates the passengers’ negative emotions.
1-4
Research issue
In view of the preceding research objectives, three major research issues to be
addressed in this thesis:
a. How to effectively apprehend the negative emotions of passengers’ experience from the bus taking?
In considering the method of getting data, the issue may be discussed in order to have
real and rich extraction from passengers. By designing a particular strategies and
considerate way for passengers to follow, even give them enough space to express
themselves. It is important that providing a good experience driven tools applied to
understand the grooming experience of users. Because by using service design
techniques that enable all levels of the service to engage with their users and
understand their experiences it is possible to turn this involvement into real service
improvements.
b. What are the stimulating factors of arousing negative emotions in the bus service?
5
emotion. And not only actual events but also remembered or imaged events have the
potential to arouse emotions. In this thesis, the correlation between emotions and
stimulating factors would be built in order to know what kind of stimulus should be
concerned.
c. How do the bus passengers response their negative emotions?
From the notion of user-inspired design, it indicates that product or service strategy
and design should start with understanding the user involved in. And there are many
research methods that rely on observation of consumers' behavior or the
self-documentary to help designers understand their users. Thus, knowing the mindset
and strategies of users could be a driver to create a new design to fulfill users’ needs.
1-5
Scope
The main subject discussed in this thesis is negative emotions of bus experience.
There are two major concerns. One is passengers’ emotion such as how their negative
emotions aroused by stimulus. The other is passengers’ behaviors such as how they
deal with their negative emotions. Other passengers on the bus, such as driver will not
be taken as the targeted object. Also, the research focuses on the bus service in Taipei.
In addition, though there are many groups who take bus, the office worker group is
chosen as the target for its majority of population. And the process of data collection
and analysis was focus on the negative effects which were aroused by negative
6
1-6
Outline of thesis
This thesis consists of six chapters. The research background, motivation, objectives,
scope, and outline of thesis are introduced in Chapter 1. Relevant studies of user
inspired design, emotion, and service design are reviewed in Chapter 2. The research
plan and method of data collecting are described in Chapter 3. The data collected are
analyzed and the findings are summarized according to the method ground theory in
Chapter 4. Building a model of experience and the issues which contribute to find out
design implications are brought out for discussion in Chapter 5. In the end, the
7
Chapter2 Literature review
This chapter presents the relative studies of this thesis. First, emotion study has been
regarded as highly significant subjects. It can be divided into several aspects to review.
Second, this section presents the emerging discipline of service design has seen
designers developing tools to support the creation of better services. In the last part,
the research methodologies which were customary in human-centred design were
introduced and explained.
2-1
Emotion study
Most work in the field of design and emotion is concerned with the emotional
experience of the user. The following presents that the literature of the differences of
emotion, classification, measures, influence, etc.
2-1-1 Emotion
What is emotion? Although the concept of emotion appears to be generally
understood, it is still difficult to give it a solid definition. Frijda (1994) has pointed
that affective states can be distinguished either by observable characteristics, or by the
conditions. They can be separated into four types of affective states, such as moods,
sentiments, emotions, and emotional traits (Table 2-1).
8
Emotions are intentional because they imply and involve a relation between the
person experiencing and a particular object: one is afraid of something, proud of
something, in love with something and so on (Frijda, 1994). And the stimulus that
elicits an emotion can be an event or some change within us. People are usually able
to identify the object of their emotion (Ekman and Davison, 1994). And they know
with whom they are angry or displeasure. Besides, emotions are acute, it only keep for
relatively short period of time (Frijda, 1994; Carlson, 1997).
2-1-2 Classification
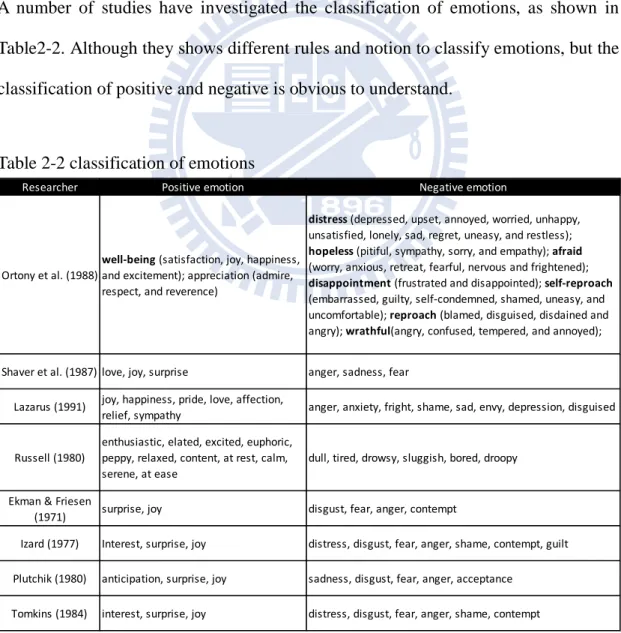
A number of studies have investigated the classification of emotions, as shown in
Table2-2. Although they shows different rules and notion to classify emotions, but the
classification of positive and negative is obvious to understand.
Table 2-2 classification of emotions
Researcher Positive emotion Negative emotion
Ortony et al. (1988)
well-being (satisfaction, joy, happiness,
and excitement); appreciation (admire, respect, and reverence)
distress (depressed, upset, annoyed, worried, unhappy,
unsatisfied, lonely, sad, regret, uneasy, and restless);
hopeless (pitiful, sympathy, sorry, and empathy); afraid
(worry, anxious, retreat, fearful, nervous and frightened);
disappointment (frustrated and disappointed); self-reproach
(embarrassed, guilty, self-condemned, shamed, uneasy, and uncomfortable); reproach (blamed, disguised, disdained and angry); wrathful(angry, confused, tempered, and annoyed); Shaver et al. (1987) love, joy, surprise anger, sadness, fear
Lazarus (1991) joy, happiness, pride, love, affection,
relief, sympathy anger, anxiety, fright, shame, sad, envy, depression, disguised Russell (1980)
enthusiastic, elated, excited, euphoric, peppy, relaxed, content, at rest, calm, serene, at ease
dull, tired, drowsy, sluggish, bored, droopy Ekman & Friesen
(1971) surprise, joy disgust, fear, anger, contempt
Izard (1977) Interest, surprise, joy distress, disgust, fear, anger, shame, contempt, guilt Plutchik (1980) anticipation, surprise, joy sadness, disgust, fear, anger, acceptance
9 2-1-3 Self-report measures
There are many ways to capture and measure emotions. In subjective perception, it is
common to use self-report measures, this is kind of direct way to capture emotions.
By designing questionnaire and have participants check the emotions they have at the
moment. And there are two ways to design the questionnaire: single-item and
multiple-items. The former is to ask people the perception of single emotion, such as
do you feel displeasure. Then score the Likert-type scales with five or seven levels.
The latter is separated into two parts, one is checklist of many emotions, the other is
rating task for participants evaluate level of specific emotional (Larsen & Fredrickson,
1999;Brave & Nass, 2003). And the multiple items measures is chosen in this thesis.
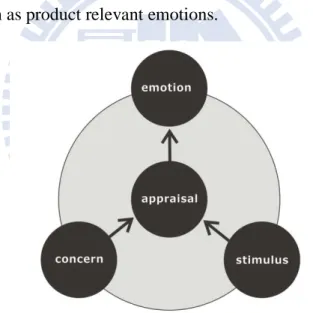
2-1-4 Appraisal theory
In the experience of emotional design, the stimulus and concern, which elicit
emotional responses, should be considered, it is useful for understanding the cause of
emotion forming. As a result, use the concept of appraisal to explain the elicitation
process of emotions. Arnold (1960) has defined emotion is “the felt tendency toward
anything intuitively appraised as good (beneficial) or away from anything intuitively
appraised as bad (harmful).” A basic model of emotions was drawn up based on this
definition, as shown in Figure 2-1. The key variables are identified in the basic model:
appraisal, concern, and stimulus. They are described as follows:
a. Appraisal
According to appraisal researchers, all emotions are preceded and elicited by an
appraisal (Roseman & Smith, 2001). And different individuals who appraisal the same
stimulus in different ways will feel different emotions, because an appraisal is a
10 emotion (Desmet, 2002).
b. Concern
Concerns can be a reference of appraisal process, and the stimulus is determined by
an appraisal concern match or mismatch: stimulus that match human’s concerns are
regarded as good; otherwise, as bad. Moreover, there are many kinds of concerns in
the past literature, such as needs, motives, goals, and values (Scherer, 2001)
c. Stimulus
The stimulus can be a tangible product or in any other form to elicit an emotion
(Frijda, 1986). And according to Desmet (2002), if given the focus on particular kinds
of stimulus, the possible outcome of the appraisal process are limited to a particular
set of emotions, such as product relevant emotions.
Figure 2-1 Basic model of emotions
2-1-5 Emotional influence
The effect of emotions can be divided into two phases to introduce: emotions elicited
by stimulus and emotions as motivators for action. The former is a popular discussion
among researchers in the field of design, because from a commercial point of view, it
can be a useful study to attract people to make decision (Creusen, 1998). The latter
11
understanding the influence of emotion, it could analyze the cause of emotion forming
in a logical way, and it is easier to interpret the notion under human’s behaviors.
According to Norman (2004), emotions affect people in many ways (Table 2-3):
Table 2-3 the influence of emotion
2-1-6 Brief summary
According to the literatures about emotion classification and identification, this thesis
took those as a reference. And self-document method was conducted to capture
people’s emotion and experience because people can identify the object of their
emotion and they know with whom they are angry or displeasure. Besides, the basic
model of emotions, Appraisal theory, can be a key theory that supports our core
pattern.
2-2 Service design
The emerging discipline of service design has seen designers developing tools to
support the creation of better services. Its practitioners take a human-centred approach
that focuses on customer experience and quality of encounter, identifying and
improving the individual “touch-points” where a user experiences a service (Saco &
Goncalves, 2008). Investment in public services has increased dramatically over the
last decade, but today’s services must respond to new challenges including a low
Type Focusing Memory Creativity Efficiency
Positive emotion Open thinking and focus onwhole situation Difficult to remember theevent with stimulus Arouse curiosity and thecreativity gets high Satisfied with work and theefficiency gets high
12
carbon economy, an ageing population and the rising demands of service users.
2-2-1 Introduction
A service is made up of several interactions through a range of touch-points over time.
Service design ensures that all the touch-points work brilliantly to create wonderful
experience. (live︱work, 2008)
Service design:
Service design addresses the functionality and form of services from the perspective
of clients. It aims to ensure that service interfaces are useful, usable, and desirable
from the client’s point of view and effective, efficient, and distinctive from the
supplier’s point of view (Mager, 2008). Design for experiences that reach people
through many different touch-points, and that happen over time. Besides, consuming a
service means consuming an experience, a process that extends over time (Mager,
2009).
Service touch-points:
Service touch-points are tangible, such as place, objects, people or interaction (Moritz,
2005), that made up the total experience of using a service. They can be any form
depend on the service.
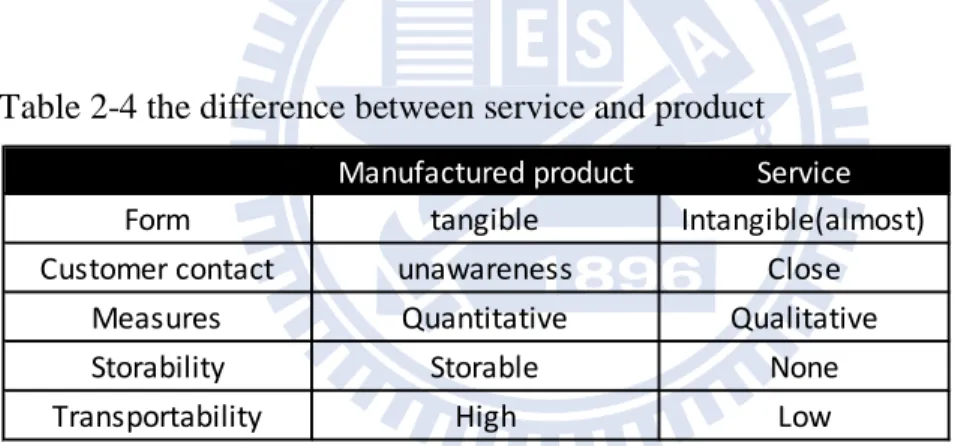
There are five ways in which most services differ from manufactured products
proposed by Design Council (2009):
1. Customer contact - Generally, in manufacturing the customer is probably unaware of how the product came about. In services, production and consumption
tend to occur at the same time.
2. Quality - In manufacturing measures tend to be quantitative, and quality tends to be measured against things like drawings. The measures of quality in a service
13
a wider variability in services and it is more difficult to control the quality of a
service – as it is often down to the individual person supplying it.
3. Storability - Because services tend to be intangible, it is usually impossible to store them. For example, a car in a showroom if not sold today can be sold
tomorrow but an empty seat on an airplane loses its value once the plane has left.
4. Tangibility - One can physically touch a manufactured product but most services are intangible. One cannot touch legal advice or a journey, though one can often
see the results.
5. Transportability - Most services cannot be transported and therefore, exported (though the means of producing these services often can). It is estimated that only
11% of services are exportable although this is fast changing.
Table 2-4 the difference between service and product
2-2-2 Frameworks
There are some basic frameworks for designing service better:
1. Look at your service as a product: Good design is connected to a good strategy.
This is true for services just as much as for products. If service design is to be
used in a substantial and not in a decorative manner it has to be connected to the
business strategies. It is about fundamental questions of positioning and portfolio
management.
Manufactured product Service
Form tangible Intangible(almost) Customer contact unawareness Close
Measures Quantitative Qualitative
Storability Storable None
14
2. Focus on the customer benefit: Rethinking the organization might be part of
service design processes in order to create structures and processes that are
focused on the delivery of benefit to a customer. It is radical change of perspective:
moving from frontstage to backstage is revolutionary for many service providers
even though it seems so natural.
3. Dive into the customers’ world: Often the knowledge about the customer is very
much rooted in the past and frozen in Excel sheets and diagrams. Service design
explores in depth the vivid world of emotions and experiences, and help people to
envision and describe more about their own desire.
4. See the big picture: The service experience might be start long before the
customer gets in contact with provider, and the experience does not end with the
“Goodbye”. Service are embedded in large systems of relationships and
interactions. And they need to take into consideration the changes users go
through throughout the duration of the relationship.
5. Design an experience: The choreography of experience or at least of conditions
that enable certain experiences is a major challenge in the service design process.
Use techniques that have their roots in performing arts; learn from experience and
interaction design in order to “design time”.
6. Create perceivable evidence: Making the invisible visible and not yet existing
perceivable is a contribution of service design. The invisible service needs to be
transformed into perceivable evidence along the touch-points of service
experience.
7. Go for a standing ovation: In many service encounters success depends on
people. The service performance needs to be supported by a designed setting that
serves the needs of the “actors”. This might require a fundamental reflection upon
15
8. Define flexible standards: A 100% standardization as we often find it in
production sites is not applicable to services; the right balance of standardization
and flexibility needs to be defined, considering the type of service that is being
designed.
9. A living product: Services need to be designed for learning and development; an
open membrane towards customers, employees and environment needs to be part
of the service system.
10. Be enthusiastic: The corporate culture has a major impact on the quality of the
delivered service. An attentive observation of existing culture and a support of
cultural change is thus part of the design process (Miettinen & Koivisto, 2009).
2-2-3 Brief summary
In the above section, the difference between product and service was presented, and
many definitions of service keywords were explained for the later research. The
frameworks of service design also can become a crucial reference for discussing
design implications.
2-3 Research methodology
This section presents the research methods were conducted in this thesis. Most of
them were customary in Human-Centred Design.
2-3-1 Personal involvement inventory
There is a simple test to evaluate the involvement index of participants. It is called
Personal Involvement Inventory (PII), and it was created by Zaichkowsky on 1994.
16
inventory that explored by the relationship between product and personal features,
such as value, interest, and intrinsic need. Semantic Difference Method as a tool to
measure goods. And the higher index participants get, the deeper involvement they
have. The original PII test (Zaichkowsky, 1985) has twenty questions, then she
modified the test into ten questions. She tried to use more precise questions to
measure customers’ involvement towards product or service. And the latest PII test
also was used in this thesis.
2-3-2 Affinity diagram
The affinity diagram has become one of the most widely Japanese management and
planning tools. It was developed to discovering meaningful groups of ideas within a
raw list. And it is important to make the grouping process naturally, it means to use
human’s intuition, rather than according to preordained categories in mind. Usually,
an affinity diagram is used to refine a brainstorm into something that makes sense and
can be dealt with more easily. In brief, using the affinity diagram when facts or
thoughts are uncertain and need to be organized, when preexisting ideas or paradigms
need to be overcome, when ideas need to be clarified, and when unity within a team
needs to be created.
The following is the Steps to create an affinity diagram:
1. Rapidly group ideas that seem to belong together. 2. It isn't important to define why they belong together. 3. Clarify any ideas in question.
4. Copy an idea into in more than one affinity set if appropriate. 5. Look for small sets. Should they belong in a larger group? 6. Do large sets need to be broken down more precisely?
17
7. When most of the ideas have been sorted, you can start to enter titles for each affinity set.
The Affinity process is a good way to get people to work on a creative level to address
difficult issues. It may be used in situations that are unknown or unexplored, or in
circumstances that seem confusing or disorganized, such as when people with diverse
experiences form a new area, or when members have incomplete knowledge of the
area of analysis.
2-3-3 Cultural probes
Typical service design methods adopting a human-centered approach include probes,
customer personas and storytelling. And cultural probes are conducted in this thesis.
Cultural probes are a user-centered approach to understanding human phenomena and
explore design opportunities. The point of cultural probes was to create a dialogue
between the designer and the user (Gaver et al., 1999). One of aims was to capture the
stereotyped images of ageing people, as well as to develop sensibility in listening to
other people and understanding the meaning underlying their actions (Gaver, 2001).
They are almost on the basis of user participation by self-documentation. And probes
can be conducted on many kinds of platform, such as on mobile or on-line. It aims to
collect users’ context and perceptions. The most common way to conduct them is
self-documenting diary or self-photography (Mattelmäki, 2006). Hulkko et al. (2004)
also points that the core notion of probes is to capture users’ thoughts on the
environment and actions by means of documentation, reflection, and expression. In
brief, it is kinds of discovering and understanding the service context and the users
participatory design method.
18
1. Inspiration: Probes can support and enrich the designer’s or the team’s inspiration.
2. Information: Probes can collect real information from target users.
3. Participation: Probe can provide the users with opportunities to participation in the
process of research and ideation.
4. Dialogue: Probes can build up an interaction between the users and the designers,
as well as within the design team, in accordance with the user-centered design
principles.
2-3-4 Grounded theory
Grounded theory is a qualitative research approach that was collaboratively developed
by Glaser and Strauss (1967). It is inductively derived from the study of the
phenomenon it represents. Thus, it is discovered, developed, and provisionally
verified through systematic data collection and analysis of data pertaining to that
phenomenon (Strauss & Corbin, 1990). Most important of all, it is focus on logic of
generation, rather than logic of verification. The whole process of grounded theory is
to show how to build a theory. Therefore, it begins with an area of study and what is
relevant to that area is allowed to emerge. Besides, Hammersley (1989) points that it
is the most scientific method in qualitative research.
There are three main phases of coding: open coding, axis coding, and selective coding.
And all codes start from separated to integrated ones.
1. open coding: The process of breaking down, examining, comparing,
conceptualizing, and categorizing data.
2. axis coding: A set of procedures whereby data are put back together in new ways
after open coding, by making connections between categories. This is done by
utilizing a coding paradigm involving conditions, context, action / interactional
19
3. selective coding: The process of selecting the core category, systematically
relating it to other categories, validating those relationships, and filling in
categories that need further refinement and development.
2-3-5 Evaluation grid method
Evaluation grid method (or EGM) is a kind of in-depth interview method, which
paired comparison and interpretive structural modeling for structure identification.
Sanui (1996) improved the repertory grid method (RGM), proposed by Kelly (1955),
into evaluation grid method in two processes. First Step is to compare objects, people
are asked to answer what is good or bad and what they like or dislike about them, it
aims to pick out the potential stimulus that participant may have deeper perception.
Second, through continuous questioning, the meaning and conditions of the answer
are clarified. It is used mainly to capture individual perceptions and compile them into
in a hierarchic structure (Sanui, 1996).
The reason why researchers use this method is that traditional general questionnaires
could not dig out the real thought from users, actual behavior is often far from what
users answer. By conducting EGM, researchers can realize “what values existed in
user’s mind” and “what’s the linking relationship between feeling and practice”.
The following is the process of EGM:
1. Prepare related image cards that can cover the evaluation target.
2. Ask the participant of grouping the cards into two groups: like and dislike.
3. Take those who like out and ask participant of grouping into groups according to
the degree of like.
20
2-3-6 Hayashi's quantification theory type Ⅰ analysis
Quantification theory type Ⅰ is well known as an effective method to deal with the
relationship between criterion variables with quantitative values and explanatory
variables with qualitative ones in our environments. (Tanaka & Wakimoto, 1983)
Especially, it is suitable for many cases in our environment. To use Hayashi’s
quantification theory type Ⅰ, the analyzer arranges explanatory variables to items
and these qualitative values (alternatives) to categories. To calculate a regression on
these items and categories, dummy variables are introduced. When a sample λ corresponds to item j and its category k, dummy variable δ(jk) = 1 , otherwise δ(jk ) = 0 . The weight of each δ( jk ) is calculated by regression. These derived values of weights are used to specify what categories and items have an effect on the criterion
variable.
The general regression model of the Hayashi’s Quantification Theory Type Ⅰ can
be defined as follow: on each Kansei word λ, where j is item number, k is category number.
where j = 1,2….,m (m is the total number of items) and k = 1,2,…, c j (c j is the total
number of categories for item j).
In the above equation, a jk is called partial regression coefficients or category scores
(weights). The major goal of the above equation is to find coefficients a jk in order to
minimize the deviation between estimated values and real values. yλ and xjkλ are called criterion variables and explanatory variables. The estimated values of a jk can
be derived by solving a simultaneous equation composed of the above equations.
21 2-3-7 Brief summary
Even though above research methods are common ways in user-centred design, a
good flow between each method should be put more emphasis. Each method had its
own role in this thesis, from data collection to analysis phase, discussion section. The
advantages of methods were used to link each phase and explored more valuable
findings. The PII test was used to be a reference for recruiting, and the culture probes
were conducted by asking people to document by themselves. Under the notion of
Grounded theory, all data were conceptualized into higher phenomenon. The method
of interview was conducted by the EGM, then through the Hayashi’s quantification
22
Chapter 3 Method
As was mentioned above, this thesis aims to apprehend the negative emotion from
user experience of taking bus. A three-phase study was designed to explore the
evaluation, correlation, and pattern of negative emotion. Figure 3-1 illustrates the
process of whole study.
23
3-1 Data collection procedure
The first step was to recruit participants, and then data were collected by using
cultural probes in which participants recorded during a displeasing event of taking bus.
The interviews were conducted after receiving the data of probes.
3-1-1 Recruiting
The participants for this thesis were selected from the population of office workers
taking buses in Taipei as their commuting vehicle. Snowball sampling was used to
recruit participants. Participants were recruited through posted information on BBS,
and by word of mouth to friends, classmates, and any possible way. Besides, there
were so many people interested in this research, and they also asked many questions
about the method and discussed some embarrassing experiences they ever had. It was
a good start to make people get involved into this research. Table 3-1 lists the
questions and requirements we needed. Besides, this thesis not only searched the
participant who was fit with the requirement, but also conducting a simple test to
evaluate the involvement index. It is called Personal Involvement Inventory (PII)
(Zaichkowsky, 1994). The latest PII test only has ten questions, and there are more
precise questions to measure customers’ involvement towards product or service.
Table 3-2 provides the result of PII test, from 10 to 30 is low involvement; from 31 to
24 Table 3-1 requirement setting
Table 3-2 Personal Involvement Inventory test
The qualified candidates for this research had been selected from participants who
have the following criteria:
1. Qualified candidates have the PII index in the range of medium or high
involvement. (It means from 31 to 70.)
2. For the frequency of taking bus, qualified candidates have to take bus at least 3
times per week.
3. Qualified candidates have to work and take the bus always inside Taipei area. Basic requirements
Gender: Male or Female Career: office worker
Bus experience: over 1 year and take bus to office Area: Taipei, Taiwan
Also ask some questions, such as:
1. Do you like to take bus?
2. What do you do when you take bus? 3. How long you have to spend by traffic? 4. Do you notice other passengers’ behaviors? 5. Did you have any negative experience on b ?
question keyword score & option
Taking bus is important to me. important 1=strongly disagree Taking bus is revevant with my life. relevant 2=disagree
Taking bus appealed to me. appealing 3=slightly disagree I am fascinated with taking bus. fascinating 4=normal
Taking bus is worthless. worthless 5=slightly agree I think I need to taking bus. need 6=agree
I want to know further about taking bus. involving 7=strongly agree Taking bus for me means a lot. means a lot
I am interesting in taking bus. interesting When it comes to taking bus, I am excited. exciting
25
Apart from above three conditions, we had tried to keep gender distribution fair.
There were total 11 participants selected as from Taipei workers. As shown in Table
3-3, five of them were male and the others were female.
Table 3-3 the result of PII test and personal information
3-1-2 Probes
Designing good probes provide users their own space to describe and record the
negative emotional events when they take the bus. Through the probes kit to capture
the negative emotions; however, due to the privacy issue, camera was banned to
record the negative events, therefore handwritten documentary was used. Besides, due
to the need of the environmental data, participants were asked to take some pictures of
their way to company and home.
In this thesis, the methods we used claim that participants’ real thoughts and values
could be abstracted. Under this notion, participants should be well-understood about
the theme of this study. Even though they were heavy bus users, they still have to
became more sensitive about negative emotions aroused by the instruction in the
number gender age working time traffic time title frequency PII test interview
A F 21-25 9:00-18:00 bus 30 mins supervisor 6 / week 42 Y
B F 21-25 8:30-17:30 bus 50 mins / bus
→Mrt→walk 40 engineer 5 / week 52 Y
C M 31-35 9:00-18:00 bus 20mins designer 4 / week 44 Y
D F 26-30 8:00-18:00 Mrt 15mins → bus
3mins Specialist 5 / week 36 N
E F 21-25 9:30-18:30 bus 10-15 mins assistant 5 / week 48 Y
F M 26-30 9:00-18:30 bus 20 mins designer 5 / week 34 N
G F 21-25 8:30-17:30 bus 40-60 mins cad drafter 5 / week 34 N
H M 26-30 8:00-17:00 bus 20-25 engineer 5 / week 41 Y
I M 31-35 8:30-17:30 bus 20 mins sales 5 / week 33 N
J M 26-30 9:00-18:00 bus 15 mins Specialist 5 / week 40 Y
26
probes. As a result, cultural probes were designed for participants to document
without interrupting their original activities. As if the researcher observes around
them, it can create a communication linked between the users and the researchers, the
collected information of which often inspires the design team. And there are four tools
in the probes: (A) instruction and mission, (B) negative events documentation, (C)
negative emotion check box, and (D) reward. (Figure 3-2)
Figure 3-2 probes
a. Instruction and mission
In order to enhance participants’ involvement in their bus experience, the main idea
and aim of probes were introduced to participants. (Figure 3-3) A good introduction
could arouse participants’ passion. As the instruction mentioned that this thesis can be
a basic foundation of co-design, and gave free hand to all participants. Besides, there
was a mission for them to record the background information from house to company
by taking photos. These photos could be the resources for later interview section
27
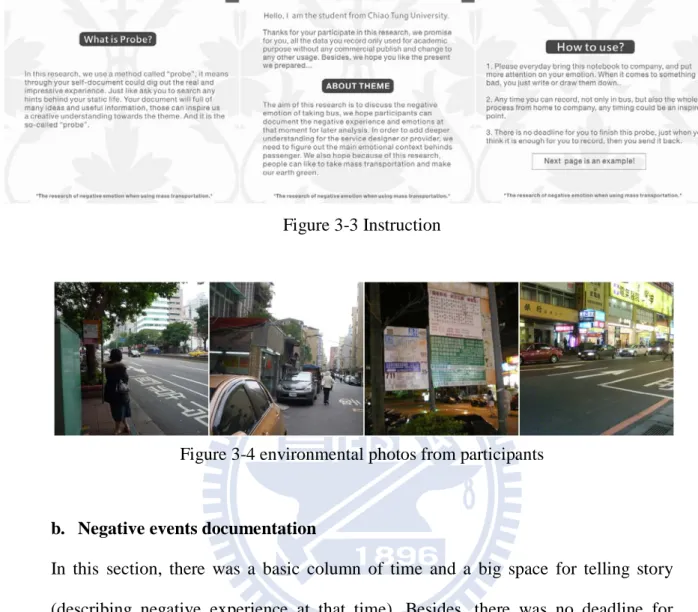
Figure 3-3 Instruction
Figure 3-4 environmental photos from participants
b. Negative events documentation
In this section, there was a basic column of time and a big space for telling story
(describing negative experience at that time). Besides, there was no deadline for
participants. It depended on their documentary conditions, such as shown in Figure
3-5.
28 c. Negative emotion check box
According to the literature review, there are too many kinds of emotions to tell the
differences. Actually, users usually do not know the literal definitions of negative
emotions they have, not to mention what they felt could be complicated emotional
compounds. In general, they just think they are unhappy or uncomfortable. Therefore,
the self-document check box could help people to check their negative emotions and
the measure they can use to describe. That’s why emotional check box was chosen for
the probes (Figure 3-6).
Moreover, the term of common negative emotions should be chosen in order to make
sure participants understand those terms. As a result, many negative emotional
vocabularies were collected from many websites and magazines, which are related to
public service. Finally, forty negative emotional words were selected through the
discussion of focus group. The emotional words we choose are as follows:
angry, hateful, anxious, worried, frustrated, repugnant, ashamed, disdainful, disdainful, helpless, astonished, sad, abnormal, miserable, afraid, uneasy, agitated, doubtful, fury, heartbreak, tired, upset, boring, nervous, distress, disappointed, painful, melancholy, resentful, complicated, perturbed, hysterical, suppressed, gloomy, embarrassed, have no alternative, troublesome, contradictory, unbelievable, and exaggerated.
29
Figure 3-6 emotional check box
After the probes were received, the first step was to code any useful messages from
design probes. At the same time, the number of coding from each probe was counted
to check the unity of ideas and it can be a tool to decide the number of probes we have
to deliver. Then, all codes were printed, from the lower level to create a super-head.
As a result, the whole negative emotional components were sorted by drawing affinity
diagram.
3-1-3 Interview
Negative stories, different emotions, and environmental photos were the resource for
interview. According to the probes participants returned, there were seven participants
(four female, three male, see Table 3-3) had been kept for the interview section.
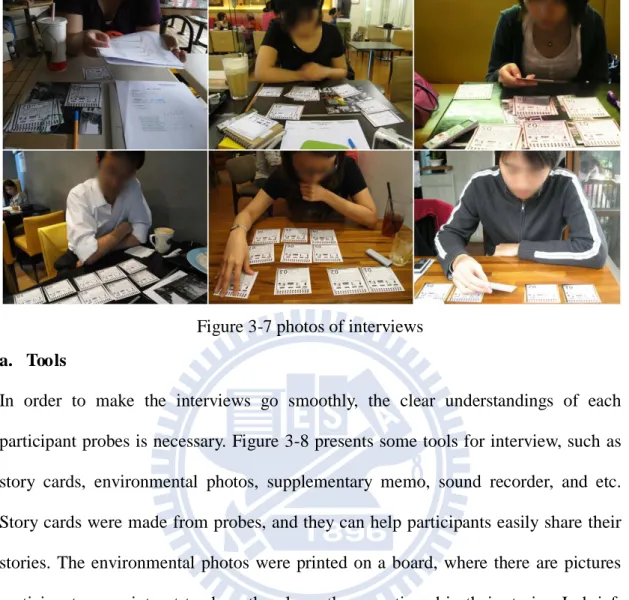
Figure 3-7 shows the photos of interviewers, their forty-minute interviews had been
voice-recorded. There were two works in the interviews, one was by storytelling to
understand the context, and the other was through evaluation grid method (EGM).
Besides, the outline of storytelling was according to the affinity diagram of the whole
experience. However, abstract feeling, original evaluation, and concrete features were
30 was performed.
Figure 3-7 photos of interviews
a. Tools
In order to make the interviews go smoothly, the clear understandings of each
participant probes is necessary. Figure 3-8 presents some tools for interview, such as
story cards, environmental photos, supplementary memo, sound recorder, and etc.
Story cards were made from probes, and they can help participants easily share their
stories. The environmental photos were printed on a board, where there are pictures
participant can point out to show the places they mentioned in their stories. In brief,
they use certain tools, such as pictures, records, inspired with different materials and
storytelling to generate ideas. The aim of make-tools is to collect data from
participants and to make them easily verbalize their experiences. Thus, tools help
31
Figure 3-8 tools for interview
b. Process
In order to understand the perception and sense of value when people face those
negative events, a personal interview method, evaluation grid method, was conducted
to dig out people’s mental value structure. This method also visually expresses the
structure of the later evaluation.
The following is the process of the interview based on evaluation grid method:
Step1. Card sorting
Ask participants to sort story cards into different groups, it could make them think
every story again. And it also had many possibilities to make them speak out their
feelings and perceptions.
Step2. Storytelling
Start to introduce from the most hated group, and listen to their stories carefully,
because there are still many important ideas behind their stories. And they would be
asked to explain their emotions of different moments in one experience.
Step3. Structure building
32
such as the following content, also shown in Figure 3-9:
1. Why did you sort this negative stories together? Because of OO. (middle item) 2. Why don’t you like OO? What do you feel? The sense of XX. (concrete item) 3. Specifically, what’s OO? That’s &&. (abstract item)
Figure 3-9 the structure of EGM diagram
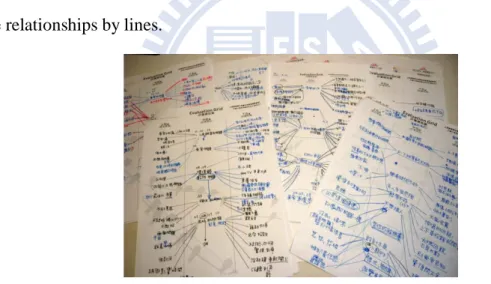
Finally, each EGM diagram was done. Figure 3-10 shows the different mental
mindsets of evaluation and the frequency of each item was calculated and linked all
the relationships by lines.
Figure 3-10 EGM drafts
Step4. Consolidation
Through the frequency comparison, all EGM diagrams were consolidated into one
diagram, in which relationships between each item were shown. In brief, review all
the process, from getting the result of interview to drawing EGM diagram. This
procedure had turned complicated data into a systematic presentation. The Evaluation
Grid Method is not only suitable for abstracting real factors inside the experience, but
33 Step5. Emotions sorting
In the EGM diagram, abstract items still have to be processed into useful materials for
later discussions. Focus group was applied for classifying those emotions into suitable
categories. And the emotional literature was referenced for the process of naming.
3-2
Questionnaire
In order to realize the correlation between specific emotions (abstract item) and
concreted factors (concrete item), questionnaire was designed for the later quantitative
analysis. However, this research was under quantification theory type I analysis for
obtaining the degree of importance and influence of all items. Understand the
relationships between items by questionnaire. Then choose the items listed in the
EGM diagram from interviewers. Take these items to design a new questionnaire; let
experimental subjects select which “concrete features” item that would
affect ”original evaluation” factor for analyzing quantification theory type I.
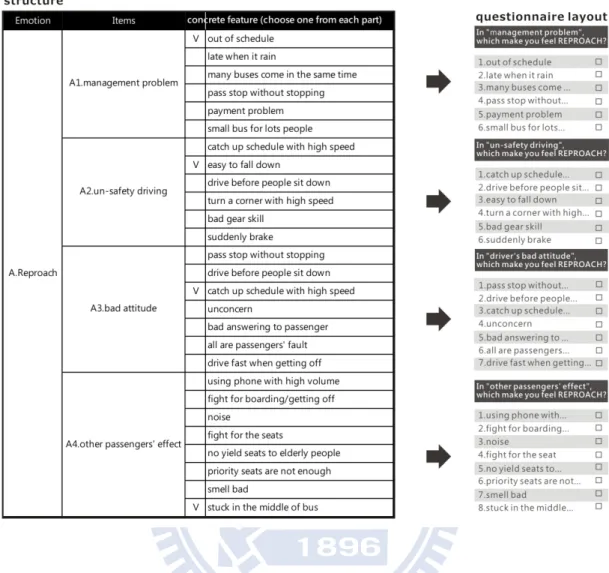
Participants had to fill out the first part of questionnaire which asked the most
representative main feature of each original evaluation that resulted in the abstract
feelings formed, the second part was to measure the abstract feelings by 5 ladder
Likert-type scale, as shown in Table 3-4, 3-5. And the contents of Table 3-4 was
regarded as explanatory variable which had qualitative values, Table 3-5 was regarded
as criterion variable which had quantitative values.
There were two ways to conduct, one was through the on-line questionnaire system,
My3Q, and the other was the field survey. Table 3-4 gives the example of
questionnaire, the concreted features were proposed to people to choose the most
34
Table 3-4 the first part of questionnaire (explanatory variables)
35
3-3
Data Analysis
Both quantitative and qualitative data analyses were processed. The first data analysis
was carried out by means of quantification theory type Ⅰ approach, which was
customary in questionnaire analysis. To address the pattern under negative emotions,
the Grounded Theory was used.
3-3-1 Correlations building by Hayashi’s quantification theory type Ⅰ analysis
From the questionnaire made by EGM, the relationship between linking data were
calculated in according to the Quantification Theory Type Ⅰ. There were two kinds
of data were collected, the first part of questionnaire was the question of
representative concrete features (see Table 3-4) and the second part was the
Likert-type scale to measure the emotional perception of negative bus experience (see
Table 3-5). Then, the data was analyzed by quantification theory type I, the data
collected from first part was regarded as the explanatory variable, and the data
collected from second part was regarded as criterion variable.
The qualitative data from first part of questionnaire were transferred into quantitative
data, such as “1” means the first feature was checked, “2” means the second one was
check, and so on. For instance, the Table3-4 can be transferred into numbers, 1, 2, 3,
and 8. And the answer for second part was directly recorded by score 1 to 5, from
very different to very similar.
Quantitative type Ⅰ analysis was applied for many times for each abstract feeling.
36
result, the precise correlations of weight were performed in the end.
3-3-2 Pattern finding by Grounded theory
According to the data collected by interview and probes, everything was regarded as
our data, and all of them were coded into different categories. Moreover, three coding
methods of grounded theory were conducted, and the core pattern of negative
emotions was delivered in the end.
a. Open coding
During the first of these, open coding, the Figure 3-11 presents the process of
conceptualization, such as searching categories and clustering these categories into
super-categories with abstract labels. A large number of complex data were
conceptualized into abstract phenomenon. Moreover, the properties and dimensions of
phenomenon were discovered from data, it gave authors an open-minded to study.
Figure 3-11 the process of conceptualization
b. axis coding
During the second coding process, axis coding, patterns and relationships within and
between categories were found, such as linking conditions, context, strategies of
37
clustered together again. But the aim of this phase is not to establish an entire theory
structure but to develop the big categories. In addition, although both of open coding
and axis coding were at different phases, in fact, it usually went back to check again
and again. For example, the categories collected by the open coding can be linked into
a consequence by their causal relationships.
Figure 3-12 the model of axis coding
c. Selective coding
During the third coding process, axis coding was linked to each category, and
improved the relationship between each other. The more completed process would be
filled in those developing categories. Compared with axis coding, in this phase
consolidating all data in a more abstractive level was the main notion. And in order to
develop a clear and core diagram of pattern, it could be found by the following steps:
(A) described the context of each phenomenon, (B) linked the core categories with
minor categories, (C) proved all relationships, (D) filled in categories, and above steps
were not fixed to do. For example, the main phenomenon done by the phase of axis
coding can be organized by their importance, and the core pattern can be discovered
38
Chapter 4 Result
The gains of the first phase include all codes sorted by affinity diagram and users’
hierarchical diagram of evaluation. At second phase, the findings include the
correlation between emotions and concrete factors, and the core pattern of
phenomenon. The last phase, a model of negative emotion was delivered in next
chapter. There are four results of research in this chapter, affinity diagram of codes,
hierarchical diagram of evaluation, correlations between service feature and emotion,
and core pattern of negative emotion forming.
4-1
Affinity diagram of negative bus experience
All codes were printed out, from the lower level to create a super-head again and
again by the method of affinity diagram. As a result, Figure 4-1 illustrates the whole
components of experience by drawing affinity diagram.
See Figure 4-1, from the highest level to lowest level, level 5 and 4 indicates the
crucial factors in negative bus experience were composed by three factors, included
environment, behavior, and emotions. And the level 3 shows the intervening factors
that were the outlines used in the interview, for instance, participants were asked to
answer the interaction with the other people, the reaction they had, what was the
stimulus resource, etc,. Besides, level 2 and 1 presents the phenomenon was found by
the probes, the lower level could become the resource for the analysis of grounded
theory, such as the phase of open coding. Thus, this diagram was kind of structure of
39
40
On extraction of ideas, it was based on eleven probes. Because the extraction process
tended to decreasing, it meant the data we collected was consistent, perhaps getting
more data from new participants was not necessary. And Figure 4-2 presents the
decreasing of ideas:
Figure 4-2 decreasing of ideas
4-2
Hierarchical diagram of passengers’ evaluation
Through the frequency comparison, all EGM diagrams were consolidated into one
diagram, therefore the whole relationships between each item were performed. Figure
4-3 indicates the hierarchical diagram of evaluation by EGM from 7 participants.
Figure 4-3 indicates that the original evaluation items are “management problem”,
“un-safety driving”, “driver’s bad attitude”, “other passengers’ effect”, and “hardware
poorly maintained”. And the left side of original evaluation items is abstract items that
represent the meaning of original evaluation items for participants. The right side of
original evaluation items is concrete items that mean the more concrete feature from
original evaluation items. The lines between each item mean the highly correlations.
Besides, the numbers by the side of abstract and concrete items show the frequency of
the same answer was proposed by participants.