1
台灣聚落型態的碎形研究
Fractal formation of settlement forms in Taiwan
蔡博文
*李介中
**Bor-Wen Tsai Chieh-Chung Lee
摘 要
碎形幾何 (fractal geometry) 近年被廣泛運用於都市、生態、GIS 的研究上,有些研究運用於 地物形狀(shape)的分析,有的運用於地物的分佈 (distribution) 探究,本研究採盒計法 (box- counting method) 分析台灣近百年的聚落分佈型態及其變遷;同時進行與人口密度、聚落面積的 相關分析,分析結果並與 Shen (2002) 的美國 20 個主要都市的研究結果進行比較。 研究結果顯示:1) 碎形維度值 D 介於 1 與 2 之間,顯示台灣地區的聚落型態合於碎形幾何 的特性;2) 北、南、東區域的聚落分佈型態與富田方郎 (1934) 的研究吻合,即北部以散村為主、 南部與東部多集村;3) 台灣的聚落型態與 Shen (2002) 研究的美國 20 個主要都市的型態非常相 似,與人口及聚落面積的關係也相當一致。 關鍵字:碎形幾何、聚落型態、地理資訊系統
Abstract
Fractal geometry has recently caught great attention in urban, ecology, and GIS research. This paper employs box-counting method to measure the settlement forms of twenty jurisdictions in Taiwan. The computed fractal dimensions are then linked to population density and ratio of urban area to total land area for each jurisdiction. The results are compared to Shen’s study (2002) to investigate the difference between the development of settlements in the U.S. and that in Taiwan. The conclusions are: 1) the fractal measures satisfies the inequality of 1<D<2 and can be regarded as proof of urban fractal that has been studied by several researchers, 2) the computed fractal measures coincides with the pattern of the spatial distribution of various settlements, that is, scattered in northern Taiwan, compact in the southern and the eastern regions, and 3) similar characteristics exist between settlements in Taiwan and cities in
*國立臺灣大學地理環境資源學系助理教授
Assistant professor, Department of Geography, National Taiwan University. **國立臺灣大學地理環境資源研究所碩士班研究生
Graduate student, Institute of Geography, National Taiwan University.
the US in terms of their spatial forms and population and urban area parameters.
Keywords: fractal, settlement form, GIS
Introduction
For long time, urban models are based on the assumption that a city is a simple system, with emphasis on econometric estimation of individual choice behavior (Batty and Longley, 1986). During the past thirty years, urban models have been modified to conceive cities as complex systems and treat cities as organics with new approaches evolved from the irregular and chaotic aspect of urban patterns. Among these new approaches, fractal geometry evoked much attention. Fractals represent many kinds of patterns, including density, diversity, dendritic stream networks, geometrical shapes, mountainous terrain, and size distributions of island (Mandelbrot, 1982). The approach has the potentials of providing a new way to understand and analyze the nature of urban systems. This paper employs box-counting method to measure settlement forms of twenty jurisdictions in Taiwan. It is expected that settlement forms in Taiwan bear similar characteristics of urban fractals as compare with most cities in the world. The computed fractal measures are then used to examine spatial forms of different types of settlements developed in different regions of Taiwan. Finally, the fractal dimensions are linked to population density and urban areas. The relationships between fractal measures and population and urban area parameters are ascertained and compared to US cities that have been analyzed by Shen (2002).
What is fractal?
Euclidean geometry has dominated our perception of spatial structure for long time. But Euclidean measures are not suitable for describing complex structures (Frankhauser,
2000). Fractals are conceptual objects showing structures at all spatial scales, with a scale-dependent self-similarity (Mandelbrot, 1982). In Euclidean space, increasingly accurate measurements based on successive scale reductions results in series converging to the true extent of an object. By contrast, in fractals the same procedure generates infinite series (Frankhauser, 2000). This relationship represents the property of fractals, called self-similarity. Methods have been developed to study fractal models in various applications. The perimeter versus area relationship model by Li (2000) is used to show patch shape varies with patch size. He also inferred that human disturbances predominate at small scales making for smoother geometry, while natural processes such as geology, soil types, etc, continue to predominate at larger scales. Structure walk method (Berube and Jebrak, 1999) involves walking around the perimeter of an object with a pair of compasses of a finite stride length. The perimeter of the outline is estimated by the number of steps needed to span the outline multiplied by the stride length. Changing the scale of observation will produce another estimate of perimeter. These methods have been widely used in ecology and urban research. Box-counting is one of the first methods to be developed for computerized fractal analysis (Berube and Jebrak, 1999). The method is to place a grid of finite box sizes on an outline or an object and count intersections between the boundary/object and the grid. Varying the box sizes in the grid produces a different number of intersections. Box-counting method can be used to compute patch shape as well as patch structure (spatial forms). Li (2000) addressed a similar concept, called information fractals, to measure spatial structure of point objects. It takes into account the relative probability of the
patch types which cover the landscape. Frankhauser (2000) used radial analysis to measure fractals, concluding that fractal analysis allows the emergence of spatial organization to be shown in the course of urban morphogenesis. Cheng, et al. (1999) adopted a three-dimensional box-counting method to compute self-similarity dimension in a landscape study based on the digital terrain model of Taiwan Island. They found that the relief of the regions with elevation over 1000 meters is similar while the regions with elevation below 1000 meters show great variety due to great spatial variation of erosion factors.
In summary, research has shown the usefulness of fractal analysis which can be used to measure the shape of a spatial object, analyze the distribution pattern of spatial objects, and detect the hierarchical organization of spatial objects. In consequence, fractal analysis has been widely used in delineating landscape characteristics.
Fractal applications in settlement
research
It is assumed that planned cities often show simple forms like squares or circles and grid-like street patterns. More recently, urban planning deplored irregular and chaotic aspects of urban patterns and the emergence of these patterns is not the result of planning but of a highly complex process of social-economic interaction (Frankhauser, 2000). Many researchers have thought of cities to be organic and thereby interpreted the formation of patterns as a process of self-organization. After 70’s, urban models conceived cities as complex systems and started to involve fractals in models. Batty and Xie (1996) argued that the geometry of urban residential development is fractal. Batty and Longley (1986) showed that a large city
such as London could be simulated by fractals. Following the London simulation work, they measured fractal dimension of curves defining the shapes of the urban area of Cardiff in 1886, 1901, and 1922 and tried to infer the changes in the process of urban growth in time and space. Take a step further, Batty and Longley (1988) assessed the irregularity of land uses and land parcels based on the concept of fractal dimension and tested it using land use data for the towns of Swindon and Wilshire in England. Shen (2002) computed fractal dimensions of 20 large US cities and regressed them to urban population and urbanized areas with log-linear functions. The urban form and population growth of Baltimore were also examined for the period 1792–1992 and linked to fractal dimensions. Lin (1991) used fractals to measure urban shape and raised the “semi-fractal” issue. He considered urban landscape bears the characteristics of finite recurrence and unevenness. Thus, urban landscape is fractal in smaller scale and Euclidean in larger scale. The number of recurrence is different among different spatial objects. Den and Lin (2000) employed fractal to delineate urban shape and found that the edge of an urban will tend to be uniform when it is highly urbanized. Lin (1998) examined self-organized criticality of urban land use by using Richardson Plots. She found that the whole urban complex system evolves toward self-organized criticality. This implies that urban land development is self-motivated.
In summary, fractal has widely used in settlement research. However, most research used fractal to measure urban shape instead of urban structure (distribution) except Li (2000) and Shen (2002).
Fractal measures of Taiwan’s
settlements
Taiwan is an island of approximately 36,000 square kilometers in area. There are 23 jurisdictions in national level consisting of 2 metropolitans, 5 cities and 16 prefectures. Each jurisdiction has its own history of development since Dutch landed in 1624. In consequence, settlements may have different forms in different jurisdictions. According to the Japanese scholar (Tomita, Yoshiro, 1934), there are two kinds of settlements in Taiwan. People in southern Taiwan tend to live in compact communities for the purpose of water supply, safety, and public ownership of the land, while those in the north are prone to live in scattered villages due to hilly landscape. The eastern region is isolated by the great central mountain ranges with aborigines being the major ethnic group especially in Huilan and Taitung prefectures. The development of settlement in eastern Taiwan tends to be in compact form due to mountainous landscape as well (Tomita, 1934).
In Shen’s study, the values of planar urban fractal dimension are between 1.7014 for the largest city, New York City, and 1.2778 for the smallest city, Omaha. Longley and Messev (2001) also computed fractal dimensions for major cities in the world by using remote sensing data. The resulting fractal values ranges from 1.00 to 1.93.This study examines fractal dimensions for different jurisdictions in Taiwan with the results used to compare urban form of Taiwan with major cities in United States and in the world. The results are also used to clarify that different settlement forms exist in different regions of Taiwan. The values of fractal dimensions are expected to be high in the northern region, low in the eastern and the southern region in between.
Shen (2002) linked fractal dimensions to urban areas and urban population by use of log-linear function and good fitness resulted. This study also examines the relations
between urban forms and urban areas and urban population so as to investigate if there exists difference between settlements in United States and in Taiwan in terms of their spatial forms.
Methodology
The study area
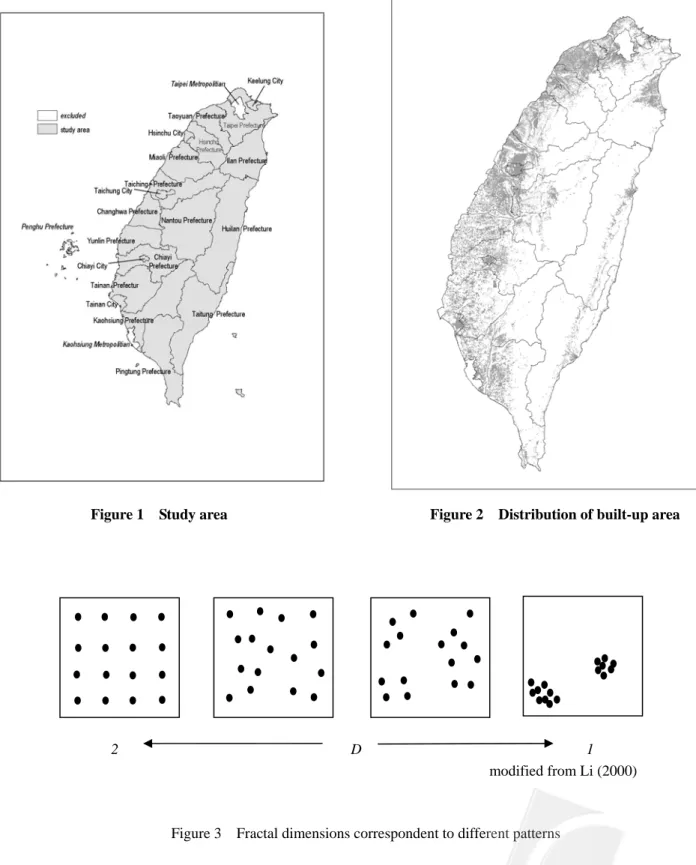
The Taipei and Kaohsiung metropolitans are excluded from this study due to unavailability of land use data. Penghu Prefecture is excluded too because it consists of many small islands located in Taiwan Strait. In consequence, 15 prefectures and 5 cities are analyzed in this study ( Figure 1).
Data
The most elementary feature of settlement forms is the spatial distribution of built-up areas (Frankhauser, 2000). In consequence, this study analyzes settlement forms based on built-up areas. Built-up areas are extracted from land use database constructed in 1994 ( Figure 2). This database was produced entirely by field survey under the national land use survey program. Cadastre map was used as base map for field work. Data collected in the field was delineated on the cadastre map and then transferred to 1:5000 orthophoto base map which is one of the officially published topographic maps series in Taiwan. These orthphoto base maps were digitized by employing GIS method. The original classification scheme hierarchically comprises 10 major types and 93 minor types.
After reclassification of the original data, spatial units are defined by grids of different cell sizes generated by GIS software package. The smallest cell size is set at 50 meters in terms of pre-fractal consideration for the general size of a city block in Taiwan. The grid size is increased gradually
until the maximum extent that covers the whole jurisdiction.
Population data are extracted from the Statistical Yearbook of Taiwan Province, 1994. The Statistical Yearbook is published by a government agency on a regular
basis. Since jurisdictions bear varies in size, normalization is required. It is achieved by computing the density for each jurisdiction. For each jurisdiction, urban area is computed automatically by GIS software, and then normalized by dividing urban area by the total area of the jurisdiction.
Figure 1 Study area Figure 2 Distribution of built-up area
Figure 3 Fractal dimensions correspondent to different patterns
2 D 1
Method
The box-counting method is employed in this study. The fractal dimension is given by:
) 1 log( log lim 0 ε ε ε N D → = (1) where D : fractal dimension length cell : areas up -built all cover that cells of number : ε ε N
The number of cells that cover at least one occupied built-up area is counted for each jurisdiction. When the grid size is incrementally varied, the corresponding number of occupied grid cells is counted. The relation between the number of occupied cells
N
ε
and the corresponding grid sizeε
is obtained based on equation (1).Figure 3 shows different fractal dimensions for different distribution patterns. It provides us an index to measure spatial forms of settlements in every jurisdiction.
The relations between urban forms and urban areas and urban population are analyzed by the regression analyses: 2 2 1 1
b
U
a
D
b
P
a
D
+
=
+
=
(2) where D: fractal dimension area on jurisdicti population density population : = P area on jurisdicti area up built area urban of ratio the : = − U a1, a2: coefficients (slopes) b1, b2: constants (intercepts)The fractal values are computed by a self developed AML (Arc Macro Language) program implemented in the commercial available GIS software-Arc/Info.
Results and Discussion
Table 1 shows fractal dimensions (D) for the 20 jurisdictions and for the three regions. The D values satisfies the inequality 1< D < 2 of Shen and Longley and Mesevs’ observations. We can see Taichung City has the largest D value of 1.76, while Taitung Prefecture has the smallest D value of 1.18. Comparison of the mean values of
D for the northern and southern regions indicates the
disparity of settlement forms which are scattered in the north and compacted in the south. As expected, the most compact settlements are in the eastern region with a mean
D of 1.28. This result confirms the Japanese scholar Tomita,
Yoshiro’s observation of urban development in Taiwan although the conclusion drawn by him is narrative and less precise. However, both results are coincident to some extent. Another implication indicates that the development of settlement in Taiwan follows similar spatial pattern over past thirty years in terms of regional perspectives.
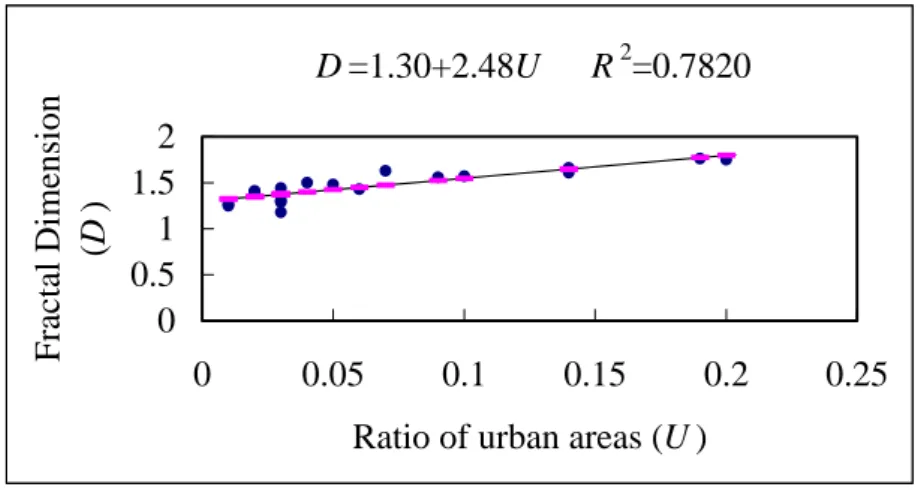
The fractal values, ratios of urban areas and population densities for the 20 jurisdictions are listed in Table 2. The best fit of regression functions are displayed in Figure 4 and 5. The coefficient of determination R2is 0.7639 for population density and 0.7820 for ratio of urban area. They appear to be reasonably good estimates. Compare to Shen’s results for 20 US cities show that R2 are 0.6404 and 0.8761 for population density and urban area respectively. Settlements in Taiwan show stronger relations with population parameter than cities in United States. But cities in United States show slightly stronger relations with urban area parameter than settlements in Taiwan. They imply that urban spatial structure is affected more by population than urban area in Taiwan. In general, cities in both countries have very similar characteristics in terms of the relations between their spatial forms and population and urban area.
Table 1 Fractal dimensions for jurisdictions and regions
Northern Region Southern Region Eastern Region County Name
D
County NameD
County NameD
Keelung City 1.56 Nantou Prefecture 1.27 Ilan Prefecture 1.41 Taipei Prefecture 1.48 Yunlin Prefecture 1.43 Huilan Prefecture 1.25 Taoyuan Prefecture 1.63 Tainan City 1.66 Taitung Prefecture 1.18 Hsinchu Prefecture 1.39 Chiayi City 1.75 Hsinchu City 1.61 Chiayi Prefecture 1.29 Miaoli Prefecture 1.36 Tainan Prefecture 1.40 Taichung City 1.76 Kaohsiung Prefecture 1.44 Taiching Prefecture 1.50 Pingtung Prefecture 1.31 Changhwa Prefecture 1.57Mean 1.54 Mean 1.44 Mean 1.28
Table 2 Fractal dimensions, ratio of urban areas and populations density
County Name D Ratio of Urban Area (U) Population Density (P) County Name D Ratio of Urban Area (R) Population Density (P) Keelung City 1.56 0.09 2838.06 Yunlin Prefecture 1.43 0.06 668.58 Taipei Prefecture 1.48 0.05 1592.36 Tainan City 1.66 0.14 3793.91 Taoyuan Prefecture 1.63 0.07 1206.50 Chiayi City 1.75 0.20 4403.89 Hsinchu Prefecture 1.39 0.02 285.7 Chiayi Prefecture 1.29 0.03 265.75 Hsinchu City 1.61 0.14 3178.60 Tainan Prefecture 1.40 0.02 523.06 Miaoli Prefecture 1.36 0.03 309.18 Kaohsiung Prefecture 1.44 0.03 423.67 Taichung City 1.76 0.19 5192.96 Pingtung Prefecture 1.31 0.03 326.74 Taiching Prefecture 1.50 0.04 670.92 Ilan Prefecture 1.41 0.02 215.10 Changhwa Prefecture 1.57 0.10 1195.68 Huilan prefecture 1.25 0.01 77.65 Nantou Prefecture 1.27 0.01 133.62 Taitung Prefecture 1.18 0.03 72.54
Figure 4 Fractal dimension as a linear function of the ratio of urban area
Figure 5 Fractal dimension as a linear function of population density
The population regression model can be differentiated into two parts- high and low population density. The high population density part includes Keelung, Taipei, Taichung, Tainan and Chiayi cities which are highly urbanized settlements. It fits much better than the low population density part. It indicates that the spatial pattern can be varied (aggregated clumped or regular scattered) when population density is low and tend to be a uniform pattern with regularly scatter distribution when population density
is high. Similar instance shows on the urban area model. It can be inferred that settlement form will tend to be regularly scattered distributed in a high urbanized region.
Conclusions
As Sue (1998) indicated that urban modeling has shifted from conceiving cities based upon predominantly physical metaphors as machines to conceptualize cities
D =1.34+0.0000905P R
2=0.7639
0
0.5
1
1.5
2
-2000
0
2000
4000
6000
Population density (P )
Fractal Dimension
(D
)
D =1.30+2.48U R
2=0.7820
0
0.5
1
1.5
2
0
0.05
0.1
0.15
0.2
0.25
Ratio of urban areas (U )
Fractal Dimension
(D
using a biophysical metaphor as organisms. It is appropriate to consider the settlements as fractal and measure their spatial forms by fractal geometry. This study confirms that settlements in Taiwan are fractal in nature as most cities in the world that have been observed by Batty and Longley (1986), Batty and Xie (1996), Shen (2002) and so on. The
D values for 20 jurisdictions are between 1.76 and 1.18
compare to 1.70 and 1.28 for US 20 major cities. They bear very similar characteristics in terms of fractal perspective. The distribution of D values for 20 jurisdictions also confirms Japanese scholar Tomita, Yoshiro’s (1934) observation of the settlement development in Taiwan, that is, scatter form in northern Taiwan and compacted form in southern and eastern Taiwan. Finally, the linkage between fractal measures and population density and ratio of urban area is estimated by regression analysis. In general, it indicates good-fits with R2 equals to 0.7639 for population density and 0.7820 for ratio of urban area respectively. This result is consistent with Shen’s (2002) observation for US cities.
In summary, fractal dimension can be used as a space-filling measure and can be thought as an indicator of the complexity or dispersion of urban form. The results of this study are consistent with the results of previous research.
References
Batty, M. and Longley, P. A. (1986) The fractal simulation of urban structure, Environment and Planning A, 18:1143-1179.
Batty, M. and Longley, P. A. (1988) The morphology of urban land use, Environment and Planning B, 15:461-488.
Batty, M. and Xie, Y. (1996) Preliminary evidence for a
theory of the fractal city, Environment and Planning A, 28:1745-1762.
Berube, D. and Jebrak, M. (1999) High precision boundary fractal analysis for shape characterization, Computers
& Geosciences, 25:1059-1071.
Cheng, Y. C., Lee, P. J. and Lee, T. Y. (1999) Self-similarity dimensions of the Taiwan Island landscape,
Computers & Geoscience, 25:1043-1050.
Frankhauser, P. (2000) GIS and the fractal formalization of urban patterns: toward a new paradigm for spatial analysis. In: Fotheringham, A. S. and Wegener, M. (eds.), Spatial Models and GIS: New Potential and
New Models, London: Taylor & Francis, 121-142.
Li, B. L. (2000) Fractal geometry applications in description and analysis of patch patterns and patch dynamics, Ecological Modelling, 132:33-50.
Longley, P. A. and Mesev, V. (2001) Measuring urban morphology using remotely-sensed imagery. In: Donnay, J. P., Barnsley, M. J. and Longley, P. A. (eds.)
Remote Sensing and Urban Analysis, London: Taylor
& Francis, 175-198.
Mandelbrot, B. B. (1982) The Fractal Geometry of Nature, San Franciso: Freeman.
Shen, G. (2002) Fractal dimension and fractal growth of urbanized areas, International Journal of
Geographical Information Science, 16(5): 419-437.
Sue, D. Z. (1998) GIS-based urban modelling: practices, problems, and prospects, International Journal of
Geographical Information Science, 12(7):651-671.
Tomita, Y. (1934) Settlement Research in Taiwan, Taipei: Taiwan News. (In Japanese)
Lin, F. T. (1991) A semi-fractal indicator for spatial complexity measurement, Journal of Building and
Planning, 6:9-17。(in Chinese)
Land Use Patterns Based on Semi-fractal Spatial Mixture Indicators-Application of the Diffusion Limited Aggregation Model, Master thesis, National
Chung Hsing University. (in Chinese)
Deng, D. P. and Lin, Y. P. (2000) Exploration of fractal dimension of built-up patterns in Central Taiwan,
People and Land, 209:55-61. (in Chinese)
93 年 08 月 06 收稿 93 年 08 月 23 修正 94 年 04 月 20 接受