TheDifference in Medical Utilization and Associated Factors between Children and AdolescentsWith and Without Autism Spectrum Disorders
Ching-MienWua,b, Pei-Tseng Kungc, Chia-Ing Lid,Wen-Chen Tsaia,*
a. Department of Healthcare Administration, China Medical University, Taichung, Taiwan,
R.O.C.
b. Department of Accounting, ChinaMedical University Hospital, Taichung, Taiwan,R.O.C. c. Department of Healthcare Administration, Asia University, Taichung, Taiwan, R.O.C. d. Department of Medical Research, ChinaMedical University Hospital, Taichung,
Taiwan,R.O.C.
* Corresponding author: Professor Wen-Chen Tsai, Dr.PH Tel: + 886-422073070 Fax: +886-422028895
e-mail:wtsai@mail.cmu.edu.tw
Abstract
This study determined differences in health care utilization and health care expenditures
between children with and without autism spectrum disorder (ASD) and examined possible
reasons for these differences. A retrospective longitudinal study of children agedyounger than
18 years both with and without ASD was conducted using the 2008 database of the Ministry
of the Interior registry of the disabled persons in tandem with the National Health Insurance
Research Database. Propensity score matching for the covariates of age, sex, and parental
monthly salary was used to match children at a ratio of 1:3 for observing health care
utilization among children with and without ASD from 2008 to 2011. Generalized estimating
equation analysis was performed to determine factors that affect health care utilization, such
as physician visits, emergency room (ER) visits, hospitalizations, and health care
expenditures. After matching was completed, the sample size comprised 3280 children with
ASD and 9840 children without ASD. Among the children in the sample, most were boys
(86.68%) between the ages of 6–11 years,and the average age of both samples was 9.8 years.
Afterrelevant factors were controlled for, the children with ASDyielded an average of 14.2
more annual physician visits and were more likely to visit the ER (OR = 1.12, P< .05) or be
hospitalized (OR = 1.48; P< .05) compared with the children without ASD. Compared with
expenditures (NT$26 580 more), higher ER visit expenditures (NT$50 more), higher
hospitalization expenditures (NT$5830 more), and NT$32 460 more total health care
expenditures (all P< .05). Significant predictors of health care expenditures among the
children with ASD were age, parental monthly salary, and severity of comorbidity. The most
common reasons for physician visits or hospitalizations among the children with ASD were
psychiatric illnesses, respiratory illnesses, and digestive illnesses. The children without ASD
most commonly experienced respiratory, digestive, and nervous system or sense organ
illnesses.Health care utilization among children with ASD is higher than that among children
without ASD. The results of this study can serve as a reference for governmental agencies
enacting relevant health care policies.
Keywords: autism spectrum disorder (ASD); children and adolescents; health care utilization; health care expenditures
第一章 Introduction
From 2000 to 2012, the number of Taiwanese people with autism spectrum disorder
(ASD) increased by nearly 12000. The percentage of people with ASD among all people with
disabilities increased annually from 0.29% in 2000 to 1.15% in 2012,and thus,ASD is
thesecond most prevalent disability . Most people with ASD(80.62%) are children and
adolescents agedyounger than 18 years . The ratio of unmetspecific health care servicesis
higher among children and adolescents with ASD than among those with other disabilities .
Thus, the health and medical problems experienced by children and adolescents with ASD
should be addressed.
Previous research has shown that the health problems and health care utilization of
children with ASD differ from those of other children. The number of children with
ASDexhibiting limited physical functioning (including crawling, walking, and running) is 12
times that of other children . A health survey of American children aged younger than 18
years revealed that children with ASD experienced more physical and mental health
problems, including respiratory disorders and food or skin allergies, and were 9 times more
likely than other children to be depressed or anxious . Both physician and emergency room
of children with ASD in Taiwan has exhibited a significant increasing trend in recent
decades,and because of inherent inequalities in health care, they are easily overlooked by
governmental health policies. The Taiwan National Health Insurance (NHI) program was
implemented over20 years ago, and although the national coverage rate exceeds 99.89%, few
studies on the health care utilization of children with ASD have been conducted.
Health care utilization is a form of health behavior,and research into the factors affecting
health care utilization has shown that factors other than personal health condition must be
considered. Andersen’s Behavioral Model is a comprehensiveframework of the interactions
and dynamic relationships between health behaviors and the factors affecting those behaviors
and is widely used in scientific research on health behaviors . In other words,
Andersen’sBehavioral Modelcategorizes factors influencing health care utilization as
predisposing characteristics, enabling characteristics, and need characteristics. Predisposing
characteristics are personal traits that evoke the tendencyto use health care,enabling
characteristics refer to the ability to use health care, and need characteristics refer to health
care utilization behaviors after a person perceivesthat medical treatment is necessary .
This study applied Andersen’s Behavioral Model as a basis for examining the health care
utilization behaviors of children with ASD and for analyzing the possible factors that
influence these behaviors. The results can serve as a reference for governmental agencies to
第二章
Methods Study Subjects and Source of DataThe source of data for this retrospective study was the 2008 database of the Ministry of
the Interiorregistry of the disabled persons and the NHI database of the National Health
Research Institutes. The research sample comprised children and adolescentswith and without
ASD aged from 0 to 17 years. The sample of children with ASDwas extracted from the
national database of the registry ofthe disabled persons,and the sample of children without
ASD was extracted from the NHI Database. In this sample, the records of children who were
also in the national registry of the disabled persons were excluded as well as the records of
children who sought medical treatment for ASD, as determined by physician visits coded 299
according to the International Classification of Diseases, Ninth Revision, Clinical
Modification (ICD-9-CM).
The participants were children with and without ASD, matched at a 1:3 ratio by using
propensity scores for the covariates of sex, age, and parental(or provider) monthly salary.
After matching was completed, differences in health care utilization (ie, physician visits, ER
visits, hospitalization admissions, and health care expenditures) were observed until the end
Measures
The dependent variables in this study were defined as health care utilization and health
care expenditures. Health care utilization modalities were physician visits, ER visits, and
hospitalization. Measured variables were mean number of annual physician visits, whether an
ER visit occurred that year, whether a child was hospitalized that year, mean number of
annual hospitalizations, and mean duration of annual hospitalizations. Furthermore, health
care expenditures includedall NHI costs,and measured variables were mean annual physician
visitexpenditures, mean annual ER visit expenditures, and mean annual hospitalization
expenditures.
The independent variables were whether a child had ASD and factors that influenced
health care utilization behaviors,which were categorized as predisposing, enabling, and need
factors according to Andersen’s Behavioral Model. The predisposing characteristics were sex,
age, and whether a child was aboriginal. Age was divided into 3 ranges: 0–5 years, 6–11
years, and 12–17 years. Information on whether a child was aboriginal was available only for
children with ASD and not for children without ASD; therefore, ethnicity was explored only
as a possible factor of health care utilization behaviors of children with ASD.
Enabling characteristics included parental (or provider’s)monthly salary and urbanization
of the residence areas. Because the participants in this study were children, the monthly
categories: NT$17 880 or less, NT$17 881–NT$22 800, NT$17 881–NT$22 800,
NT$22 801–NT$28 800, NT$28 801–NT$36 300, NT$36 301–NT$45 800, NT$45 801–
NT$57 800, NT$57 801–NT$72 800, and NT$72 801 or more. The degree of urbanization of
the residence areawas based on designations included in the study by Liu et al (2006). The
present study defined 7 degrees of urbanization, of which Level 1 represents the highest
degree and Level 7 represents the lowest. We further combined some of the designations to
form a total of4 categories: highly urbanized cities or areas designated as 1 by Liu et al;
moderately urbanized towns and developing towns or areas designated as 2 or 3; average
towns and aging towns or areas designated as 4 or 5; and agricultural towns and remote towns
or areas designated as 6 or 7.
The need characteristic assessed in this study was severity of comorbidity calculated using
the Charlsoncomorbidity index and ICD-9-CM codes . We defined 3 categories of the
Charlsoncomorbidity index scores: 0, 1, and 2 or higher.
Statistical Analysis
The participants were matched using propensity score matching. The dependent variable
was whether a child had ASD, and the independent variables were sex, age, and parental (or
provider) monthly salary. Logistic regression models were used to calculate the propensity
scores of children with and without ASD, respectively. A greedy algorithm was used for
score. If no matches were identified for a child with ASD, then a match was attempted using a
7-digit propensity score,which was reiterated to 1-digit scores. Because the sample of children
without ASD was sufficiently large, matches were unique.
Incidence and percentage were used to describe the frequency and distribution of the
variables of whether ER visits and hospitalizations occurred. Mean and standard deviation
were used to describe the independent variables related to health care utilization (ie, number
of physician visits, number of ER visits, number of hospitalizations, and duration of
hospitalization). In addition, because the data for health care expenditures yielded a skewed
distribution, all of the values related to health care expenditures were transformed
logarithmically (using log10) prior to analysis.
Because the health care utilization data of the subjects possess the characteristics of
repeated measures, generalized estimating equations (GEEs) were used for performing
inferential statistical analysis. GEE multiple regression or logistic regression was used
depending on the characteristics of the variable. For example, GEE multiple regression was
used forexamining the variance and associated factors in number of physician visits, number
of hospitalizations, duration of hospitalization, and health care expenditures between children
with and without ASD. GEE logistic regression was used for examining the variance and
without ASD. Statistical analyses were performed using SAS 9.3 (SAS Institute Inc., Cary,
NC, USA) in this study.
The Statistics Center of Ministry of Health and Welfare, Taiwan, combined all datasets
with personal identification number and then provided us the datasets including the necessary
information for this study after all personal identification information has been deleted. This
study has been approved by the research ethics committee of China Medical University (IRB
No. CMU-REC-101-012).
第三章 Results
Personal Characteristics of the Study Participants and Pre- and Post-Matching Status
In 2008, the number of children with ASD was 3280, and the number of children without
ASD was 4 796 863. Before matching was conducted, age, sex, and parental (provider)
monthly salary were statistically significant (P< .05). After 1:3 matching was completed, the
sample size of children with ASD was 3280, and the sample size of children without ASD
was 9840, yielding a total sample size of 13 120. After matching was completed, no variable
achieved statistical significance (P> .05). Among the children with ASD, the number of boys
(86.68%) was higher than that of girls (13.32%),most of the children were aged between 6
and 11 years (48.64% vs 49.54%), and most had a parental monthly salary range of
Variance in Health Care Utilization Behaviors and Expenditures between Children with and Without Autism Spectrum Disorder
Table 2 indicates that physician visits, whether ER visits occurred, whether hospitalization
occurred, health care expenditures, and duration of hospitalizations were significantly higher
among children aged 0–17 years with ASDthan those among the children without ASD (P< .
05). The mean number of annual physician visits was 26.54 and 12.43, the mean number of
annual ER visits was 0.29 versus 0.25, the mean number of annual hospitalizations was 0.07
versus 0.05, and the average duration of hospitalizations was 1.46 days versus 0.21 days for
the children with and without ASD, respectively. The mean annual physician visit expenditure
was NT$33 190 and NT$6610 for the children with and withoutASD, respectively, and the
mean ER visit expenditure was NT$430 and NT$380, respectively. Furthermore, the mean
hospitalization expenditure was NT$10 310 versus NT$4480, and the mean total health care
expenditure was NT$43 930 andNT$11 470 for the children with and without ASD,
respectively (Table 2).
After sex, age, monthly salary, degree of urbanization, severity of comorbidity, and year
of observation were adjusted for, all of the health care utilization and health care expenditure
categories except for duration of hospitalization were significantly higher among the children
with ASD than those among the children without ASD. Compared with the children without
ERs 1.12 times more frequently, and were hospitalized 1.48 times more often. The physician
visit expenditures were 4.12 times higher, ER visit expenditures were 1.2 times higher,
hospitalization expenditures were 1.25 times higher, and total health care expenditures were
3.97 times higher for the children with ASDcompared withthose without ASD (all P< .05;
Table 2).
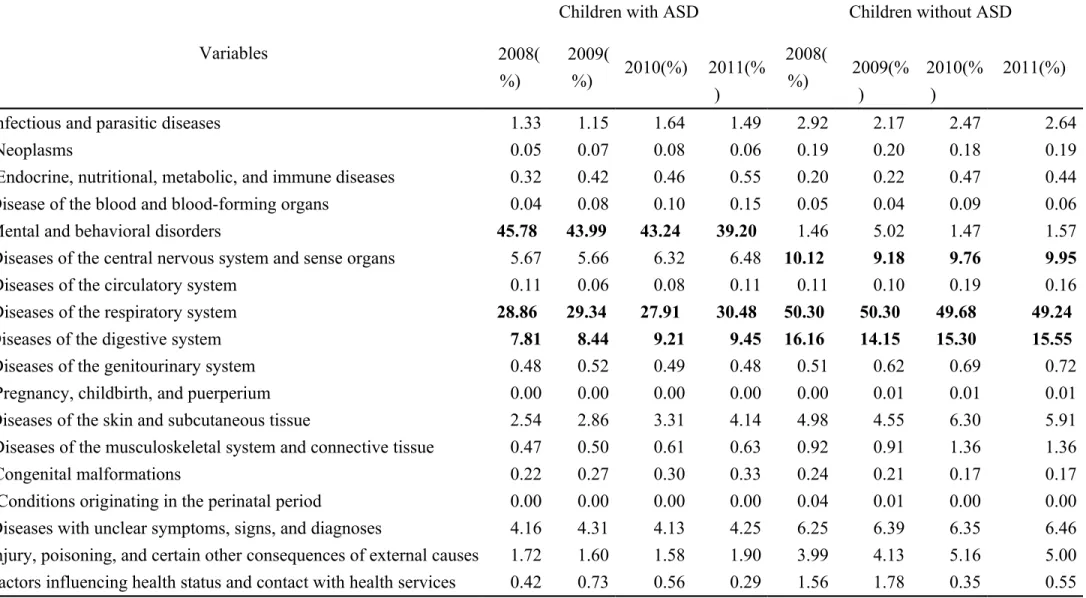
To understand the differences in medical treatment specialties sought by children with and
without ASD, we focused on the diseases and categorized these according to year. The results
showed that the children with ASD most commonly experienced psychiatric illnesses (45.8%
in 2008 and 39.2% in 2011), respiratory illnesses (28.9% in 2008 and 30.5% in 2011), and
digestive illnesses (7.8% in 2008 and 9.5% in 2011),whereas the children without ASD most
commonly experienced respiratory illnesses (50.3% in 2008 and 49.2% in 2011), digestive
illnesses (16.2% in 2008 and 15.5% in 2011), and nervous system or sense organ illnesses
(10.1% in 2008 and 10.0% in 2011; Table 3).
Factors Influencing Health Care Utilization Behaviors and Expenditures among Children with Autism Spectrum Disorder
Using GEE multiple regression analysis for predictingthe independent factors of health
care behaviors of the children with ASDrevealed that the children who exhibited a
comorbidity index of 1 averaged 2.87 fewer physician visits compared with the children who
wasobserved for children who exhibited a comorbidity index of 2 or higher. Age, monthly
salary, and severity of comorbidity showed a similar predictability of whether ER visits or
hospitalizations occurred. The only factor that influenced duration of hospitalization was
ethnicity; the duration of hospitalization was 3.16 days longer for aboriginal children
compared with that for non-aboriginal children (P = .033; Table 4).
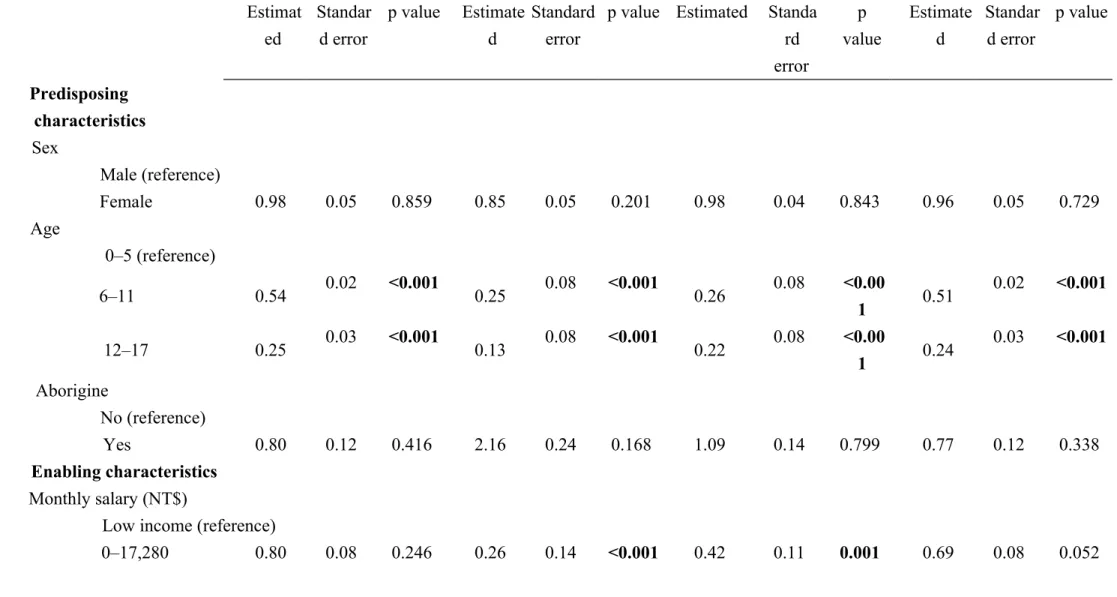
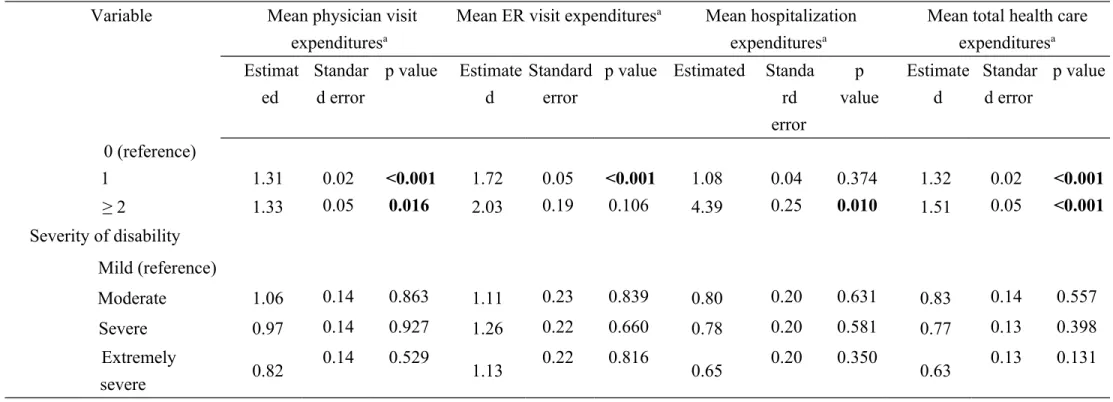
GEE multiple regression analysis for predictingindependent factors of health care
expenditures for children with ASDrevealed that age, monthly salary, and severity of
comorbidity were independent factors that could predict mean physician visit, ER visit,
hospitalization, and total health care expenditures. All expenditure categories were
significantly lower among the children aged older than 6 years with ASD than among the
children aged younger than 5 years with ASD (these values differed by factors ranging from
0.13 to 0.54, all P< .05). Compared with the children with ASD from low-income families,
the children with ASD not from low-income families had lower physician visit expenditures,
ER visit expenditures, hospitalization expenditures, and total health care expenditures (all
P< .05). Compared with the children with ASDwho exhibited lower comorbidity indices, the
children with ASDwho exhibited higher comorbidity indices had higher physician visit, ER
visit, hospitalization, and total health care expenditures (all P< .05; Table 5).
第四章 Discussion
ASD differed from those of the children without ASD, including more physician visits, ER
visits, and hospitalization. These results are consistent with those of American studies .
Studies on health care utilization based on twodatabases (1998–2004 North Dakota Medicaid
claims database and 2003–2004 Kaiser Permanente Medical Care Program in Southern
California) have indicated that the number of physician visits among children with ASD was
higher than that among children without ASD. In the analysis of the Medicaid claims
database, the number of annual physician visits was 79 versus 11(Croen et al, 2006; Peng et
al, 2009),and in the analysis of the nonprofit Kaiser Permanente Medical Care database the number was 89.8 versus 77.4 (Croen et al, 2006). According to a 2003–2004 survey of 85,272
American families with children aged younger than 18 years, both the number of self-reported
physician and ER visits were higher among children with ASD than that among children
without ASD (2.80 vs 1.56 for physician visits and 0.18 vs 0.10 for ER visits) . Croen et al
(2006) indicated that the percentage of children with ASD who visited the ER (10.9%) was
higher than that of children without ASD (9.8%). American studies have shown that children
with ASDwere hospitalized more often than children without ASD (5 times vs 2 times) (Peng
et al, 2009), and the duration of each hospital stay was longer (25 d vs 5 d) (Mandell et al, 2006). Although children with ASD tended to use health care services more frequently, they were 60% more likely to delay or cease treatment and were 1.14 times more likely to
suggest that health care providers must be increasingly concerned with meeting the health
care needs of children with ASD to avoid leaving the needs of these children unmet despite
frequent health care visits.
Previous studies have revealed that the health care expenditures of children with
ASDwere higher than those of children without ASD,which is consistent with our results.
American studies on Medicaid recipientshave indicated that the health care expenditures of
children with ASDwere 9 times higher than those of children without ASD, and a study of
privatelyinsured children with ASD showed that their health care expenditures were 4 to 6
times higher than those of children without ASD. Compared with these studies, we
determined a smaller variance (3.97 times, or NT$43 930 higher), which could be attributed
to the smaller variance in hospitalization costs observed in this study. Compared with the
children without ASD, the children with ASDused a higher proportion of health insurance
resources. In addition, their frequency of medical visits caused a burden on their families.
Kogan et al (2008) indicated that caring for a child with ASD is more likely to cause
economic hardship than caring for a child without ASD (39% vs 14%).
Wedetermined that children with ASDfrequently sought treatment related to psychiatric
and respiratory illnesses, and children without ASDfrequently sought treatment related to
respiratory and digestive illnesses. These findings are consistent withthe results of previous
with ASD differ from those experienced by children without ASD. Children with ASD
experience increased mental health problems ; they were9 times more likely to experience
depression or anxiety. In addition to mental health problems, children with ASD are likely to
experience respiratory illnesses and food or skin allergies . Differences in health problems
yield differences in health care utilization behaviors. Physician visits among children with
ASDtypically involve psychiatrics . The odds of using psychotropic medications were9 times
higher in children with ASD than in children without ASD,and the odds of using
gastrointestinal medications were 4 times higher in children with ASD than in children
without ASD. In addition, the reasons for hospitalization differ between children with and
without ASD. Children with ASD are more likely to be hospitalized for self-injury behaviors,
aggression toward others, depression, or obsessive-compulsive behaviors . Among children
with ASD, 13% of ER visits are for psychiatric reasons. The odds for children with ASD
visiting the ERfor psychiatric reasons were9 times higher than those for children without
ASD.
Numerous studies have shown that predisposing characteristics, such as age, sex, and
ethnicity were independent predictors of health care utilization behaviors among children with
ASD. For example, health care utilization may differ according to sex and ethnicity. Mandell
et al (2012) asserted that females with ASDwere hospitalized less often than males with ASD
insurance coverage, specialized care of autistic children differed according to ethnicity.
Nonwhite children with ASD were less likely to receive colonoscopies, fecal tests, brain
magnetic resonance imaging, and sleep assessment compared with white children . Barrett et
al (2014) analyzed the 6-month medical expenditures of 96 children with ASDbetween the
ages of 14 and 17 years and determined that each year increase in age resulted in ₤4917 less
spending and that expenditure was unrelated to sex, ethnicity, or comorbidity. Similarly, we
observed no differences in health care utilization related to sex or ethnicity, and age was the
only demographic factor that was a predictor of health care utilization. Cidav et al (2013)
asserted that as children aged, physician visits, hospitalization, and total medical expenditures
increased. Similarly, we observed that all medical expenditures increased as age increased
among the children with ASD. However, we determined that the children with ASD
agedyounger than 5 years had higher rates of hospitalization,and this rate decreased as the
children aged. This trend conforms to the British study but differs from twoAmerican studies
that have indicated that hospitalization rates increased as age increased . In addition to age, we
determined that monthly salary and comorbidity were factors affecting the total health care
expenditures of the children with ASD; however, Barrett et al (2014) indicated that
comorbidity was unrelated to medical expenditures.
Lin et al (2011) analyzed the hospitalization rate of a random sampling of children with
their study lacked an appropriate control group and could notexamine the differences in health
care utilization among children with and without ASD. In addition, theirstudy examined only
children with ASD who had been previously hospitalized and excluded those who had not
been hospitalized; therefore, the estimations of hospitalization rates and durations were
exceedingly high. We used the records of all nationally registered children with ASD in 2008,
for a total sample size of 3280 children,who were appropriately matched with children
without ASD. Their health care utilization and expenditures were calculated for a period of 4
years. Thus, this study can accurately reflect the health care utilization of children with ASD.
第五章 Conclusion
In summary, the health care utilization and expenditures of children with ASD are higher
than those of children without ASD. Children with ASD frequently seek treatment for
psychiatric illnesses, while children without ASD frequently seek treatment for respiratory
illnesses. Age, monthly salary, and severity of comorbidity are crucial predictors of health
care utilization among children with ASD. Because children with ASD cannot communicate
effectively and have mental disabilities, their cognitive and self-care abilities are inadequate.
Therefore, providing appropriate health education and preventative medical treatment to
第六章
LimitationsThis study used the secondary data to analyze. Because ofthe limitations caused bythe
fixed state of the records in the NHIRD, we could analyze only some of the variables. We
could notexamine the relationship between factors such as life style or health behavior and
health care utilization. In addition, because children earn no income of their own, we could
reference only the monthly salaries of the parents.
Acknowledgments
This study was supported by grants (DMR-103-077; CMU101-ASIA-14) from China
Medical University Hospital, China Medical University, and Asia University, Taiwan.We are
grateful for the use of the National Health Insurance Research Database as provided by the
Ministry of Health and Welfare, Taiwan. The interpretations and conclusions contained herein
References
Andersen, R. M. (1995). Revisiting the behavioral model and access to medical care: does it matter? Journal of health and social behavior, 36, 1-10.
Barrett, B., Mosweu, I., Jones, C. R., Charman, T., Baird, G., Simonoff, E., Pickles, A., Happe, F., & Byford, S. (2014). Comparing service use and costs among adolescents with autism spectrum disorders, special needs and typical development. Autism : the
international journal of research and practice.
Boulet, S. L., Boyle, C. A., & Schieve, L. A. (2009). Health care use and health and functional impact of developmental disabilities among US children, 1997-2005.
Archives of pediatrics & adolescent medicine, 163, 19-26.
Broder-Fingert, S., Shui, A., Pulcini, C. D., Kurowski, D., & Perrin, J. M. (2013). Racial and ethnic differences in subspecialty service use by children with autism. Pediatrics, 132, 94-100.
Cidav, Z., Lawer, L., Marcus, S. C., & Mandell, D. S. (2013). Age-related variation in health service use and associated expenditures among children with autism. Journal of
autism and developmental disorders, 43, 924-931.
Croen, L. A., Najjar, D. V., Ray, G. T., Lotspeich, L., & Bernal, P. (2006). A comparison of health care utilization and costs of children with and without autism spectrum disorders in a large group-model health plan. Pediatrics, 118, e1203-1211.
Deyo, R. A., Cherkin, D. C., & Ciol, M. A. (1992). Adapting a clinical comorbidity index for use with ICD-9-CM administrative databases. Journal of clinical epidemiology, 45, 613-619.
Fontanella, C. A. (2008). The influence of clinical, treatment, and healthcare system characteristics on psychiatric readmission of adolescents. The American journal of
orthopsychiatry, 78, 187-198.
Frazier, T. W., Shattuck, P. T., Narendorf, S. C., Cooper, B. P., Wagner, M., & Spitznagel, E. L. (2011). Prevalence and correlates of psychotropic medication use in adolescents with an autism spectrum disorder with and without caregiver-reported attention-deficit/hyperactivity disorder. Journal of child and adolescent psychopharmacology,
21, 571-579.
Gurney, J. G., McPheeters, M. L., & Davis, M. M. (2006). Parental report of health conditions and health care use among children with and without autism: National Survey of Children's Health. Archives of pediatrics & adolescent medicine, 160, 825-830.
Kalb, L. G., Stuart, E. A., Freedman, B., Zablotsky, B., & Vasa, R. (2012). Psychiatric-related emergency department visits among children with an autism spectrum disorder.
Pediatric emergency care, 28, 1269-1276.
Kogan, M. D., Strickland, B. B., Blumberg, S. J., Singh, G. K., Perrin, J. M., & van Dyck, P. C. (2008). A national profile of the health care experiences and family impact of autism spectrum disorder among children in the United States, 2005-2006. Pediatrics,
122, e1149-1158.
Mandell, D. S., Cao, J., Ittenbach, R., & Pinto-Martin, J. (2006). Medicaid expenditures for children with autistic spectrum disorders: 1994 to 1999. Journal of autism and
developmental disorders, 36, 475-485.
Mandell, D. S., Xie, M., Morales, K. H., Lawer, L., McCarthy, M., & Marcus, S. C. (2012). The interplay of outpatient services and psychiatric hospitalization among Medicaid-enrolled children with autism spectrum disorders. Archives of pediatrics & adolescent
medicine, 166, 68-73.
Peng, C. Z., Hatlestad, P., Klug, M. G., Kerbeshian, J., & Burd, L. (2009). Health care costs and utilization rates for children with pervasive developmental disorders in North Dakota from 1998 to 2004: impact on Medicaid. Journal of child neurology, 24, 140-147.
Shimabukuro, T. T., Grosse, S. D., & Rice, C. (2008). Medical expenditures for children with an autism spectrum disorder in a privately insured population. Journal of autism and
developmental disorders, 38, 546-552.
Welfare, M. o. H. (2014). The Disabled Population by Classification and Grade. In NO (Ed.),
Statistical Yearbook of Social Welfare (- ed., Vol. 2014, pp. NO). Taipei: Ministry of
Health and Welfare.
Highlights:
Children with ASD had more annual physician visits, ED visits, and hospitalization. Medical expenses are 3.9 times higher inchildren with ASD than those without ASD Children with ASD oftensought treatment for psychiatric and respiratory illnesses Age, monthly salary,and comorbidity are predictors of health care expenditures.
Before matching After 1:3 matching
Variable Children with ASD Children without ASD P value Children with ASD Children without ASD p value
N % N % N % N % Total 3280 0.07 4 796 863 99.93 3280 25.00 9840 75.00 Sex <0.001 1.000 Male 2843 86.68 2 491 022 51.93 2843 86.68 8529 86.68 Female 437 13.32 2 305 841 48.07 437 13.32 1311 13.32 Age (years) 0.00 <0.001 0.493 0–5 478 14.57 1 232 610 25.70 478 14.57 1434 14.57 6–11 1625 49.54 1 654 524 34.49 1625 49.54 4756 48.33 12–17 1177 35.88 1 909 729 39.81 1177 35.88 3650 37.09 Average Age(SD) 9.41(5.04) 9.87(3.95) 9. 9.77(4.36) 9.87(3.95) Monthly Salary(NT$) <0.001 1.000
Low income household 75 2.29 89 750 1.87 75 2.29 225 2.29
0–17,280 14 0.43 449 609 9.37 14 0.43 42 0.43 17,281–22,800 816 24.88 1 645 895 34.31 816 24.88 2448 24.88 22,801–36,300 777 23.69 1 479 677 30.85 777 23.69 2331 23.69 36,301–45,800 377 11.49 429 783 8.96 377 11.49 1131 11.49 45,801–57,800 325 9.91 308 944 6.44 325 9.91 975 9.91 57,801–72,800 367 11.19 241 681 5.04 367 11.19 1101 11.19 ≧72,801 529 16.13 151 524 3.16 529 16.13 1587 16.13
Table 2Comparison of differences in health care utilization and expenditures among children with ASD and without ASD
Bivariate analysis
Multivariate generalized estimating equation models a
Children without ASD
Children with ASD
t test Children with ASD versus children
without ASD
Variable Mea
n
SD Mean SD P value Dependent variable Estimate
d 95% confidence interval P value Mean number of physician visits 12.4 3 10.0 8 26.54 2.67 <0.001 Mean number of physician visits 14.20 13.43 14. 97 <0.00 1 Mean number of ER visits 0.25 0.46 0.29 0.52 0.001 Whether ER visit occurredb 1.12 0.05 0.1 8 <0.00 1 Mean number of hospitalizations 0.05 0.21 0.07 0.23 <0.001 Whether hospitalization occurredb 1.48 0.28 0.5 1 <0.00 1 Mean duration of hospitalization in days 0.21 1.35 1.46 11.32 <0.001 Mean duration of hospitalization in days 0.10 -0.48 0.6 8 0.735
Average physician visit expenditure (NT$)c
6.61 8.18 33.19 54.36 <0.001 Average physician visit expenditure (NT$)d 4.12 3.76 4.5 1 <0.00 1 Average ER visit expenditure (NT$)c 0.38 0.82 0.43 0.92 0.007 Average ER visit expenditure (NT$)d 1.20 1.10 1.3 1 <0.00 1 Average hospitalization expenditure (NT$)c 4.48 111. 19 10.31 131.1 6 0.022 Average hospitalization expenditure (NT$)d 1.26 1.15 1.3 8 <0.00 1 Average total health care
expenditure (NT$)c 11.4 7 112. 41 43.93 143.3 9
<0.001 Average total health care expenditure (NT$)d
3.97 3.63 4.3
5
<0.00 1
aMultivariate generalized estimation equation was used to adjust for sex, age, monthly salary, degree of urbanization, severity of morbidity, and year of observation
bEstimation of odds ratios and 95% confidence intervals c The unit of health care expenditures is NT$1,000
Table 3Yearly physician visits according to diseases as a percentage of total visits
Variables
Children with ASD Children without ASD
2008( %) 2009( %) 2010(%) 2011(% ) 2008( %) 2009(% ) 2010(% ) 2011(%)
Infectious and parasitic diseases 1.33 1.15 1.64 1.49 2.92 2.17 2.47 2.64
Neoplasms 0.05 0.07 0.08 0.06 0.19 0.20 0.18 0.19
Endocrine, nutritional, metabolic, and immune diseases 0.32 0.42 0.46 0.55 0.20 0.22 0.47 0.44
Disease of the blood and blood-forming organs 0.04 0.08 0.10 0.15 0.05 0.04 0.09 0.06
Mental and behavioral disorders 45.78 43.99 43.24 39.20 1.46 5.02 1.47 1.57
Diseases of the central nervous system and sense organs 5.67 5.66 6.32 6.48 10.12 9.18 9.76 9.95
Diseases of the circulatory system 0.11 0.06 0.08 0.11 0.11 0.10 0.19 0.16
Diseases of the respiratory system 28.86 29.34 27.91 30.48 50.30 50.30 49.68 49.24
Diseases of the digestive system 7.81 8.44 9.21 9.45 16.16 14.15 15.30 15.55
Diseases of the genitourinary system 0.48 0.52 0.49 0.48 0.51 0.62 0.69 0.72
Pregnancy, childbirth, and puerperium 0.00 0.00 0.00 0.00 0.00 0.01 0.01 0.01
Diseases of the skin and subcutaneous tissue 2.54 2.86 3.31 4.14 4.98 4.55 6.30 5.91
Diseases of the musculoskeletal system and connective tissue 0.47 0.50 0.61 0.63 0.92 0.91 1.36 1.36
Congenital malformations 0.22 0.27 0.30 0.33 0.24 0.21 0.17 0.17
Conditions originating in the perinatal period 0.00 0.00 0.00 0.00 0.04 0.01 0.00 0.00
Diseases with unclear symptoms, signs, and diagnoses 4.16 4.31 4.13 4.25 6.25 6.39 6.35 6.46 Injury, poisoning, and certain other consequences of external causes 1.72 1.60 1.58 1.90 3.99 4.13 5.16 5.00 Factors influencing health status and contact with health services 0.42 0.73 0.56 0.29 1.56 1.78 0.35 0.55
Note: The 3 highest percentages per year are presented in bold
Note: The 18 classifications of illnesses are based on the international classification of diseases, injury, and death in the 1975 edition of the ICD-9
Table 4Multivariate generalized estimating equation model analysis of health care utilization behaviors in children with ASD
Variable
Average number of physician visits
Whether ER visit occurred
Whether hospitalization occurred
Average duration of hospitalization in days Estimat ed 95% C.I. p value OR 95% C.I. p
value OR 95% C.I. p value
Estimated 95% C.I. p value Predisposing characteristics Sex Male (reference) Female 10.77 -9.1 30.64 0.288 0.90 0.7 6 1.06 0.205 0.98 0.75 1.28 0.862 0.18 -3.34 3.7 0.919 Age 0–5(reference) 6–11 2.37 -0.56 5.3 0.113 0.52 0.4 4 0.61 <0.00 1 0.31 0.24 0.39 <0.001 0.08 -4.62 4.77 0.974 12–17 2.25 -1.02 5.51 0.177 0.33 0.2 7 0.39 <0.00 1 0.23 0.17 0.30 <0.001 0.3 -4.37 4.98 0.898 Aborigine No (reference) Yes 21.22 -49.3 91.74 0.555 1.52 0.9 0 2.59 0.118 1.13 0.53 2.39 0.753 3.16 0.26 6.07 0.033 Enabling characteristics Monthly
Variable
Average number of physician visits
Whether ER visit occurred
Whether hospitalization occurred
Average duration of hospitalization in days Estimat ed 95% C.I. p value OR 95% C.I. p
value OR 95% C.I. p value
Estimated
95% C.I. p value salary (NT$)
Low income (reference)
0–17,280 -4.26 -9.89 1.37 0.138 0.45 0.3 2 0.64 <0.00 1 0.34 0.19 0.62 <0.001 -0.48 -3.51 2.54 0.754 17,281– 22,800 -3.03 -8.57 2.51 0.283 0.54 0.4 1 0.71 <0.00 1 0.48 0.31 0.74 <0.001 0.87 -2.43 4.17 0.604 22,801– 36,300 -3.25 -8.43 1.93 0.219 0.45 0.3 4 0.60 <0.00 1 0.42 0.27 0.65 <0.001 -0.24 -3.04 2.56 0.865 36,301– 45,800 -2.48 -8.25 3.3 0.401 0.54 0.3 9 0.73 <0.00 1 0.54 0.33 0.88 0.013 3.04 -2.35 8.42 0.269 45,801– 57,800 -2.45 -8.25 3.35 0.408 0.53 0.3 9 0.73 <0.00 1 0.44 0.26 0.73 0.002 -2.23 -7.56 3.11 0.413 57,801– 72,800 -2.26 -8.27 3.75 0.461 0.48 0.3 5 0.65 <0.00 1 0.45 0.28 0.74 0.002 -0.49 -3.89 2.91 0.777 ≥ 72,801 -2.72 -8.18 2.74 0.329 0.51 0.3 7 0.69 <0.00 1 0.49 0.30 0.79 0.004 -0.12 -3.15 2.92 0.94
Variable
Average number of physician visits
Whether ER visit occurred
Whether hospitalization occurred
Average duration of hospitalization in days
Estimated
95% C.I. p value OR 95% C.I.
p valu e OR 95% C.I. p value Estimated 95% C.I. p value Degree of urbanization 1 (reference) 2+3 -1.84 -4.49 0.82 0.176 0.9 3 0.83 1.04 0.20 8 1.04 0.85 1.28 0.682 -2.46 -6.34 1.43 0.215 4+5 -1.65 -6.07 2.77 0.464 0.9 9 0.84 1.17 0.91 8 1.16 0.86 1.58 0.323 -1.01 -3.84 1.83 0.487 6+7 -1.79 -8.68 5.11 0.612 1.0 1 0.76 1.34 0.95 1 0.99 0.59 1.65 0.979 -2.74 -7.33 1.86 0.243 Need characteristics Severity of comorbidity 0 (reference) 1 -2.87 -5.21 -0.53 0.016 1.3 8 1.21 1.58 <.00 01 1.09 0.86 1.40 0.455 -0.95 -3.66 1.76 0.491 ≥ 2 -4.18 -10.47 2.1 0.192 1.4 2 0.93 2.16 0.10 5 3.00 1.60 5.70 0.001 -18.31 -44.5 4 7.91 0.171
Variable
Average number of physician visits
Whether ER visit occurred
Whether hospitalization occurred
Average duration of hospitalization in days
Estimated
95% C.I. p value OR 95% C.I.
p valu e OR 95% C.I. p value Estimated 95% C.I. p value Severity of disability Mild (reference) Moderate 6.81 -70.76 84.37 0.864 1.1 1 0.51 2.41 0.80 2 0.83 0.31 2.18 0.705 -0.2 -4.32 3.92 0.923 Severe -2.95 -78.59 72.7 0.939 1.2 1 0.55 2.61 0.63 9 0.76 0.30 1.99 0.582 -0.36 -3.87 3.16 0.843 Extremely severe 11.93 -63.2 87.06 0.756 1.1 3 0.52 2.44 0.76 5 0.59 0.23 1.54 0.281 -0.56 -3.71 2.59 0.727 Year under observation 2008 (reference) 2009 -1.55 -2.2 -0.9 <0.001 1.2 3 1.11 1.38 <0.0 01 1.11 0.92 1.34 0.277 0.8 0.13 1.47 0.019 2010 -4.85 -5.71 -4 <0.001 0.9 5 0.84 1.08 0.44 6 0.90 0.73 1.13 0.378 -0.55 -1.38 0.28 0.197 2011 -5.5 -7.34 -3.67 <0.001 1.0 2 0.90 1.15 0.78 8 0.84 0.67 1.06 0.154 -1.51 -2.41 -0.61 0.001
Table 5Multivariate generalized estimating equation model analysis of health care expenditures in children with ASD Variable Mean physician visit
expendituresa
Mean ER visit expendituresa Mean hospitalization expendituresa
Mean total health care expendituresa Estimat ed Standar d error p value Estimate d Standard error
p value Estimated Standa rd error p value Estimate d Standar d error p value Predisposing characteristics Sex Male (reference) Female 0.98 0.05 0.859 0.85 0.05 0.201 0.98 0.04 0.843 0.96 0.05 0.729 Age 0–5 (reference) 6–11 0.54 0.02 <0.001 0.25 0.08 <0.001 0.26 0.08 <0.00 1 0.51 0.02 <0.001 12–17 0.25 0.03 <0.001 0.13 0.08 <0.001 0.22 0.08 <0.00 1 0.24 0.03 <0.001 Aborigine No (reference) Yes 0.80 0.12 0.416 2.16 0.24 0.168 1.09 0.14 0.799 0.77 0.12 0.338 Enabling characteristics Monthly salary (NT$)
Low income (reference)
Variable Mean physician visit expendituresa
Mean ER visit expendituresa Mean hospitalization expendituresa
Mean total health care expendituresa Estimat ed Standar d error p value Estimate d Standard error
p value Estimated Standa rd error p value Estimate d Standar d error p value 17,281–22,800 0.77 0.07 0.119 0.34 0.12 <0.001 0.53 0.10 0.007 0.67 0.07 0.022 22,801–36,300 0.77 0.08 0.130 0.27 0.12 <0.001 0.49 0.10 0.003 0.67 0.08 0.023 36,301–45,800 0.83 0.08 0.308 0.34 0.13 <0.001 0.57 0.11 0.028 0.73 0.08 0.083 45,801–57,800 0.89 0.08 0.504 0.33 0.13 <0.001 0.49 0.11 0.005 0.78 0.08 0.184 Table 5Multivariate generalized estimating equation model analysis of health care expenditures in children with ASD (continued)
Variable Mean physician visit expendituresa
Mean ER visit expendituresa Mean hospitalization expendituresa
Mean total health care expendituresa Estimat ed Standar d error p value Estimate d Standard error
p value Estimated Standa rd error p value Estimate d Standar d error p value 57,801–72,800 0.82 0.08 0.258 0.28 0.13 <0.001 0.51 0.11 0.006 0.72 0.08 0.066 ≥ 72,801 0.65 0.08 0.023 0.31 0.13 <0.001 0.54 0.11 0.014 0.59 0.08 0.005 Degree of urbanization 1 (reference) 2+3 1.03 0.02 0.634 0.90 0.04 0.211 1.00 0.03 0.947 1.03 0.02 0.607 4+5 0.98 0.04 0.860 0.98 0.06 0.904 1.12 0.05 0.311 1.03 0.04 0.702 6+7 0.99 0.06 0.908 1.00 0.10 0.995 1.01 0.08 0.946 1.03 0.06 0.829 Need characteristics Severity of comorbidity
Variable Mean physician visit expendituresa
Mean ER visit expendituresa Mean hospitalization expendituresa
Mean total health care expendituresa Estimat ed Standar d error p value Estimate d Standard error
p value Estimated Standa rd error p value Estimate d Standar d error p value 0 (reference) 1 1.31 0.02 <0.001 1.72 0.05 <0.001 1.08 0.04 0.374 1.32 0.02 <0.001 ≥ 2 1.33 0.05 0.016 2.03 0.19 0.106 4.39 0.25 0.010 1.51 0.05 <0.001 Severity of disability Mild (reference) Moderate 1.06 0.14 0.863 1.11 0.23 0.839 0.80 0.20 0.631 0.83 0.14 0.557 Severe 0.97 0.14 0.927 1.26 0.22 0.660 0.78 0.20 0.581 0.77 0.13 0.398 Extremely severe 0.82 0.14 0.529 1.13 0.22 0.816 0.65 0.20 0.350 0.63 0.13 0.131
Table 5Multivariate generalized estimating equation model analysis of health care expenditures in children with ASD (continued) Variable Mean physician visit
expendituresa
Mean ER visit expendituresa Mean hospitalization expendituresa
Mean total health care expendituresa Estimat ed Standar d error p value Estimate d Standard error
p value Estimated Standa rd error p value Estimate d Standar d error p value
Variable Mean physician visit expendituresa
Mean ER visit expendituresa Mean hospitalization expendituresa
Mean total health care expendituresa Estimat ed Standar d error p value Estimate d Standard error
p value Estimated Standa rd error p value Estimate d Standar d error p value 2008 (reference) 2009 1.01 0.02 0.839 1.38 0.04 <0.001 1.08 0.03 0.244 1.01 0.02 0.694 2010 0.90 0.02 0.019 0.94 0.04 0.524 0.96 0.03 0.543 0.91 0.02 0.032 2011 0.95 0.02 0.293 1.04 0.04 0.664 0.90 0.03 0.127 0.95 0.02 0.279