What is Missing? Using Data Mining Techniques with Business Cycle Phases
for Predicting Company Financial Crises
I-Hsien Ting a,, Yu-Cheng Lin a
a
Department of Information Management, National University of Kaohsiung, Taiwan
Received; Revised; Accepted
Abstract
In the different phase of the business cycle, companies may face different financial crises with different financial attributes. In this paper we take the phases of the business cycle into consideration and use data mining as a technique to predict firms that may face a potential financial crisis. Since we hypothesize that financial crises are closely related to the business cycle, we have determined which periods show expansionary or recessionary trends. The objective of this paper is to determine important variables affecting financial crises and use this information to improve the accuracy of financial predictions. The electronic industry has been selected as the main focus, as this is a very important industry in Taiwan. Five experimental models have been designed for empirical study and an optimal model has also been established. From the results, we have discovered some important financial variables that can cause business’s financial crises in different phases of the business cycle. In considering the business cycle, the model achieved better predictive accuracy and a support vector model has a higher predictive accuracy than other data mining techniques.
Keywords: Business cycle, financial crisis, data mining, financial engineering
1. Introduction
An internal financial crisis is usually the portent for bankruptcy for most companies in an open market. In Taiwan, 152 publicly traded companies faced their own financial crisis during the period 1982 to 2009. The approximate total capital of all these companies at their time of bankruptcy was near USD15 billion. Furthermore, 30% (or 45) of these companies were in the electronic industry as more than 50 % of the companies in the publicly traded market in 2010 are electronics companies with a total capital of almost USD40 billion. The electronics industry therefore plays a very important role in Taiwan’s economy.
Recently, the Taiwanese electronics industry has become mature and has formed a very complete industry chain. Therefore, if one firm in the industry suffers a financial crisis, it will often impact other partners in the industry, causing a chain reaction of defaults and bankruptcies and even affecting Taiwan’s overall industrial structure –likely causing serious damage to the national economy.
Therefore, it is necessary to develop a useful model to predict potential financial crises within the electronics industry in Taiwan. Financial crisis prediction using data mining techniques is now considered to be a very useful model to extract hidden patterns from large amounts of financial data, a topic which will be discussed in the literature review section of this paper.
In the research field of applying data mining for financial crisis prediction, the use and selection of appropriate financial factors is critical for developing a successful model.
Corresponding author. Email: iting@nuk.edu.tw
However, researchers have rarely considered including the effects of the business cycle even though they has been recognized as very important factors in much of the research. One of the possible reasons for this lies in how to define the business cycle and how to divide financial data into appropriate data groups. Thus, it is very difficult to include these factors into current data mining based financial crisis prediction models.
In this paper, we attempt to include the missing factor (the business cycle) in most data mining techniques for financial crisis prediction. We attempt to determine different financial crisis situations in different parts of the business cycle and we hypothesize that different financial crisis situations are closely related to the business cycle. If we can determine the important financial crisis variables in different phases of the business cycle, then we can improve our ability to predict a financial crisis.
Taking into consideration the economic environment of Taiwan, we divided the business cycle into two different phases: the expansionary phase and the recession phase, based upon information provided by the Taiwanese government’s Council for Economic Planning. Next, public information from the Taiwan Stock Exchange Corporation (TSEC) was used to identify the financial ratios of each company. Finally, data mining techniques were used to identify important financial variables in different phases of the business cycle.
In detail, the main objectives of this paper are 1) Building a financial crisis prediction model based on data mining techniques that also takes into consideration the phases of the business cycle as a new variable. 2) Use these phases of the business cycle as a means to divide the financial data. 3) Using various data mining techniques, such as SVM (Support Vector Machine), ANN (Artificial Neural Network) and LR (Logistic Regression), to identify important financial variables operative during different phases of the business cycle.
The organization of the paper is described as follows. In section 1, we introduce the background, motivation and object of the paper. In section 2, a review of the relevant literature is provided. The research design and architecture of the paper is introduced and described in section 3. In section 4, an optimal model will be proposed as well as an empirical study. Finally, we conclude the paper in section 5 and provide some future research directions and suggestions.
2. Literature review
2.1 Defining a ‘financial crisis’
Before discussing how to predict financial crises, the term “financial crisis” must first be defined. In the existing literature, researchers have not given identical definitions of the term; for example the definitions of Beaver (1966), Altman (1968), Deakin (1972) and Ohlson (1980) are all different. In this paper, in order to best match the Taiwanese economic situation and environment, we have defined financial crisis based upon the definition used by the Taiwan Economic Journal Data Bank (TEJ) as below:
(a) Real financial crisis events: The crisis events have already hit the mass media, such as bad checks, bankruptcy,、ongoing expressions of concern, reorganization, takeover, huge loss, net worth per share is lower than five, violation of information disclosure, stopping of operations, negative net worth (Orgler, 1970).
(b) Quasi financial crisis events: The crisis events haven’t hit the mass media but events such as emptying out, trading suspension, company chairman fired, deflation, huge loss, stopping operations due to poor market or economy, impairment of value.
2.2 Financial crisis prediction models
Crisis prediction is the most important issue in risk management. In the past, many researchers have focused on this issue and various methodologies have been used - from statistical methodology to Artificial Intelligence. On the other hand, previous researchers have considered not only the financial ratios but also the non-financial ones for variables’ selection (Werbos, 1974). In this section, the two typical financial crisis prediction methodologies; the statistical methods and artificial intelligence approaches will be selected for discussion and the related literatures will be reviewed.
(a) Statistical methods:
Beaver (1966) was the first researcher to use Univariate Discriminate Analysis to predict financial crises in firms in the United States. He took 97 failed and 97 healthy firms as the samples for an empirical study during the period from 1954 to 1965. In that research, the final analysis showed that the ratio of “cash flow to total debt” is the most significant variable. However, the reasons behind financial crises are always complex, and it is not viable to use a single variable for forecasting.
Altman (1968) therefore used Multiple Discriminate Analysis to build models for predicting bankruptcy. The selected samples were 33 firms in a financial crisis, along with 33 healthy firms in the United States during the period from 1954 to 1964. Furthermore, 22 financial ratios were selected in this research to create the well-known Z-Score Models. The
Z-score model is based on the following re-calculated financial ratios: X1=Working
Capital/Total Assets, X2=Retained Earnings/Total Assets, X3=Earnings before Interest and Taxes/Total Assets, X4=Market Value of Equity/Book Value of Total Liabilities, X5=Sales/ Total Assets. The Z-score value can then be used to predict financial crisis, with the lower the value the greater the risk for the firm, and the threshold is a Z-score = 2.675. In the following research, Z-score was sometimes used as a variable for prediction (Kirkos and Spathis, 2007; Merkevicius, et al., 2006). The formulation below is a very common model for calculating the Z-score. 5 4 3 2 11.43.30.60.999 2 . 1XXXXX Score Z (1)
In 1980, Ohlson developed a model based on the concept of Logistic Regression to detect company bankruptcies. In his research, 105 failed firms and 2058 healthy firms were selected as the sample during the period 1970 and 1976 in the United States; 9 financial ratios were also chosen in his research. Ohlson’s proposed model improves the disadvantages of making predictions when the value is outside the range 0-1 when using multiple regression for prediction. In this research, the accuracy rate for bankruptcy prediction reaches 84% (Ohlson, 1980).
However, using statistical methods for predicting company financial crises has its own defects. For instance, some statistical methods must use the financial ratios which fulfill the assumption of normal distribution in order to get more accurate predictions. Unfortunately, according to previous research, it is impossible for all of the financial variables to conform to such an assumption. Thus, the modern research direction of financial crisis prediction has changed from statistical methods to artificial intelligence technologies (Min and Lee, 2005).
(b) Artificial Intelligence Technologies:
Comparing the statistical and the artificial intelligence methods that both are used to predict financial crises, the results indicate that artificial intelligence methods are better than statistical methods (Varetto, 1998; Gehrke et al., 1999; Cristiamini and Shawe-Taylor, 2000). Odom and Sharda (1990) and Coats and Fant (1993) adopted the variables of Altman’s Z-score in their models, which both apply the techniques of ANN (Artificial Neural Network)
and Multivariate Analysis. In their models, although the selected samples are different, the results showed that the ANN model performs better than Multivariate Analysis model.
Chaveesuk et al. (1997) proposed an approach by using difference techniques to develop prediction models, which include Back-Propagation Neural Network (BNN), Radial Basis
Function Networks (RBFN), Learning Vector Quantization (LVQ), Multiple Regression (MR) and Logistic Regression (LR) for rating and analyzing public loans in the United States. Their
analysis indicated that the Back-Propagation Neural Network has significantly higher predictive accuracy than other methods.
Hung and Chen (2009) selected the expected probabilities based ensemble method for bankruptcy prediction. In this paper, they combined three different AI techniques including
Decision Trees, Back Propagation Neural Network and Support Vector Machine as multiple
classifiers to predict the firms likely to go bankrupt. Their analysis indicated that their proposed method has better predictive accuracy enhancement than other weighting or voting ensembles.
Min and Lee (2005) applied SVM, Statistical Logistic Regression and Multiple Discriminates Analysis to build their prediction models. Their analysis found that SVM is better than Logistic Regression and Multiple Discriminates Analysis. Furthermore, they also found that the conversion of kernel function in SVM is a crucial factor for prediction, and Poly kernel function is better than other kernel functions.
Huang et al. (2004) were trying to determine the important financial variables in different levels of credit rating and in firms in different countries (the United States and Taiwan) by using the techniques of data mining (SVM and BPNN). Their analysis found that the predictive accuracy of using SVM was higher than for BPNN. They also developed the optimal prediction models of financial variables in the two markets.
In conclusion, the literature shows that financial crisis predictive accuracy from applying artificial intelligence methods is greater than for traditional statistical methods. Furthermore, in recent years, methodologies including the concept of multiple classifiers have become more popular than single classifier methods. However, in practice, many studies show that methods with multiple classifiers have no conspicuous improvement in prediction. Unexpectedly, the prediction methods with SVM techniques have shown better predictive ability than others (Huang et al., 2004; Min and Lee, 2005).
Moreover, in most research into financial crisis prediction, the phases of the business cycle have not been considered as variables or factors to be included in the prediction model. However, the phases of the business cycle have always been considered important for firms and economies, and the kinds of financial crises occurring during different phases of the business cycle should be different (Hung and Chen, 2009).
Taken into account the literature review, this paper develops its research into financial crisis prediction based upon the following principles:
(a) The definition of financial crisis is that used by the Taiwan Economic Journal Data Bank and will be used to select failed or healthy firms (1:1 approach) as samples for empirical analysis.
(b) The Z-Score is an important financial variable and will be included in this paper as one of the financial variables we use.
(c) In regard to variables selection, we will select 57 most common financial ratios according to the suggestions in the literature (Huang et. al, 2004).
(d) In regard to feature selection, the research will use the SVM attribute and PCA as suggested by Tsai (2009), to determine the most suitable feature selection tool.
(e)In this research, three data mining techniques will be used as a single classifier to study whether predictive accuracy varies between these techniques.
(f) The phases of the business cycle will be used as an important factor for data sampling, and we will define the different phases in our proposed approach.
3. The Research Architecture and Research Design
3.1 The research architecture
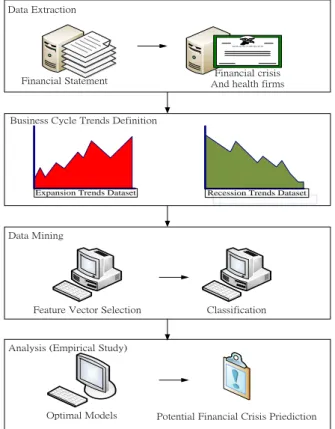
Based on the goal and subject of the research, we would like to develop a financial prediction model which applies the techniques of data mining in conjunction with a consideration of the phases of the business cycle. A research architecture is therefore proposed (see figure 1 below). There are four stages in the research proposal: Data
Extraction, Business Trends Definition, Data Mining and Analysis. The four stages will be
discussed in detail in the following sections. Stages 1, 2 and 3 will be discussed in this section while stage 4 will be discussed in section 4 as an empirical study.
Feature Vector Selection Expansion Trends Dataset
MICROSOFT CORPORATION
Financial crisis And health firms
Recession Trends Dataset
Classification
Potential Financial Crisis Priediction Optimal Models
Data Extraction
Business Cycle Trends Definition
Data Mining
Analysis (Empirical Study) Financial Statement
Figure 1. Research architecture.
3.2 Data Extraction
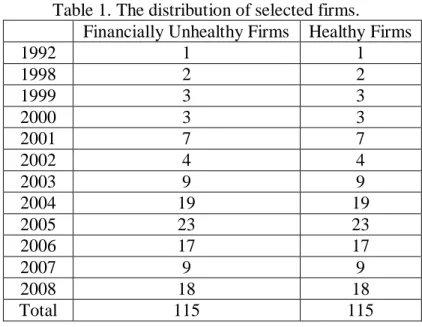
In this research, we have selected 230 firms from the publicly traded market, at a ratio of 1:1 (115 firms with financial difficulties and 115 healthy firms). The selection period is from 1992 to 2008 and all of the selected companies are from the electronics industry. Table 1 shows the distribution of the selected firms.
In the selection of financial variables, we consider the financial characteristics of the electronics industry, and use the z-score along with the TCRI (Taiwan Corporate Credit Risk Index) that include 58 financial ratios. The most important financial ratios among the selected 58 will then be extracted via feature selection methodology. In the empirical study phase, these extracted features will then be used to increase the predictive accuracy of the proposed models.
Table 1. The distribution of selected firms.
Financially Unhealthy Firms Healthy Firms
1992 1 1 1998 2 2 1999 3 3 2000 3 3 2001 7 7 2002 4 4 2003 9 9 2004 19 19 2005 23 23 2006 17 17 2007 9 9 2008 18 18 Total 115 115
3.3 Defining the phases of the business cycle
The business cycle represents the wave of economic activity in a country. Normally, a full business cycle contains four different phases: Peak, trough, expansion and recession. The expansionary phase can be divided into two sub-phases of recovery and prosperity part, and overall it can be defined as the business cycle from the trough to the peak. The recessionary phase also can be divided into two sub-phases of slowdown and recession, and overall it can be defined as the business cycle from peak to trough.
There are two different types of business cycle: The classic cycle and the growth cycle. In Taiwan, the growth cycle normally is used as the business cycle. For business cycle, there is a reference cycle series, the economic indicators in the series include: The real GDP, Industrial
Production Index, real manufacturing sales volume, retail and food services turnover, nonagricultural employment. These indicators can then be used to identify the phases of the
business cycle.
From 1954 to 2010, there have been 11 full business cycles in Taiwan. Presently we can recognize the expansion stage of the 12th business cycle as being from February of 2005 to March 2008, but we do not yet know when the trough and the recession of this business cycle will be. Table 2 lists the different business cycles in Taiwan from 1954 to 2010.
Table 2. The different business cycles in Taiwan.
Cycle Trough Peak Trough
1st Nov. 1954 Nov. 1955 Sep. 1956
2nd Sep. 1956 Sep. 1964 Jan. 1966
3rd Jan. 1966 Aug. 1968 Oct. 1969
4th Oct. 1969 Feb. 1974 Feb. 1975
5th Feb. 1975 Jan. 1980 Feb. 1983
6th Feb. 1983 May 1984 Aug. 1985
7th Aug. 1985 May 1989 Aug. 1990
8th Aug. 1990 Feb. 1995 Mar. 1996
9th Mar. 1996 Dec. 1997 Dec. 1998
10th Dec. 1998 Sep. 2000 Sep. 2001
11th Sep. 2001 Mar. 2004 Feb. 2005
12th Feb. 2005 Mar. 2008 -
3.4 The research design for data dividing approach selection
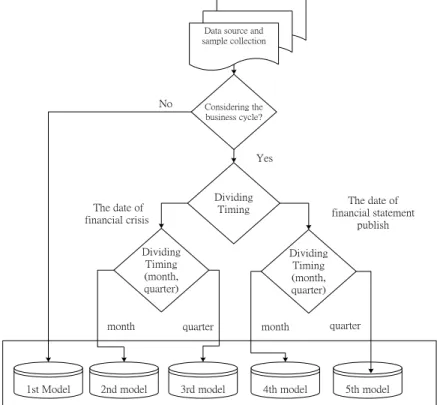
In section 3.3, the phases of the business cycle have been well defined; however, there is still a problem about how to divide data into different datasets in order to assign it to the appropriate business cycle phase. Therefore, in this section, a research design has been proposed in order to test predictive accuracy. Figure 2 shows the research design and process in the paper. Considering the business cycle? Dividing Timing The date of financial crisis Dividing Timing (month, quarter) Dividing Timing (month, quarter) The date of financial statement publish
month quarter month quarter
1st Model
Data source and sample collection
2nd model 3rd model 4th model 5th model
No
Yes
Figure 2. Research design.
Figure 2 shows the five research models, based on the data dividing timing and considering whether there is a financial crisis or not. The five models are:
(a) Model 1: Doesn’t take into consideration the business cycle, examines 115 healthy firms and 115 financially unhealthy firms.
(b) Model 2: Takes into consideration the phases of the business cycle. Samples are divided according to the month and date the financial crisis occurred. There are 138 samples from expansionary phases and 92 samples from recessionary phases.
(c) Model 3: Takes into consideration g the phases of the business cycle. Samples are divided according to the date and quarter of the financial crisis. There are 140 samples from expansionary phases and 90 samples from recessionary phases.
(d) Model 4: Takes into consideration the phases of the business cycle. Samples are divided according to the date of the firms’ monthly financial statements. There are 170 samples from expansionary phases and 60 samples from recessionary phases.
(e) Model 5: Takes into consideration the phases of the business cycle. Samples are divided according to the date of the firms’ quarterly financial statements. There are 166 samples from expansionary phases and 64 samples from recessionary phases.
In next section, the five models will be used as an empirical study for the necessary analysis to determine which model is the most suitable according to its predictive accuracy.
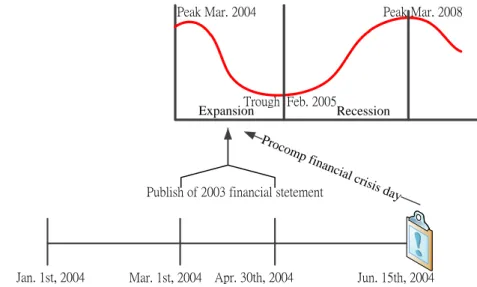
Approaches about how to divide the samples will now be discussed in detail. First, we will discuss how to divide the phases of the business cycle based upon the day the firms’ suffered their financial crisis. For example: Procomp Informatics, a high-tech firm,
unexpectedly announced a company reorganizing on the 15th of June, 2004. This date then has been defined the as the day that its financial crisis occurred. The date is in the period from March 1, 2004 to January 31st, 2005 and it is in the recessionary phase of the business cycle. Thus, Procomp will be placed in the category of a financially unhealthy firm during a recessionary phase. Figure 3 presents the details and the concept of the data dividing approach.
Peak Mar. 2004
Trough Feb. 2005
Peak Mar. 2008
Jan. 1st, 2004 Mar. 1st, 2004 Apr. 30th, 2004 Jun. 15th, 2004 Expansion
Publish of 2003 financial stetement
Proco
mp financi
al crisis day
Recession
Figure 3. Data dividing methods based on the publication date of the financial statement. Chen and Lin (2008) have found that when the publication day of a firm’s financial report is close to the day of its financial crisis, the financial crisis predictive accuracy will be higher. However, in real world, we never know when a financial crisis may happen. Fro m their findings however, we might able to get the same effect when dividing and collecting data based on the publication date of the financial statement to look at financial crisis prediction. Trough Peak Mar. 2008 Expansion Recession Trough Feb. 2005 Recession Expansion Peak Mar. 2004 2004, 2 3 4 (Month) 2005, 1 2 3 (Month) 2008, 2 3 4 (Month)
Figure 4. The data dividing approach based on the month.
Another way to divide data is based on different timing, either by month or by quarter. Figure 4 shows an example of using the month as the data dividing timing. For example, March 2004 is in the peak of the business cycle, and the business cycle was reversed in the next few months until February 2005 when it hit its trough. Therefore, the data has been divided and collected as recessionary samples during the period from March 1, 2004 to January 31, 2005. This approach can also be applied to dividing and collecting data in the expansionary phase of the business cycle.
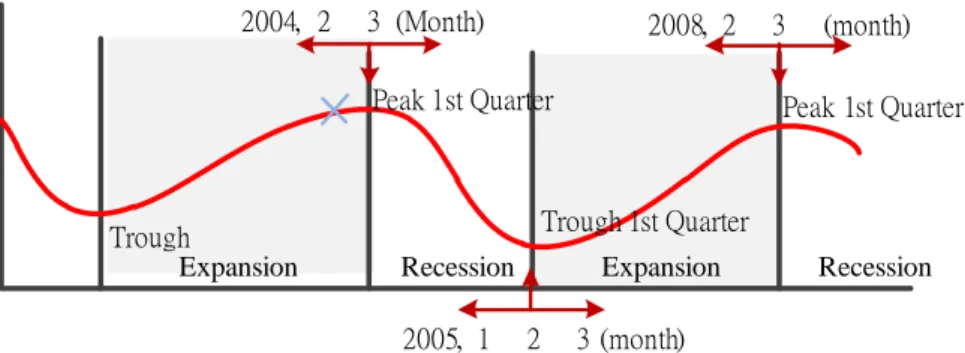
Trough Peak 1st Quarter Expansion Recession Trough 1st Quarter Recession Expansion Peak 1st Quarter 2004, 2 3 (Month) 2005, 1 2 3 (month) 2008, 2 3 (month)
Figure 5. The data dividing approach base on quarters.
Figure 5 shows an example of using the quarter as the data dividing timing. This approach is used when a financial crisis happens or when the publication date of the financial statement was only one or two months before the reversing of the business cycle. For example, we suppose that a company was facing a financial crisis on February 1, 2004. Under this situation, if the data has been divided based on the month, the data will be classified in the expansionary phase of the business cycle. However, as the business cycle was reversed only a few months later it would be better to classify the data into the recessionary phase. Figure 5 shows an example in which the data is divided and collected on a quarterly-basis. 4. Empirical Study and Experiment Result
In order to evaluate the five proposed models designed in section 3, a series o f experiments will be carried out based on data mining techniques (SVM, BPNN and Logistic Regression) for classification and prediction. A k-fold validation will also be performed to evaluate the predictive accuracy. After the validation, we can then find the model with the best results which can then be used for prediction. Furthermore, we can also extract important financial variables affecting the different phases of the business cycle; these variables would be very useful for the investor to predict potential financial crises in particular business cycle phases. Figure 6 shows the process of the experiment.
Feature Selection
Classification
K-fold Cross Validation
Best Result Model Construction for
Prediction
Figure 6. The process of the experiment.
4.1 Feature selection
In this research, Weka has been selected as the software for performing feature selection (Weka, 2010). For feature selection, SVM Attribute (Guyon et al., 2002) and PCA (Principal Component Analysis) are used as the core techniques to simplify the 58 financial variables selected.
The SVM Attribute method uses the SVM classifier to rank the weight after extracting the square root. Thus, the SVM classifier is used to determine the top 5,10,15,20 and 25 of the important financial variables in each proposed model. Another means of feature selection in the research is PCA, which is used to transform the high relevance variables into independent variables which can then used as new variables to represent the entire total of variables. According to the principle proposed by Kaiser, the criterion of PCA is to select the variable with an Eigen value greater than 1 (Kaiser, 1960).
4.2 K-fold cross validation
In this study, the k-fold cross validation approach will be used to evaluate predictive accuracy in the empirical study (Olson and Yang, 2005). We calculate the average accuracy from 2-folds cross validation to 10-folds cross validation. The confusion matrix (table 3) and the formulation for the accuracy rate calculation are shown as below. After the empirical study, we compare the results of the accuracy rate calculations so as to obtain the best prediction model.
Table 3. The confusion matrix.
Predicted
Healthy Company Financial Crisis Actual Healthy Company True Positives (TP) False Negatives (FN)
Financial Crisis False Positives (FP) True Negatives (TN)
FN FP TN TP TN TP Rate Accuracy (2) 4.3 Experiment Results
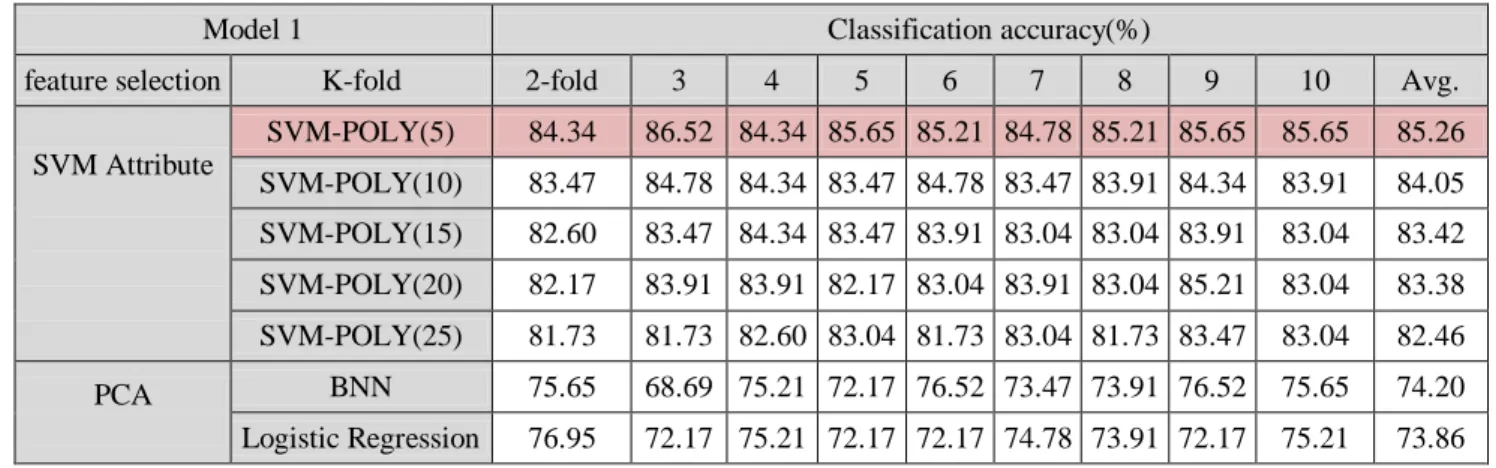
(a) Model 1 – Not taking into consideration the phases of the business cycle
In model 1, 115 healthy firms and 115 financially unhealthy firms are sampled without considering the phases of the business cycle. For comparing and analyzing the performance of each classifier, the best model is using 5 financial ratios by SVM and the Poly Kernel is Sequential Minimum Optimization. The analysis is shown in table 3, and it indicates that an average accuracy rate of 85.26%, which is better than BPNN and LR.
Table 4. The experimental results of model 1.
Model 1 Classification accuracy(%)
feature selection K-fold 2-fold 3 4 5 6 7 8 9 10 Avg.
SVM Attribute SVM-POLY(5) 84.34 86.52 84.34 85.65 85.21 84.78 85.21 85.65 85.65 85.26 SVM-POLY(10) 83.47 84.78 84.34 83.47 84.78 83.47 83.91 84.34 83.91 84.05 SVM-POLY(15) 82.60 83.47 84.34 83.47 83.91 83.04 83.04 83.91 83.04 83.42 SVM-POLY(20) 82.17 83.91 83.91 82.17 83.04 83.91 83.04 85.21 83.04 83.38 SVM-POLY(25) 81.73 81.73 82.60 83.04 81.73 83.04 81.73 83.47 83.04 82.46 PCA BNN 75.65 68.69 75.21 72.17 76.52 73.47 73.91 76.52 75.65 74.20 Logistic Regression 76.95 72.17 75.21 72.17 72.17 74.78 73.91 72.17 75.21 73.86 PCA=Principal Components Analysis
(b) Model 2 – Takes into consideration the phases of the business cycle: Dividing data according to the date the financial crisis occurred by month
In model 2, the phases of the business cycle, whether expansionary or recessionary, are taken into consideration. From the data dividing, there are 138 firms belonging to the expansionary phase and another 92 firms belonging to the recessionary phase. The experimental results are shown in table 4 and the accuracy of the SVM (15 variables) achieves 87.84%, which is better than BPNN and LR in the expansionary phase. On the other hand, in the recessionary phase, the accuracy of SVM (5 variables) is also the highest, at 83.81%.
Table 5. The experimental results of model 2.
Model 2-expansionary phase Classification accuracy (%)
Feature Selection k-fold 2-fold 3 4 5 6 7 8 9 10 Avg.
SVM Attribute SVM-POLY(15) 84.78 87.68 89.85 86.23 89.13 88.40 88.40 89.85 86.23 87.84
PCA BNN 65.94 73.18 71.01 74.63 76.08 74.63 76.08 76.81 76.81 73.91
Logistic Regression 65.21 71.73 71.01 69.56 70.28 71.01 73.18 73.18 71.73 70.77 Model 2-recessionary phase
Feature Selection k-fold 2-fold 3 4 5 6 7 8 9 10 Avg.
SVM Attribute SVM-POLY(5) 80.43 82.60 84.78 84.78 84.78 85.86 83.69 82.60 84.78 83.81
PCA BNN 81.52 79.34 81.52 78.26 78.26 79.34 80.43 79.34 77.17 79.46
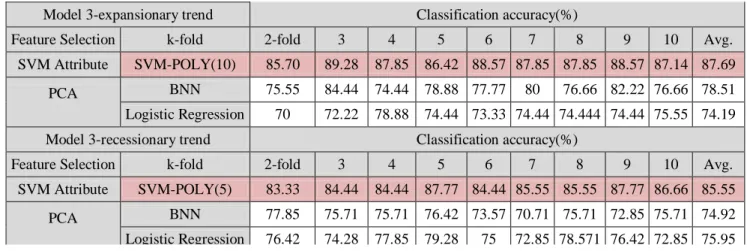
Logistic Regression 81.52 72.82 77.17 79.34 80.43 67.39 75 78.26 79.34 76.81 (c) Model 3- Takes into consideration the phase of the business cycle: Dividing data according to the date the financial crisis occurred, by quarter
Table 5 shows the analysis and results from model 3. After dividing the data, there are 138 and 92 firms in the expansionary and recessionary phases respectively. The empirical results have demonstrated that the accuracy of SVM (10 variables) achieves 87.69% which is better than BPNN and LR in the expansionary phase. In recessionary phase, the accuracy of SVM (5 variables) is 85.55%. Comparing the three models, model 3 has the highest accuracy rate than other the models in the recessionary phase.
Table 6. The experimental results of model 3.
(d) Model 4- Takes into consideration the business cycle: sample divided according to month the financial report is published
Model 3-expansionary trend Classification accuracy(%)
Feature Selection k-fold 2-fold 3 4 5 6 7 8 9 10 Avg.
SVM Attribute SVM-POLY(10) 85.70 89.28 87.85 86.42 88.57 87.85 87.85 88.57 87.14 87.69
PCA BNN 75.55 84.44 74.44 78.88 77.77 80 76.66 82.22 76.66 78.51
Logistic Regression 70 72.22 78.88 74.44 73.33 74.44 74.444 74.44 75.55 74.19
Model 3-recessionary trend Classification accuracy(%)
Feature Selection k-fold 2-fold 3 4 5 6 7 8 9 10 Avg.
SVM Attribute SVM-POLY(5) 83.33 84.44 84.44 87.77 84.44 85.55 85.55 87.77 86.66 85.55
PCA BNN 77.85 75.71 75.71 76.42 73.57 70.71 75.71 72.85 75.71 74.92
Table 6 shows the experimental results of model 4. After dividing the data, there are 170 and 60 firms for expansionary and recessionary phases respectively. The empirical results have demonstrated that the highest accuracy of SVM (20 variables) is 82.15% in the expansionary phase and the average prediction ability of SVM (5 variables) is 88.33% in the recessionary phase.
Table 7. The experimental results of model 4.
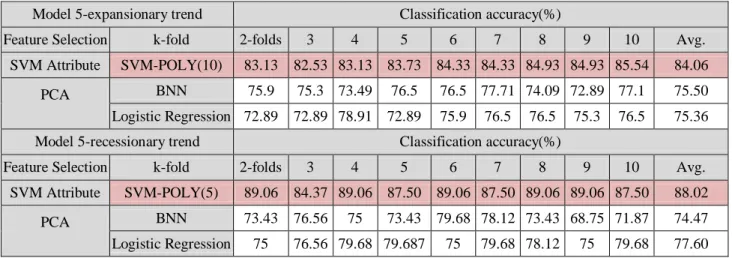
(e) Design model 5- Takes into consideration the business cycle: sample divided according to quarter the financial report is published date
Table 4-25 show the data when we consider the business cycle factor, the samples are divided according to the month the financial report is published.
We have 166 and 64 firms for the expansionary and recessionary phases respectively. Empirical results have demonstrated that the accuracy of SVM is 88.02% in the recessionary phase, and in expansionary phase, the forecast ability of SVM is better than the others, with an average of 84.06%.
Table 8. The experimental results of model 5.
4.4 Discussion and Findings
(a) Overall, the predictive accuracy from using SVM for classification is better than for BNN and LR. Without considering the phases of the business cycle, the accuracy rate is 85.26%, using the 5 variables selected by SVM Attribute. In model 3 (dividing the data based on quarterly and financial crisis date), the accuracy rate is 85.55% in the expansionary
Model 4-expansion trend Classification accuracy(%)
Feature Selection k-fold 2-fold 3 4 5 6 7 8 9 10 Avg.
SVM Attribute SVM-POLY(20) 80.58 82.35 82.94 81.17 82.94 82.35 82.35 82.35 82.35 82.15
PCA BNN 76.47 74.11 75.29 74.11 71.76 78.82 77.64 75.88 79.41 75.94
Logistic
Regression 72.35 78.82 77.64 72.94 77.05 76.47 77.05 75.88 76.47 76.07
Model 4-recessionary trend Classification accuracy(%)
Feature Selection k-fold 2-fold 3 4 5 6 7 8 9 10 Avg.
SVM Attribute SVM-POLY(5) 86.66 88.33 88.33 88.33 90.00 88.33 88.33 88.33 88.33 88.33
PCA BNN 61.66 56.66 65 61.66 63.33 55 60 56.66 61.66 60.18
Logistic
Regression 60 61.66 66.66 61.66 63.33 63.33 65 58.33 66.66 62.96
Model 5-expansionary trend Classification accuracy(%)
Feature Selection k-fold 2-folds 3 4 5 6 7 8 9 10 Avg.
SVM Attribute SVM-POLY(10) 83.13 82.53 83.13 83.73 84.33 84.33 84.93 84.93 85.54 84.06
PCA BNN 75.9 75.3 73.49 76.5 76.5 77.71 74.09 72.89 77.1 75.50
Logistic Regression 72.89 72.89 78.91 72.89 75.9 76.5 76.5 75.3 76.5 75.36
Model 5-recessionary trend Classification accuracy(%)
Feature Selection k-fold 2-folds 3 4 5 6 7 8 9 10 Avg.
SVM Attribute SVM-POLY(5) 89.06 84.37 89.06 87.50 89.06 87.50 89.06 89.06 87.50 88.02
PCA BNN 73.43 76.56 75 73.43 79.68 78.12 73.43 68.75 71.87 74.47
phase and 87.69% in the recessionary phase, which is better than the model that does not take into consideration the phases of the business cycle.
(b) In order to increase the predictive accuracy, we not only must consider the phases of the business cycle but also the approach for data dividing.
(c) From the empirical study, in the expansionary phase, the predictive ability is higher when dividing the data according to the date the financial crisis occurred. In contrast, in the recessionary phase the predictive ability is higher when dividing the data according to the date of the publication of the firms’ financial statements.
(d) In model 3 when comparing the selected variables in the expansionary and recessionary phases, we find that the selected variables are significantly different.
(i) In the expansionary phase: The selected financial ratios include three major indices: debt-payment ability, earning power, Growth Rate, along with other indices (see table 8 for details of the variables). In this situation the influence of the financial crisis is wider under the phases of business cycle. Thus, we must consider more financial ratios than in the recessionary phase.
(ii) In the recessionary phase: Only five financial ratios have been selected and most of them belong to the index of debt-paying ability. From the selected financial ratios, we found that the reasons behind a financial crisis are simpler than in those in the expansion phase. Most of the companies were facing a financial crisis due to high debt-paying pressure (see table 8 for details of the variables).
Table 8. The selected financial variables in different phases of the business cycle. Model 1 Model 3-Recessionary phase Model 3-expansionary phase Taiwan Corporate Credit Risk
Index
Taiwan Corporate Credit Risk
Index Net Worth /Total Assets
Debt Ratio Debt Ratio Net Worth per share
Pre-Tax Income /Capital Pre-Tax Income /Capital Cash Dividends Ratio
Cash Dividends Ratio Earnings per share Debt Ratio
Net Worth Growth Rate gross margin growth rate Taiwan Corporate Credit Risk Index
Accumulated Depreciation Growth Rate Receivables turnover rate
Pre-Tax Income /Capital Operating margin ratio
Sales Growth Rate 5. Conclusion
The operative hypothesis of this research was that financial crises for companies are different under different phases of the business cycle. Therefore, if the important financial ratios when a financial crisis occurs can be discovered, predictive accuracy can therefore be improved. These variables are also helpful for companies to review their financial situation under different phases of the business cycle.
In the paper, we have defined the phases of expansion and recession and four different data dividing methodologies have also been designed. Furthermore, we also discuss the results we found when not considering the phases of the business cycle. From the empirical study, the SVM with polynomial kernel feature selection can increase the predictive accuracy significantly and with an accuracy rate better than for BNN and LR.
The empirical study shows that model three is the model with the best predictive ability. The model uses the date the financial crisis occurred and is quarterly based. Through applying the method SVM Attribute for feature selection, 5 important financial ratios have been selected for the expansionary phase and 10 important financial ratios have been selected for the recessionary phase. In the study, the predictive accuracy for the expansionary and recessionary phases are 85.55% and 87.69% respectively, which are better than the accuracy rate when not considering the phases of business cycle. The research results show that the proposed approach for financial crisis prediction can improve the predictive ability.
In this research, only companies in the electronics industry were selected. Future research may do well to focus on different industries. Moreover, the financial crisis prediction can ideally be improved, if the quarterly or semi-yearly financial statements can be used as the dataset for prediction. However, we only considered the yearly financial statements in this research. Future researchers are strongly urged to try to obtain the wider dataset for prediction.
References
Altman, E. (1968) Financial ratios, discriminant analysis and the prediction of corporate bankruptcy, The Journal of Finance, 23(4), 589-609.
Beaver, W. H. (1966) Financial ratios as predictors of failures. Journal of Accounting Research, 4(Supplement), 71-102.
Chaveesuk, R., Srivaree-Ratana, C., Smith, A. (1997) Alternative Neural Network Approach to Corporate Bond Rating. Journal of Engineering Valuation and Cost Analysis, 2(2), 117-131.
Coats, P. K., Fant, L. F. (1993) Recognizing financial distress patterns using a neural network tool. Financial Management, 22(3), 142-155.
Cristiamini, N., Shawe-Taylor, J. (2000) An Introduction to Support Vector Machines. Cambridge university press, Cambridge, England.
Deakin, E.B. (1972) A discriminant analysis of predictors of business failure. Journal of Accounting Research, 10(1), 167-179.
Gehrke, J., Ramakrishnan, R., Loh, W. Y. (1999) BOAT-optimistic decision tree construction. In proceedings of International Conference Management of Data, Philadelphia, 169–180.
Guyon, I., Weston, J., Barnhill, S., Vapnik, V. (2002) Gene selection for cancer classification using support vector machines. Machine Learning, 46(1-3), 389-422.
Huang, Z., Chen, H., Hsu, J., Chen, W. H., Wu, S. (2004) Credit rating analysis with support vector machines and neural networks: a market comparative study. Decision Support Systems, 37(4), 543-558.
Hung, C., Chen, J. (2009) A selective ensemble based on expected probabilities for bankruptcy prediction. Expert Systems with Applications, 36(3), 5297-5303.
Kaiser, H. F. (1960) The application of electronic computers to factor analysis. Educational and Psychological Measurement, 20(1), 141-151.
Kirkos, E., Spathis, C., Manolopoulos, Y. (2007) Data Mining Techniques for the Detection of Fraudulent Financial Statements. Expert Systems with Applications, 32(4), 995-1003. Merkevičius, E., Garšva, G., Girdzijauskas, S. (2006) A Hybrid SOM-Altman Model for
Bankruptcy Prediction. Lecture Notes in Computer Science, 3994, Berlin / Heidelberg: Springer, 364-371.
Min, J.H., Lee, Y.C. (2005) Bankruptcy prediction using support vector machine with optimal choice of kernel function parameters. Expert Systems with Applications, 28(4), 603-614.
Odom, M., Sharda, R. (1990) A neural network model for bankruptcy prediction. In Proceedings of 1990 IJCNN international joint conference, San Diego, CA, USA, 163-168.
Ohlson, J. (1980) Financial ratios and the probabilistic prediction of bankruptcy, Journal of Accounting Research, 18(1), 109-131.
Olson, D. L., Yang, S. (2005) Introduction to Business Data Mining, Boston, Mass., McGraw-Hill.
Orgler, Y. E. (1970) A Credit Scoring Model for Commercial Loans. Journal of Money, Credit, and Banking, 2(4), 435-445.
Tsai, C. (2009) Feature selection in bankruptcy prediction. European Journal of Operational Research, 22(2), 120-127.
Varetto, F.(1998) Genetic algorithms applications in the analysis of insolvency risk. Journal of Banking & Finance, 22(10-11), 1421-1439.
Werbos, P. J. (1974) Beyond Regression: New Tools for Prediction and Analysis in the Behavioral Science. Ph.D. Thesis, Harvard University, Cambridge.
Weka. (2010) Data Mining with Open Source Machine Learning Software in Java, http://www.cs.waikato.ac.nz/ml/weka, access available: August 1, 2010