J Cancer Sci Ther Volume 1(1) : 041-046 (2009) - 041 ISSN:1948-5956 JCST, an open access journal
Research Article OPEN ACCESS Freely available online doi:10.4172/1948-5956.1000007
*Corresponding author: Tsair-Fwu Lee, Ph.D., National Kaohsiung
University of Applied Sciences, Kaohsiung, Taiwan, ROC, Tel: 886-7-3814526; Fax: 886-7-3811182; E-mail: 1097404101@cc.kuas.edu.tw, tflee@cc.kuas.edu.tw.tw
Received October 22, 2009; Accepted November 29, 2009; Pub-lished November 29, 2009
Citation: Wang CY, Lee TF, Fang CH (2009) 3D Volumetric
Visualiza-tion with Automatic Rigid and Deformable Hybrid Image RegistraVisualiza-tion for Adaptive Radiotherapy. J Cancer Sci Ther 1: 041-046. doi:10.4172/1948-5956.1000007
Copyright: © 2009 Wang CY, et al. This is an open-access article
distributed under the terms of the Creative Commons Attribution Li-cense, which permits unrestricted use, distribution, and reproduction in any medium, provided the original author and source are credited.
Abstract
To provide more clinically convenient image fusions for adaptive radiotherapy (ART), an automatic rigid and de-formable image registration framework (AIRF) is devel-oped for multimodal visualization of multiple chronological images and multiple radiotherapy (RT) plans. Our hybrid image registration framework, AIRF, uses a faster but less accurate rigid registration method to provide an initial reg-istration, followed by a slower but more accurate deform-able registration method to fine tune the final registration. A multi-resolution approach is also employed in the image registration process to further improve the registration ac-curacy, robustness and efficiency. Volume visualization is provided to guide the automatic image registration process because it can reduce the global positioning error that re-sults from a partial 3D visual presentation in the three con-ventional orthogonal planar views (axial, sagittal, and coro-nal). The AIRF can automatically align multiple volumet-ric images of patients taken over an extended period of time and can merge multiple radiotherapy plans based on different planning computed tomography (CT) images. It offers illustrative 3D volumetric visualization, hybrid rigid and deformable image registration, and automatic transfer of RT dose distribution and RT structure models such as treatment targets and organs at risk (OARs) onto chrono-logical images. The AIRF can automatically register mul-tiple volumetric image datasets of patients taken over an extended period of time and can merge multiple RT plans based on different planning CT images for 4D or adaptive radiotherapy.
3D Volumetric Visualization with Automatic Rigid
and Deformable Hybrid Image Registration
for Adaptive Radiotherapy
Chang-Yu Wang1,2, Tsair-Fwu Lee 1,2*, Chun-Hsiung Fang1
1National Kaohsiung University of Applied Sciences, Kaohsiung, Taiwan, ROC 2Department of Radiation Oncology, Chang Gung Memorial Hospital-Kaohsiung Medical Center,
Chang Gung University College of Medicine, Kaohsiung, Taiwan
Journal of Cancer Science & Therapy
-
Open Access
www.omicsonline.org JCST/Vol.1 Issue 1
Keywords: Volumetric visualization; Deformable; Automatic
image registration; Adaptive radiotherapy
Introduction
Adaptive radiotherapy (ART) is a feedback treatment process that optimizes a patient’s treatment according to patient-specific information measured during the course of treatment. It is be-cause the location and orientation of the target volume can vary during a single treatment session due to normal biological pro-cesses, such as breathing or bowel peristalsis that it may result in treatment inaccuracy. (Han-Oh et al., 2009). ART intends to improve radiation treatment by systematically monitoring ment variations and incorporating them to re-optimize the treat-ment plan early on in the course of treattreat-ment (Yan et al., 1997).
However, the introduction of adaptive image-guided radiotherapy has contributed to a rapid accumulation of multi-modality imag-ing and radiotherapy plannimag-ing data, makimag-ing it difficult to con-solidate information on a single patient (Verellen et al., 2008).
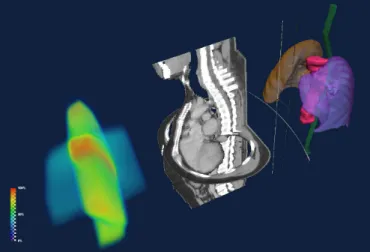
Radiotherapy planning data are a stack of image slices with segmentation data stored on a slice-by-slice basis. The segmen-tation data would consist of closed contours drawn around or-gans at risk (OARs) and target volumes. Each contour has a special tag identifying which structure it belongs to. Thus, the patient’s anatomy information is stored in a file in the form of RT structure sets containing segmentation data which are also as-sociated with the reference CT images (Ebert et al., 2004). The calculated RT dose distribution is another three-dimensional (3D) volume matrix co-registered with the associated CT image vol-ume. Values in the RT dose matrix represent the dose delivered to tissue in the corresponding area in the CT image volume. In summary, a radiotherapy plan is the fusion of at least three volu-metric data including RT dose, CT images and RT structure mod-els (Figure 1).
There have been many kinds of volume visualization software for medical imaging which provide fantastic image processing and regions-of-interest (ROI) delineation functions to handle diagnostic images, such as from CT, MRI or PET. There are still many challenges in merging multiple radiotherapy plans by im-age registration. So far, most imim-age fusion or contouring soft-ware cannot handle RT dose data. Proprietary radiotherapy treat-ment planning systems (TPS) can display RT dose and RT struc-ture sets superimposed on fused images, but the fixed image for image registration in TPS is strictly limited to planning CT. More-over, in TPS, RT dose or RT structure sets cannot be transformed and warped into later follow-up images.
In order to merge multiple radiotherapy plans based on differ-ent CT planning scans, an automatic rigid and deformable image registration framework (AIRF) is proposed and implemented for
J Cancer Sci Ther Volume 1(1) : 041-046 (2009) - 042 ISSN:1948-5956 JCST, an open access journal
Citation: Wang CY, Lee TF, Fang CH (2009) 3D Volumetric Visualization with Automatic Rigid and Deformable Hybrid Image
Registra-tion for Adaptive Radiotherapy. J Cancer Sci Ther 1: 041-046. doi:10.4172/1948-5956.1000007
volume visualization of radiotherapy plans, fused with longitu-dinal images or later radiotherapy plans. Aspects that require further development are identified and solutions to overcome limitations are examined.
Related Work
RT_Image, coded in the Interactive Data Language (IDL, ITT Visual Information Solutions), allows multiple imaging datasets and associated three-dimensional (3D) ROIs to be displayed at arbitrary viewing angles and fields of view. It also includes semi-automated image segmentation tools for defining metabolically-active tumor volumes that can help define target volumes for treatment planning (Graves et al., 2007).
CERR, based on the Matlab language (Mathworks Inc), pro-vides a platform for the visualization and analysis of radiotherapy plans from a wide variety of commercial treatment planning sys-tems (Deasy et al., 2003). It can support various types of re-search studies, including dose-volume analyses and radiotherapy planning comparisons.
These two software programs have helped significantly with the analysis and comparison of radiotherapy plans. However, slow speed is a major drawback due to the intrinsic limitation of a high-level computer language such as IDL or Matlab. As a result, the ability to render image volumes quickly and to display images fused from multiple volumetric image datasets together with RT dose and RT structure overlay is still lacking.
Design Overview
Retrieval of radiotherapy planning data
The CT image volume for radiotherapy planning is recon-structed from stacked DICOM CT slices. Raw data for radio-therapy planning such as RT dose data and ROI contours for treatment targets and organs at risk (OARs), together with the associated planning CT images, are exported from the Pinnacle TPS (Philips Medical) and then imported into our image registra-tion framework for further processing.
Mesh generation from 2D contours
ROI contour sets are contoured by a physician or technician manually in a slice-by-slice manner on the transversal view of
the planning CT image. Modern radiotherapy TPSs allow the user to grow a ROI by a specified 3D margin to simplify the process of manual segmentation (Pooler et al., 2008). Physicians can obtain a planning target volume (PTV) from a gross tumor volume (GTV) and a clinical target volume (CTV) where the user can specify the required margins in each of the six directions (right, left, anterior, posterior, superior and inferior). Therefore, the RT structures often overlap each other, and one voxel may represent more than one RT structure at the same time. Conven-tional label map technique of applying a single label to a voxel cannot be employed to represent the result of image segmenta-tion in a RT scenario because a voxel may have two or more label indices.
3D surface models are necessary for volume rendering of treat-ment targets and OARs. Two common approaches are frequently used to generate a surface from sets of contour slices for each RT structure. One approach is to connect polygon contours be-tween adjacent planes. Accuracy issues can arise from the con-nection algorithm and from contour or surface simplification methods. The second approach is to fill the polygon contours, stack these binary mask images to form a volume, and then to create an isosurface. Generally speaking, there is less interpola-tion in the second approach, and we use the latter approach to generate the surface mesh models from ROI contours for each RT structure.
Rigid and deformable image registration
An N-dimensional affine transformation is an (N+1)-dimen-sional linear transformation. Any affine transformation between 3D spaces can be represented by a 4 x 4 matrix. Hence, the set of transformation parameters can reduce to six for a rigid body reg-istration: three parameters defining translation along the x, y, and z axes in millimeters; and three parameters defining rotation around the x, y, and z axes and representing Euler angles in radi-ans. Thus, the aim of image registration is to find the translation matrix and the rotation matrices. Since the rotations around the three coordinate axes are not commutative, we define their order as rotation about the x, y, and then z-axis.
In fact, a 4 x 4 matrix can represent all types of affine transfor-mation including translation, rotation around the origin, reflec-tion, glide, scale, and shear. However, we use rotation and trans-lation only for rigid-body registration in our framework. Multiple transformation matrices can be concatenated into a single matrix by multiplying them together, in the order in which they occur. To combine subsequent transformations we can easily multiply these 4 x 4 matrices together. The resulting affine transformation matrix which is the concatenation of multiple cascade transfor-mations can then be applied to perform global warping between pairs of longitudinal image data or radiotherapy planning data. Accordingly, the transformed doses are added to obtain a spa-tially varying 3D cumulative dose.
This hybrid image registration framework uses a faster but less accurate rigid registration method to achieve an initial regis-tration, followed by a slower but more accurate deformable reg-istration method to fine tune the final regreg-istration. Deformable image registration is performed based on Demons algorithm (Guimond et al., 2001) to compensate for the change of external body contours and normal organ motion. A multi-resolution
ap-Figure 1: The volumetric visualization of a typical radiotherapy treat-ment plan consists of three volumetric datasets including, from left to right: RT dose, CT images and RT structure models.
J Cancer Sci Ther Volume 1(1) : 041-046 (2009) - 046 ISSN:1948-5956 JCST, an open access journal
References
1 . Deasy JO, Blanco AI, Clark VH (2003) CERR: a computational envi-ronment for radiotherapy research. Med Phys 30: 979-985. » CrossRef
» PubMed » Google Scholar
2 . Ebert MA, Blight J, Price S, Haworth A, Hamilton C, et al. (2004) Multicentre analysis of treatment planning information: technical requirements, possible applications and a proposal. Australas Radiol 48: 347-352. » CrossRef » PubMed » Google Scholar
3 . Graves EE, Quon A, Loo BW Jr (2007) RT_Image: an open-source tool for investigating PET in radiation oncology. Technol Cancer Res Treat 6: 111-121. » CrossRef » PubMed » Google Scholar
4 . Guimond A, Roche A, Ayache N, Meunier J (2001) Three-dimensional multimodal brain warping using the demons algorithm and adaptive intensity corrections. IEEE Trans Med Imaging 20: 58-69. » CrossRef
» PubMed » Google Scholar
5 . Han-Oh S, Yi BY, Berman BL, Lerma F, Yu C (2009) Usefulness of guided breathing for dose rate-regulated tracking. Int J Radiat Oncol Biol Phys 73: 594-600. » CrossRef » PubMed » Google Scholar
6 . Ib´a˜nez L, Schroeder W, Ng L, Cates J (2005) The ITK Software Guide. Kitware Inc.
Citation: Wang CY, Lee TF, Fang CH (2009) 3D Volumetric Visualization with Automatic Rigid and Deformable Hybrid Image
Registra-tion for Adaptive Radiotherapy. J Cancer Sci Ther 1: 041-046. doi:10.4172/1948-5956.1000007
7 . Li G, Xie H, Ning H, Capala J, Arora B, et al. (2005) A novel 3D volumetric voxel registration technique for volume-view-guided im-age registration of multiple imaging modalities. Int J Radiat Oncol Biol Phys 63: 261-273. » CrossRef » PubMed » Google Scholar
8 . Parkin DM, Bray F, Ferlay J, Pisani P (2005) Global cancer statistics, 2002. CA Cancer J Clin 55: 74-108. » CrossRef » PubMed » Google Scholar 9 . Patel D, Muren LP, Mehus A, Kvinnsland Y, Ulvang DM, et al. (2007)
A virtual reality solution for evaluation of radiotherapy plans. Radiother Oncol 82: 218-221. » CrossRef » PubMed » Google Scholar
10 . Pooler AM, Mayles HM, Naismith OF, Sage JP, Dearnaley DP (2008) Evaluation of margining algorithms in commercial treatment plan-ning systems. Radiother Oncol 86: 43-47. » CrossRef » PubMed » Google Scholar
11 . Schroeder W, Martin K, Lorensen B (2006) The Visualization Toolkit An Object-Oriented Approach To 3D Graphics. Kitware Inc. 12 . Verellen D, De Ridder M, Storme G (2008). A (short) history of
image-guided radiotherapy. Radiother Oncol 86: 4-13. » Cro ssRef » Pub Med
» Google Scholar
13 . Yan D, Vicini F, Wong J, Martinez A (1997) Adaptive radiation therapy. Phys Med Biol 42: 123-132. » CrossRef » PubMed » Google Scholar