Contents lists available atScienceDirect
Journal of Chromatography A
j o u r n a l h o m e p a g e : w w w . e l s e v i e r . c o m / l o c a t e / c h r o m aA novel derivatization approach for simultaneous determination
of glyoxal, methylglyoxal, and 3-deoxyglucosone in plasma by gas
chromatography–mass spectrometry
Meng-Yan Wu
a,1, Bud-Gen Chen
a,1, Chiung Dan Chang
b, Mei-Han Huang
a,
Tai-Guang Wu
c, Daw-Ming Chang
d, Yau-Jiunn Lee
e, Hsiang Ching Wang
a,
Chu-I Lee
a, Chi-Liang Chern
a,∗, Ray H. Liu
a,∗aDepartment of Medical Technology, Fooyin University, 151 Ching-Hsueh Road, Ta-Liao Hsiang,
Kaohsiung Hsien 831-02, Taiwan
bLaboratory Department, Yang Ming Hospital, 580 Sinmin Road, Chiayi City, Taiwan cGeneral Life Biotechnology Co., Ltd., 50 Jung Jeng Road, Shin Juang, Taipei Hsien, Taiwan dPingtung Christian Hospital, 60 Ta-Lian Road, Pingtung City, Taiwan
eLee’s Endocrinologic Clinic, 130 Min-Tzu Road, Pingtung City, Taiwan
a r t i c l e i n f o
Article history:
Received 7 April 2008
Received in revised form 7 July 2008 Accepted 16 July 2008
Available online 19 July 2008
Keywords:
Derivatization GC–MS
Advanced glycation product Glyoxal
Methylglyoxal 3-Deoxyglucosone
a b s t r a c t
A two-step derivatization approach has been developed to enable the simultaneous analysis of glyoxal, methylglyoxal, and 3-deoxyglucosone by the most efficient and widely applied GC–MS methodology. These three analytes are reactive carbonyl compounds associated with the formation of advanced glyca-tion and lipoxidaglyca-tion end products, a process thought to contribute to uremic toxicity and referred to as “carbonyl stress”. Effective analysis of these compounds would facilitate understanding these compounds’ role in diabetes-related complications. Plasma samples were deproteinized by acetonitrile, followed by a two-step derivatization approach. Pooled plasma samples from healthy individuals were used as the “blank” for preparing calibration standards. The concentrations of the analytes in the “blank” were first determined by standard addition method. Calibration parameters were accordingly established and used to analyze these compounds in plasma samples collected from healthy individuals and diabetic patients. Analytical findings are comparable with those reported in the literature. Quantitation data can be further improved by making available and using isotopically labeled analogs of these analytes as the internal standards.
© 2008 Elsevier B.V. All rights reserved.
1. Introduction
Glyoxal (G, CAS 107-22-2), methylglyoxal (MG, CAS 78-98-8), and 3-deoxyglucosone (3-DG, CAS 4084-27-9) are formed by the degradation of glycated proteins, glycolytic intermediates and lipid peroxidation. They react with protein and lipid to form advanced glycation endproducts (AGEs) and advanced lipoxidation end prod-ucts (ALEs)[1]. This phenomenon was considered a contributor to uremic toxicity and referred to as “carbonyl stress” [2]. In a 2005 review, Lapolla et al. commented that “measurement of the products of non-enzymatic glycation has a twofold meaning: . . . estimate the extent of exposure to glucose and the subject’s
previ-∗ Corresponding authors. Tel.: +886 7 781 1151x6210; fax: +886 7 782 6172.
E-mail addresses:mt115@mail.fy.edu.tw(C.-L. Chern),
rayliu@uab.edu,mt124@mail.fy.edu.tw(R.H. Liu). 1 These authors contributed equally to this work.
ous metabolic control; . . . is a precious instrument in verifying the relationship between glycation products and tissue modifications” [3].
We have conducted a thorough literature review and noted that most studies on the analysis of G, MG, and 3-DG were based on liquid chromatography (LC). While gas chromatography–mass spectrometry (GC–MS) is now a low-cost instrumentation with high specificity and widely available in clinical laboratories, reports on the application of this technology to the analysis of these highly polar analytes have been rare, and, to the best of our knowledge,
none has addressed the simultaneous determination of all three ana-lytes. With very substantial experience in the utilization of chemical derivatizations to facilitate drug analysis[4–7], we have evaluated various approaches for plasma deproteinization/extraction, analyte derivatization, and quantitation. Accordingly, an effective GC–MS-based method, incorporating a two-step derivatization approach, was developed for the simultaneous determination of these three analytes. Hopefully, this effective analytical method would facil-0021-9673/$ – see front matter © 2008 Elsevier B.V. All rights reserved.
itate laboratory analysis of these compounds, thereby advancing understanding the roles of these compounds in diabetes related complications.
2. Experimental
2.1. Standards, reagents, and study samples
The sources of analytes and IS (internal standard) are G (563.6 mg/ml), MG (478 mg/ml), and o-chlorobenzaldehyde (1250 mg/ml): Fluka (Buchs, Switzerland); 3-DG (10 mg/ml): Dojindo Laboratories (Kumamoto, Japan); and 2,3-pentanedione: Sigma–Aldrich (Milwaukee, WI). Derivatizing reagents O-(2,3,4,5,6-pentafluorobenzyl) hydroxylamine (PFBOA),
N-methyl-N-trimethylsilyl-trifluoroacetamide (MSTFA), and 2,3-dimethyl-6,7-dimethoxyquinoxaline (2,3-DAN) were purchased from Fluka, Pierce (Rockford, IL), and Sigma (St. Louis, MO), respectively. Proteinase K, acetonitrile, ether, ethyl acetate, hexane, and sodium dodecyl sulfate were obtained from Sigma–Aldrich Fine Chemicals (St. Louis, MO), while sodium chloride was from FSA Laboratory (Loughborugh, England). Chemicals and solvents were analytical or HPLC grades.
All plasma samples were obtained from the Division of Inter-nal Medicine, Pingtung Christian Hospital, Taiwan, following the institution’s IRB protocols.
2.2. Preparation of standard solutions
Methylglyoxal concentrated stock solution, 1 mg/ml: add 5 !l of MG (478 mg/ml) to a 10-ml vial and bring volume to 2390 !l with deionized water and mix well; G concentrated stock solu-tion, 1 mg/ml: add 5 !l of G (563.6 mg/ml) to a 10-ml vial and bring volume to 2818 !l with deionized water and mix well; 3-DG concentrated stock solution, 1 mg/ml: add 1 ml of 3-DG (20 mg/ml) to a 20-ml volumetric flask and bring volume to 10 ml with deionized water and mix well; o-chlorobenzaldehyde concen-trated stock solution, 100 mg/ml: add 8 ml of o-chlorobenzaldehyde (1250 mg/ml) to a 200-ml volumetric flask and bring volume to 100 ml with ether and mix well.
2.3. Deproteinization, derivatization, and extraction of plasma sample
To a 1.5 ml micro-tube with 500 !l plasma containing the three analytes of interest, add 5 !l 0.1% SDS and 10 !l 20 mg/ml pro-teinase K and incubate overnight. Add 500 !l acetonitrile, mix thoroughly, and centrifuge at 12,000 rpm. Isolate the organic phase (900 !l), add 4.6 ml HCl (pH 3) and 50 !l 25 mg/ml PFBOA (for the first derivatization), mix and incubate for 2 h at 50◦C in a heating
block. Add 0.5 g NaCl, mix, then add 3 ml ether/hexane (1:1) and vortex-mixed thoroughly and centrifuge at 1500 rpm. Remove the organic phase and place it in a clean tube (tube A). Perform another extraction by adding another 3 ml ethyl acetate to the sample, fol-lowed by the same mixing and centrifugation steps. Again, isolate the organic phase and combine it with the first extract by placing it in tube A. The mixture was evaporated to dryness with nitro-gen. 100 !l MSTFA and 50 !l ethyl acetate were added to the dried residue to further derivatize 3-DG. The tube was capped, mixed, and incubated for 30 min at 90◦C in a heating block. The mixture
was then cooled for GC–MS analysis.
2.4. GC–MS set-up and operation
An Agilent 6890N gas chromatograph/5975 mass selective detector (MSD) system operating at 70 eV with ion source
temper-ature set at 230◦C was used for this study. The gas chromatograph
was equipped with a 35-m HP-5 (Wilmington, DE) capillary col-umn (crosslinked 5% phenyl methyl siloxane) with 200-!m I.D. and 0.33-!m film thicknesses. The injector temperature and GC–MS interface temperature were maintained at 260 and 280◦C,
respec-tively. The sample was introduced into the gas chromatograph in splitless mode and the helium carrier gas flow rate was set at 1.0 ml/min. The oven temperature of the GC was set at 100◦C for
0.5 min, then increased to 280◦C at 25◦C/min and held for 1 min.
The post-run temperature was set at 300◦C for 2 min to clean up
the column before the next injection.
Typically, a full-scan mass spectrum of the derivatized analyte was obtained by injecting the CD product into the GC–MS sys-tem. The scan-range was typically set from m/z 50 to the molecular weight of the anticipated product with the possible maximal num-ber of chemical derivatization groups attached, rounded to the next “50” or “100”. For quantitation, the MSD was used in the selective ion monitoring mode, with the monitored of the following ions:
m/z 462,181, 265 (MG); m/z 448, 181, 251 (G); m/z 563, 181, 205 (3-DG); m/z 490, 181, 293 (2,3-pentanedione); m/z 335, 181, 300 (o-chlorobenzaldehyde). The ions underlined were used for quan-titation.
3. Results and discussion
3.1. Deproteinization
Deproteinization methods adapted for the analysis of G, MG, and 3-DG in plasma samples included ultrafiltration[8–13], vortexing [14], ethanol[10–13], methanol[15], trichloroacetic acid[16], and perchloric acid[17–23]. With the exception of an LC-based per-chloric acid study[19], none of these approaches has been applied to the simultaneous analysis of all three analytes. Concerned with potential generation of interfering compounds further complicat-ing the derivatization reactions and chromatography processes, we chose to avoid strong acids as the deproteinization agent. Ultrafil-tration, methanol, and ethanol approaches were evaluated along with acetonitrile—an agent frequently used in the analysis of drugs in biological matrices. Ultrafiltration was costly and time consum-ing; among the organic solvents evaluated, acetonitrile was found to result in best recoveries for all three analytes. The intensities of ions monitored for G (m/z 448), MG (m/z 462), and 3-DG (m/z 563) resulting from a comparative study using methanol, ethanol, and acetonitrile as the extraction solvent were 81, 202, 0; 2575, 3525, 1285; and 4588, 4197, 3063, respectively.
3.2. Sample preparation
We noted that PFBOA have been successfully used for the derivatization of G and MG [8,9], while 2,3-DAN [10,11], and methoxylamine[12,13] for 3-DG. In this study, we have selected PFBOA for the first derivatization step to bring in a molecular component (to the final derivatization product) exhibiting high ion-ization efficiency. N-Methyl-N-trimethylsilyl-trifluoroacetamide, a reagent commonly used in our laboratory, was adapted as the sec-ond derivatization reagent to convert the unreacted OH groups in 3-DG to trimethylsilyl (TMS) derivatives. Since isotopically labeled analogs of the analytes were not commercially available, we have chosen o-chlorobenzaldehyde as the IS for all analytes. This compound exhibits very compatible effectiveness under the deproteinization/derivatization/extraction system we have devel-oped for the analytes. Having explored much higher concentration and longer derivatization time, the resulting ion intensity derived from 2,3-pentanedione, another potential IS, was still found to be significantly lower.
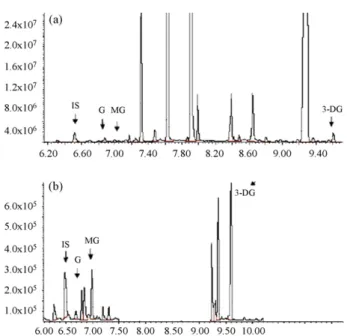
Fig. 1. Ion chromatograms of the derivatized G, MG, and 3-DG. (a) Full-scan ion
chromatogram and (b) selected ion monitoring ion chromatogram.
Having selected the IS, the deproteinization agent and pro-cedure, and the two derivatization steps, we then conducted a series of exploratory studies to develop a set of optimal experi-mental parameters. These parameters include sample size, duration and temperature for the derivatization reactions, and the solvent type and volume for the extraction of the derivatized products for GC–MS analysis. First, a small sample size of 500 !l was cho-sen for three reasons: (a) the intensities of ions monitored for all three analytes at the final step are abundant; (b) the volume of available plasma specimens is always very limited; and (c) since a significantly larger solvent volume is needed to effectively carry out the first derivatization step, adopting a smaller sample size allows for conducting the preparation steps without having to use over-sized vessels. For the first derivatization step by PFBOA in aqueous medium, room and significantly higher temperature (90◦C) were
found to be less effective. A 2-h incubation period at 50◦C resulted
in good derivatization yields for all three analytes. For the sec-ond derivatization step aiming for the “OH” functional (in 3-DG only), a TMS-derivatization agent frequently used in our labora-tory, MSTFA, was found highly effective at 90◦C with a 30-min
incubation time. The products of G and MG resulting from the first derivatization step were found to be stable under these conditions. Finally, ether/hexane was found not effective for the extraction of 3-DG (as a doubly derivatized product), leading to the addition of ethyl acetate as the second solvent for the extraction of the final deriva-tization products. In conclusion, the set of procedures described in the experimental section was found to generate optimal data.
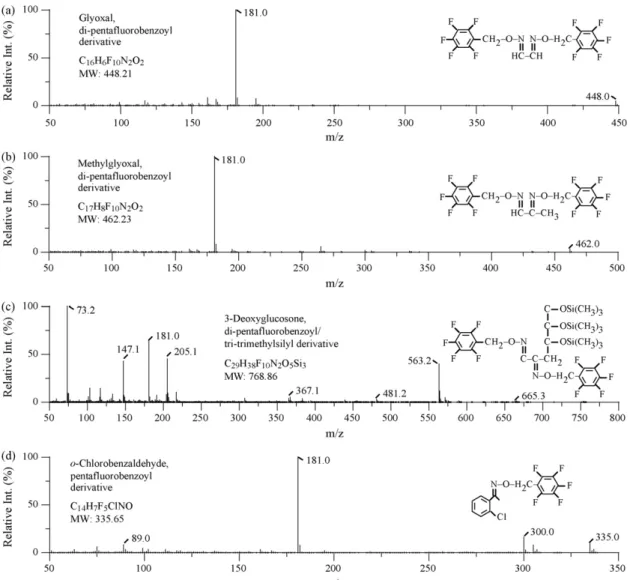
The above protocol resulted in distinct peaks for all three ana-lytes in full-scan and selected ion monitory ion chromatograms (Fig. 1). Shown inFig. 2are the mass spectra of the derivatized ana-lytes and the IS included in this study. Ions selected for monitoring the derivatized G, MG, 3-DG, and the IS were: m/z 448, 181, 251;
462, 181, 265; 563, 181, 205; 300, 181, 335. Ions underlined were concluded most suitable for quantitation with the consideration and empirical evaluation described below. Among the three ions monitored for each analyte and the IS, m/z 181 is not a good choice because it is only a fragment of the derivatization group without including any part of the analytes’ (or the IS’s) molecular frame-work. Four combinations are possible for the remaining two ions for each analytes and the IS. Correlation coefficients derived from
linear regression analysis of a set of standard addition experiment data are shown inTable 1. These data strongly suggested that the ions most suitable for the quantitation of G, MG, 3-DG, and the IS are m/z 448, 462, 563, and 300, respectively.
3.3. Challenges in quantitative analysis
Quantitative analysis of G, MG, and 3-DG in plasma are chal-lenging in several aspects. First, isotopically labeled analogs (ILAs) of the analytes are currently considered the most effective ISs for quantitative analysis of biological specimens[24]; yet, no ILA of the three analytes of interest is commercially available. Although a13
C-labeled 3-DG has been reported[10,12,13,25], our inquiry has not been fruitful, and, to the best of our knowledge, no ILA of G and MG has been reported. Second, preparation of calibration standards in the plasma matrix is complicated by the fact that “blank” plasma from any source all contains these three analytes.
With these concerns in mind, we have adopted the laborious standard addition method[26,27]to first determine the concen-trations of the three analytes in pooled “blank” plasma for the preparation of individual standards, followed by the establishment of calibration curves for these analytes. To determine these ana-lytes’ concentrations, the “blank” plasma sample was analyzed in four aliquots with the addition of 0, 10, 20, and 30 ng/ml each of these three analytes.
Shown inTable 2, on the rows entitled, “Plasma 1”, are the raw data and regression analysis parameters for a set of duplicate experiments. Plasma 1 was pooled samples collected from healthy individuals performing scheduled check-up. These three analytes’ concentrations in the pooled plasma were determined by the stan-dard addition method and shown in the last column ofTable 2. These figures are the intercepts at the concentration-axis when the data resulting from the four standards (with different concentra-tions of the analytes added) were plotted. These data represent these analytes’ concentrations in the pooled plasma, i.e., the “stan-dard” with the addition of “0 ng/ml” of analytes. Results derived from duplicate experiments agree well. Data derived from four additional plasma samples (also collected from healthy individuals) are shown inTable 2under the headings of “Plasma 2”, “Plasma 3”, “Plasma 4”, and Plasma 5“. Slight concentration variations of these analytes in these five plasma samples are evident.
In addition to determining the analytes’ concentrations in the pooled plasma samples used for the preparation of standards, two more “standards” with the additions of the analytes at higher concentrations, i.e., 40 and 50 ng/ml, were included to establish calibration curves to a higher concentration for the analysis of the analytes in the test specimens included in the same analytical batch. Thus, the concentrations of G, MG, and 3-DG in these six standards were: 15.3, 25.3, 35.3, 45.3, 55.3, 65.3; 31.2, 41.2, 51.2, 61.2, 71.2, 81.2; and 12.8, 22.8, 32.8, 42.8, 52.8, 62.8 ng/ml, respectively. Regression analyses were performed on these three sets of calibration data with the resulting data shown inTable 3. Also included in this table are two more sets of data for Plasma 4 and Plasma 5.
These regression equations were used to calculate the analytes’ concentrations in each sample and to evaluate the method’s limit of detection (LOD) and limit of quantitation (LOQ). In selected ion monitoring GC–MS analysis, LOD is commonly defined as the low-est concentration at which the two independent ion intensity ratios of the three ions monitored for a specific analyte are within ±20% of that observed in the calibration standard, while LOQ is defined as the lowest concentration that meets the LOD requirement and the observed concentration is also within ±20% of the expected value[28]. In this application, the ion ratios observed in the stan-dard with 20 ng/ml of analytes added were selected as reference values. Since the ion ratios observed in the “standard” with the
Fig. 2. Mass spectra of analytes and internal standards (all as derivatives suitable for gas chromatographic analysis). (a) Di-pentafluorobenzoyl G. (b) Di-pentafluorobenzoyl
MG. (c) Di-pentafluorobenzoyl/tri-trimethylsilyl 3-DG. (d) Pentafluorobenzoyl o-chlorobenzaldehyde. addition of 0 ng/ml analytes (i.e., the pooled plasma used for
prepar-ing the calibration standards) fall within the ±20% range of the reference values, the concentrations of the analytes found in the pooled plasma were considered the LODs of the method. Similarly,
Table 1
Selecting the most suitable ions for designating glyoxal, methylglyoxal, 3-deoxglucosone, and the internal standard (IS, o-chlorobenzaldehyde) in quantitative analysis
Analyte Ions designating analyte/IS (m/z) Coefficient
Glyoxal 448/300 0.9690 251/300 0.8725 448/335 0.8964 251/335 0.9054 Methylglyoxal 462/300 0.9935 265/300 0.9641 462/335 1.0000* 265/335 0.9872 3-Deoxyglucosone 563/300 0.9996 205/300 0.9361 563/335 0.9763 205/335 0.9746
With the exceptions of the data marked with an “*”, ion-pairs underlined were found to generate the best correlation coefficients for the set of standard addition experiment.
these same concentrations also meet the LOQ’s criteria; they are also considered as the method’s LOQs. Presumably, this method may be capable of achieving lower LOD and LOQ, but standards with lower analyte concentration could not be prepared and evaluated. Thus, the limits of detection and quantitation for G, MG, and 3-DG in the calibration curves established using Plasma 1 were 15.3, 31.2, and 12.8 ng/ml, respectively. Similarly, the upper limits for these three analytes were at least 65.3, 81.2, and 62.8 ng/ml, respectively. This method was then applied to the analysis of plasma sam-ples from blood bank[2], healthy individuals performing scheduled check-up[8], and diabetic patients[10]. Concentrations of G, MG, and 3-DG found in these samples are shown in Table 4. Many concentration readings are higher than the upper end of the calibra-tion curves described in the last paragraph; thus, they should only be considered semi-quantitative data. However, these concentra-tion findings are comparable with those reported in the literature [9–11,15,17,18,21]. While establishing the calibration curve using Plasma 4, a plasma specimen collected from a diabetes patient was analyzed without and with dilution (1:4). The observed concentra-tions resulting from these two assays are shown inTable 5, along with the expected concentrations of these analytes in the diluted specimen. Since the “blank” plasma used for dilution also contains these analytes, the expected concentrations of these analytes in the diluted specimen are not simply 1/4 of the concentrations of these
Table 2
Analysis of glyoxal, methylglyoxal, and 3-deoxyglucosone in “blank” plasma by standard addition method
Analyte Date Analyte (ng/ml) added Correlation parameters
Ions (m/z) 0 10 20 30 Equation Coefficient Conc.
Glyoxal Plasma 1 6 October 2007 448/300 0.09232 0.1505 – 0.2707 y= 0.0060x + 0.0918 0.9999 15.3 6 October 2007 0.09297 0.1570 – 0.2591 y= 0.0055x + 0.0967 0.9966 17.6 Plasma 2 1 November 2007 0.5136 0.7088 1.1695 1.6028 y= 0.0373x + 0.4395 0.9741 11.8 Plasma 3 24 January 2008 0.4537 – 1.3995 1.5582 y= 0.0383x + 0.4986 0.9605 13.0 Plasma 4 2 July 2008 0.1124 0.1557 0.2193 0.2469 y= 0.0044x + 0.1169 0.9690 26.2 Plasma 5 4 July 2008 0.1338 0.2098 0.2411 – y= 0.0124x + 0.0801 0.9469 25.5 Methylglyoxal Plasma 1 6 October 2007 462/300 0.1563 0.2068 0.2731 0.3025 y= 0.0051x + 0.1589 0.9808 31.2 6 October 2007 0.1475 0.2252 0.2785 0.3045 y= 0.0052x + 0.1603 0.9536 30.8 Plasma 2 1 November 2007 0.5217 – 0.7549 0.9307 y= 0.0134x + 0.5132 0.9882 38.3 Plasma 3 24 January 2008 0.3642 – 0.5896 0.6380 y= 0.0094x + 0.3734 0.9724 39.7 Plasma 4 2 July 2008 0.0714 0.0903 0.1173 0.1444 y= 0.0025x + 0.0691 0.9935 27.6 Plasma 5 4 July 2008 0.1494 0.1910 0.2353 0.3209 y= 0.0056x + 0.1405 0.9879 25.1 3-Deoxyglucosone Plasma 1 6 October 2007 563/300 0.06569 – 0.1798 0.2236 y= 0.0053x + 0.0676 0.9962 12.8 6 October 2007 0.06126 0.07708 – 0.1719 y= 0.0038x + 0.0522 0.9602 13.7 Plasma 2 1 November 2007 0.1518 0.2986 0.4331 0.6705 y= 0.0169x + 0.1349 0.9999 15.3 Plasma 3 24 January 2008 0.8047 1.4917 – 2.2615 y= 0.0471x + 0.8910 0.9754 18.9 Plasma 4 2 July 2008 0.1199 0.1833 – 0.2216 y= 0.0034x + 0.1204 0.9996 35.4 Plasma 5 4 July 2008 0.1558 0.2309 – 0.3071 y= 0.0054x + 0.1619 0.9871 33.9
Since the pooled plasma samples (blank) used for preparing calibration standards contain the analytes, the concentrations (in ng/ml) of these analytes in the blank were determined using the “standard addition method” by adding 0, 10, 20, and 30 ng/ml of the analytes into four replicates of the pooled plasma samples. Linear regression analyses were performed on these four “response vs. added concentration” data for all three analytes. The resulting regression equations were then used to derive the concentrations of these analytes in the plasma blank and shown in the last column of the table. Plasma 1 was done in duplicates and the resulting data were very consistent.
Table 3
Establishing calibrations curves for the analysis of glyoxal, methylglyoxal, and 3-deoxyglucosone in test plasma specimens
Analyte Date Ions (m/z) Observed analyte/IS ion intensity ratio at different analyte concentration (ng/ml) Correlation parameters Equation Coefficient
Glyoxal 448/300 a a+ 10 a+ 20 a+ 30 a+ 40 a+ 50
Plasma 1 6 October 2007 0.09232 0.1505 – 0.2707 0.3221 0.3947 y= 0.0061x − 0.0100 0.9835 Plasma 4 2 July 2008 0.1124 0.1557 0.2193 0.2469 0.2857 0.2865 y= 0.0037x + 0.0318 0.9461 Plasma 5 4 July 2008 0.1338 0.2098 0.2411 – 0.5452 0.7583 y= 0.0124x − 0.2447 0.9469 Analyte Date Ions (m/z) Observed analyte/IS ion intensity ratio at different analyte concentration (ng/ml) Correlation parameters
Equation Coefficient Methylglyoxal 462/300 b b+ 10 b+ 20 b+ 30 b+ 40 b+ 50
Plasma 1 6 October 2007 0.1563 0.2068 0.2731 0.3025 0.3289 0.3577 y= 0.0040x + 0.0456 0.9644 Plasma 4 2 July 2008 0.0714 0.0903 0.1173 0.1444 0.1859 0.0754 y= 0.0028x – 0.0129 0.9806 Plasma 5 4 July 2008 0.1494 0.1910 0.2353 0.3209 – 0.4192 y= 0.0056x + 0.0005 0.9879 Analyte Date Ions (m/z) Observed analyte/IS ion intensity ratio at different analyte concentration (ng/ml) Correlation parameters
Equation Coefficient 3-Deoxyglucosone 563/300 c c+ 10 c+ 20 c+ 30 c+ 40 c+ 50
Plasma 1 6 October 2007 0.06569 – 0.1798 0.2236 0.2799 0.2944 y= 0.0044x + 0.0325 0.9555 Plasma 4 2 July 2008 0.1199 0.1833 – 0.2216 0.2385 0.2487 y= 0.0026x + 0.0366 0.9871
Plasma 5 4 July 2008 0.1558 0.2309 – 0.3071 – 0.4360 y= 0.0054x − 0.0197 0.9871
“a”, “b”, and “c” are the concentrations of glyoxal, methylglyoxal, and 3-deoxyglucosone in the “blank” plasmas used for the preparation of standards to establish calibration curves. As shown inTable 2, the values of “a” in Plasma 1, Plasma 4, and Plasma 5 are 15.3, 31.2, and 12.8 ng/ml. The corresponding values for “b” and “c” are 26.2, 27.6, 35.4; and 25.5, 25.1, and 33.9, respectively.
Table 4
Analyte’s concentration (ng/ml) in plasma samples from different sources Analyte Blood bank Scheduled check-up DM patients
G 19.9, 22.4 12.5, 23.3, 15.4, 17.5 187, 161, 125, 137, 423, 73.9 MG 109, 34.7 13.1, 33.3, 31.1, 31.3 267, 306, 258, 294, 386, 191 3-DG 281, 128 6.05, 5.59, 2.83, 1.62 91.3, 112, 136, 203, 65.5, 19.6
analytes in the undiluted specimen. A sample calculation is shown in the legend ofTable 5. Included in the last column ofTable 5are the deviations (from the expected values) of the observed concen-trations for these analytes in the diluted specimen, assuming that the concentrations observed in the undiluted specimens are accu-rate. The deviations observed for MG and 3-DG are well within the acceptable 20% range[28], while that for G is significant higher. This is an indication that the concentration of this analyte observed in the undiluted specimen may not be accurate. This is a reasonable
Table 5
Comparison of the analytes’ concentrations resulting from the analysis of the specimen without and with dilution
Analyte Observed conc. (ng/ml) Expected conc. (ng/ml)
of the diluted specimen
Deviation (%) of observed conc. from the expected value in the diluted specimen Without dilution With 1:4 dilution
Glyoxal 119 33 49.4 −33.2%
Methylglyoxal 58 29 35.2 −17.6%
3-Deoxyglucosone 63 38 42.3 −10.2%
Since the “blank” plasma used for dilution also contains the analytes, the expected concentrations of the analytes in the diluted (1:4) specimen are calculated as follows: [(concentration before dilution) + 3 × (concentration of the analyte in the blank plasma)]/4. The concentration of glyoxal, methylglyoxal, and 3-deoxyglucosone in the blank plasma used for diluting the specimen are 26.2, 27.6, and 35.4 ng/ml, respectively. Thus, taking glyoxal as example, the expected concentration in the diluted specimen is: 119 + 3 × 26.2)/4 = 49.4 ng/ml.
observation, as the concentration of this analyte in the undiluted specimen is apparently above the upper limit of quantitation as established by the calibration line.
We believe the method hereby developed is robust and effective for the analysis of the analytes of interest; however, the correlation coefficients for the data resulting from the standard addition exper-iments shown inTable 2are less than desirable mainly because lacking the ILAs of the analytes to serve as the ISs. Thus, further studies will focus on the synthesis and evaluation of the ILAs of these analytes. When these ideal ISs become available, more accu-rate quantitation can be achieved and the resulting data can be better used for interpreting the following phenomena: (a) vary-ing sample pretreatment approaches to detect analytes exitvary-ing in different states as implied by Lal et al.[10]; (b) difference of the analytes concentrations in plasma and whole blood; and (c) better understanding on the clinical significances that may be related to the level of these analytes.
4. Conclusions
Simultaneousdetermination of G, MG, and 3-DG in plasma by GC–MS-based methodology has been proven achievable through deproteinization by acetonitrile, followed by 2-step derivatization and extraction approaches. Improved quantitation of these analytes using respective ILAs as the ISs will facilitate understanding the physiological significances of the analytical findings.
Acknowledgments
This work was partially supported by (Taiwanese) National Council of Science grants NSC96-2811-M-242-001, NSC95-2622-B-242-002-CC3, and NSC96-2113-M-242-002-MY2.
References
[1] P.J. Thornalley, Pediatr. Nephrol. 20 (2005) 1515.
[2] T. Miyata, S. Sugiyama, A. Saito, K. Kurokawa, Kidney Int. 59 (2001) S-25. [3] A. Lopolla, P. Traldi, D. Fedele, Clin. Biochem. 38 (2005) 103.
[4] C.-H. Wu, M.-H. Huang, S.-M. Wang, C.-C. Lin, R.H. Liu, J. Chromatogr. A 1157 (2007) 336.
[5] B.-G. Chen, S.-M. Wang, R.H. Liu, J. Mass Spectrom. 42 (2007) 1012.
[6] C.-H. Wu, S.-C. Yang, Y.-S. Wang, B.-G. Chen, C.-C. Lin, R.H. Liu, J. Chromatogr. A 1182 (2008) 93.
[7] D.-L. Lin, S.-M. Wang, C.-H. Wu, B.-G. Chen, R.H. Liu, J. Food Drug Anal. 16 (2008) 1.
[8] A. Lapolla, R. Flamini, T. Tonus, D. Fedele, A. Senesi, R. Reitano, E. Marotta, G. Pace, R. Seraglia, P. Traldi, Rapid Commun. Mass Spectrom. 17 (2003) 876.
[9] A. Lapolla, R. Flamini, A.D. Vedova, A. Senesi, R. Reitano, D. Fedele, E. Basso, R. Seraglia, P. Traldi, Clin. Chem. Lab. Med. 41 (2003) 1166.
[10] S. Lal, F. Kappler, M. Walker, T.J. Orchard, P.J. Beisswenger, B.S. Szwergold, T.R. Brown, Arch. Biochem. Biophys. 342 (1997) 254.
[11] W.H. Hoffman, F. Kappler, G.G. Passmore, R. Mehta, Clin. Biochem. 36 (2003) 269.
[12] S. Tsukushi, K. Shimokata, T. Niwa, J. Chromatogr. B 731 (1999) 37.
[13] S. Tsukushi, M. Kajita, S. Nakamura, T. Niwa, J. Chromatogr. B Analyt. Technol. Biomed. Life Sci. 776 (2002) 133.
[14] L. Nemet, I. Varga-Deftrdarovic, Z. Turk, Clin. Biochem. 37 (2004) 875. [15] M.Y. Khuhawar, A.J. Kandhro, F.D. Khand, Anal. Lett. 39 (2006) 2205. [16] K.J. Knecht, M.S. Feather, J.W. Baynes, Arch. Biochem. Biophys. 294 (1992)
130.
[17] H. Kusunoki, S. Miyata, T. Ohara, B.-F. Liu, A. Uriuhara, H. Kojima, K. Suzuki, H. Miyazaki, Y. Yamashita, K. Inaba, M. Kasuga, Diabetes Care 26 (2003) 1889. [18] H. Yamada, S. Miyata, N. Igaki, H. Yatabe, Y. Miyauchi, T. Ohara, M. Sakai, H.
Shoda, M. Oimomi, M. Kasuga, J. Biol. Chem. 269 (1994) 20275. [19] P.J. Thornalley, A. Langborg, H.S. Minhas, Biochem. J. 344 (1999) 109. [20] A.C. Mclellan, S.A. Phillips, P.J. Thornalley, Anal. Biochem. 206 (1992) 17. [21] Y. Hamada, J. Nakamura, H. Fujisawa, H. Yago, E. Nakashima, N. Koh, N. Hotta,
Diabetes Care 20 (1997) 1466.
[22] E. Fujii, H. Iwase, I. Ishii-Karakasa, Y. Yajima, K. Hotta, J. Chromatogr. B Biomed. Appl. 660 (1994) 265.
[23] E.W. Randell, S. Vasdev, V. Gill, J. Pharmacol. Toxicol. Methods 51 (2005) 153.
[24] R.H. Liu, T.-L. Lin, W.-T. Chang, C. Liu, W.-I. Tsay, J.-H. Li, T.-L. Kuo, Anal. Chem. 74 (2002) 618A.
[25] T. Niwa, K. Niimura, M. Ohara, S. Tomiyama, US Patent 5,618,734 (1997). [26] H.H. Willard, L.L. Merritt Jr., J.A. Dean, F.A. Settle Jr., Instrumental Methods of
Analysis, 7th ed., Wadsworth Publishing, Belmont, CA, 1988, p. 32. [27] I. Krull, M. Swartz, LC–GC 16 (1998) 1984.
[28] SOFT/AAFS Forensic Toxicology Laboratory Guidelines (2006 Version), Section 8 (http://www.soft-tox.org/docs/Guidelines%202006%20Final.pdf).