行政院國家科學委員會專題研究計畫 期中進度報告
台灣股票市場的權益溢酬(1/2)
計畫類別: 個別型計畫 計畫編號: NSC92-2416-H-004-028- 執行期間: 92 年 08 月 01 日至 93 年 07 月 31 日 執行單位: 國立政治大學財務管理學系 計畫主持人: 周行一 計畫參與人員: 陳明憲 政治大學財務管理學系博士生 報告類型: 精簡報告 處理方式: 本計畫涉及專利或其他智慧財產權,2 年後可公開查詢中 華 民 國 93 年 5 月 31 日
行政院國家科學委員會補助專題研究計畫
期中進度報告
台灣股票市場的權益溢酬(1/2)
計畫類別: 5 個別型計畫 □ 整合型計畫
計畫編號: NSC 92 - 2416 - H - 004 - 028 -
執行期間: 92 年 8 月 1 日 至 93 年 7 月 31 日
計畫主持人: 周 行 一
共同主持人:
計畫參與人員: 陳明憲 (政大財管所博士班學生)
成果報告類型(依經費核定清單規定繳交):5精簡報告 □完整報告
本成果報告包括以下應繳交之附件:
□赴國外出差或研習心得報告一份
□赴大陸地區出差或研習心得報告一份
□出席國際學術會議心得報告及發表之論文各一份
□國際合作研究計畫國外研究報告書一份
處理方式:除產學合作研究計畫、提升產業技術及人才培育研究計
畫、列管計畫及下列情形者外,得立即公開查詢
□涉及專利或其他智慧財產權,□一年□二年後可公開查詢
執行單位:國立政治大學 財務管理學系
中華民國 93 年 5 月 31 日
Equity Risk Premium in Taiwan
Edward H. Chow Department of Finance National Chengchi University
With the assumption that the expected-utility maximizing investors with standard additively separable state preferences and constant relative risk aversion (CRRA), standard financial economic theory predicts the level of risk premium a risky asset would offer. Locus (1978) and Breeden (1979) examine equilibrium stochastic pattern of a risky asset’s return in a pure single-good exchange economy. With homogeneous belief and CRRA, each individual maximizes his intertemporal expected utility of consumption by acquiring the claim of a risky asset that implies the risk level he can afford. In the famous consumption-based CAPM model (CCAPM model), the covariance of the return on the risky asset with the per capita consumption measures the risk of this risky asset. Using the covariance, one can get a theoretically expected risk premium based on the relation similar to that of CAPM.
Based on a standard equilibrium model, with individuals maximizing an additively separable CRRA utility function, Mehra and Prescott (1985) calculate the coefficient of relative risk aversion needed to justify the US historical equity risk premium and conclude that it is too high to be reasonable. It took Mehra and Prescott almost six years to convince a skeptical profession for their paper (1985) to be published and attended by financial economists.
Table 1 shows the estimates of Mehra (2002) on the long-term real rate of return of the US stock market, yields of a relatively riskless asset, and the risk premium derived from the two estimates. From 1889–1978, a period that does not include the recent bull period, the annual real rate of return on equities was about 7%. For the 1889–2000 period, the annual rate of return was 7.9 %. The standard deviation of annual rate of return was about 20%. In addition, as Table 2 shows, other countries have similar returns. The US T-bills have returned about 1% with a 4% standard deviation.
Similar empirical findings by Siegel (1992 a, b), Siegel and Montgomery (1995), Siegel and Thaler (1997), Welch (2000), and Fama and French (2002) for the U.S. security market, Baytas and Kakici (1999) for Japanese Nikko Securities market, and Jorion and Goetzmann (1999) for 39 countries indicate that an unreasonable large equity risk premium exists across countries and varies with time.
Table 1. Real U.S. Equity Market and Riskless Security Returns and Equity Risk Premium, 1802-2000 Period Mean Real Return on Market Index Mean Real Return on a Relatively Riskless Asset Risk Premium 1802–1998 7.0 % 2.9% 4.1% 1889–2000 7.9 1.0 6.9 1889–1978 7.0a 0.8 6.2b 1926–2000 8.7 0.7 8.0 1947–2000 8.4 0.6 7.8 a. Not rounded, 6.98%. b. Not rounded, 6.18%.
Sources: Data for 1802–1998 are from Siegel (1998); from Mehra and Prescott (1985) for 1889–2000.
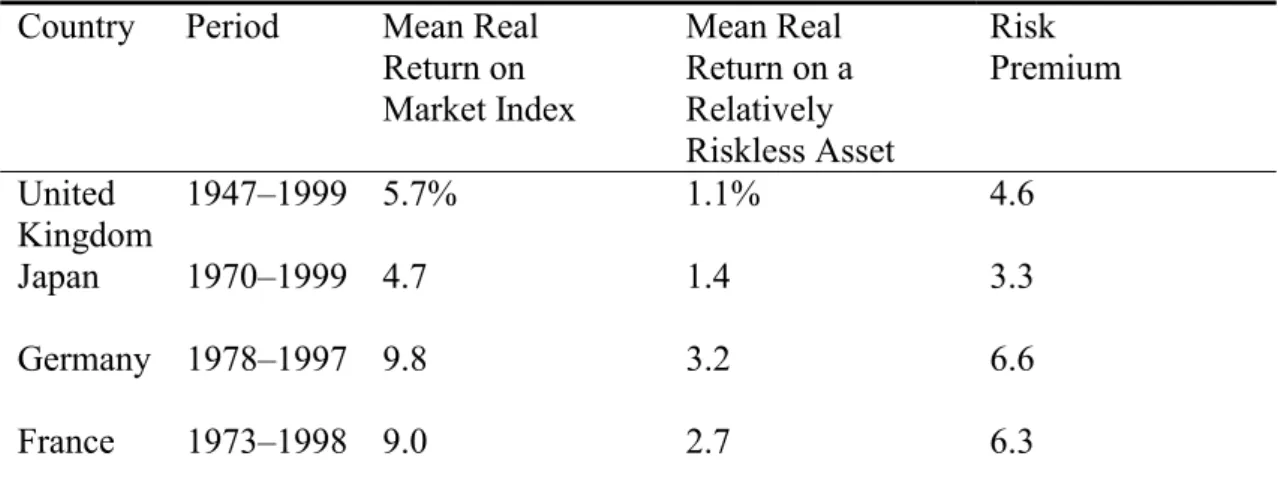
Table 2. Real Equity and Riskless Security Returns and Equity Risk Premium: Selected Developed Markets, 1947–98
Country Period Mean Real Return on Market Index Mean Real Return on a Relatively Riskless Asset Risk Premium United Kingdom 1947–1999 5.7% 1.1% 4.6 Japan 1970–1999 4.7 1.4 3.3 Germany 1978–1997 9.8 3.2 6.6 France 1973–1998 9.0 2.7 6.3
Sources: Data for the United Kingdom are from Siegel (1998); the remaining data are from Campbell (2002).
Why are the returns on T-bills so much lower than those on equity? Is the phenomenon caused by the risk difference or just by the statistically calculated biases? Much research has been conducted to provide possible explanations for the equity risk
premium puzzle. Cochrane (1997) and Siegel and Thaler (1997) survey the literature on the equity risk premium puzzle comprehensively. Cochrane (2001) analyzes equity risk premium under a unified framework of the stochastic discount factor methodology. Mehra (2002) summarizes main research directions in this field during the past two decades.
Several modifications dealing with the theoretical assumptions and modeling of Mehra and Prescott’s (1985) model have been proposed. Epstein and Zin (1989) introduce a new class of preference which allows a separate parametrization of risk aversion and intertemporal elasticity of substitution to improve the seemingly-unrealistic assumption of constant relative risk aversion. Constantinides (1990) and Campbell and Cochrane (1999) took “habits formation” of individuals into account, relaxing the assumption of time separability. Constantinides and Duffie (1996) propose a model with heterogeneous and idiosyncratic income risk.
Brown, Goetzmann and Ross (1995) argue that the equity risk premium estimated from the US data is conditioned on market survival. The unconditional premium including the possibility of a market failure might be lower. However, Li and Xu (2002) have recently shown that the survival bias is unlikely to be significant.
Researchers also have attempted to resolve the equity risk premium puzzle with the help of behavior finance. Benartzi and Thaler (1995) combined loss aversion and mental accounting to propose “myopic loss aversion.” They suggested that investors care most strongly about the market changes that occur over short periods, which explains both the observed portfolio holdings and the large equity premium.
Barberis, Huang, and Santos (1996) added the “house money effect” (that is, loss aversion is reduced following recent gains) to the myopic loss aversion model and came to similar conclusions of Benartzi and Thaler (1995). Thaler, Tversky, Kahneman, and Schwartz (1997) conducted experiments to examine whether or not investors actually behave the way Benartzi and Thaler’s (1995) myopic loss aversion model suggests. They concluded that the more often investors look at the market, the more risk averse they become, which is exactly what Benartzi and Thaler (1995) suggests. Loss aversion can be mitigated by forced aggregation (to avoid narrow framing), and learning may be improved by less frequent feedback. This result
seemly implies that equity premium must vary depending on the market conditions, since each individual’s loss aversion changes over times.
Recently many empirical researches have adopted new approaches trying to provide satisfactory explanations for the equity premium puzzle. Related studies by Campbell and Shiller (1988), Fama and French (1988) and Blanchard (1993) used prior dividends payout to predict the expected returns of security and showed that this proxy did explain the future expected returns much, although the explaining power is lower after 1990 (Goyal-Welch 2000). Using the data from CRSP, Siegel (1998), Schwert (1990) and Shiller (1989) estimated long-term performance of the US stock market from 1802 to 1997. For example, Siegel(1998)showed that the annualized real return is 7.0% from 1802 to 1870, 6.6% from 1871 to 1925, and 7.2% from 1926 to 1997. Even during the period of the World War II when there was unexpected inflation, the US stock market offered a 7.5% annual average real return. He indicated that the real equity return not only behaved as a mean reversion pattern but compensated equity holders a stationary reward.
Rietz (1988) argued that the U.S. data were misleading for a different reason. Investors may have rationally anticipated the possibility of a catastrophic event that has not yet occurred. This “peso problem” implies that sample volatility understates the true risk of equity investment. One difficulty with this argument is that it requires not only a potential catastrophe but one that affects stock market investors more seriously than investors in short-term debt instruments. Many countries that have experienced political upheaval or defeat in war have seen very low returns on short-term government debt and on equities. The major example of a disaster for stockholders that spared bondholders is the Great Depression of the 1930s, but of course this event is already included in the long-term US data.
Diamond (1999) argued that there were two different equity premium concepts: a realized equity premium, measured by historical rates of return, and a required equity premium, which investors holding stocks expected to receive. The latter might have been considerably lower than the former in the past, due, for example (see Fama and French (2002)), to a steady decline of expected returns, generating unexpected capital gains. He suggested a number of possible explanations for this alleged decline of
expected returns: a reduction of the costs of investing in stocks, a broader ownership, greater possibilities of diversification and the expectation of slower economic growth in the future.
Various techniques have been proposed to estimate ex ante expected returns on stocks. Welch (2000) found that the consensus equity premium estimate of academic financial economists lied between six and seven percent, depending on time horizons. Claus and Thomas (2001) computed the discount rate which equated market prices to the present value of expected future cash flows. They found that, for the period 1985-1998 and for a panel of five countries, the equity premium was around 3%. Fama and French (2002) used dividends and earnings growth rates to measure the expected rate of capital gain. They argued that the dividend and earnings growth estimates of the 1951-2000 equity premiums were close to the true expected value.
Empirical evidences studied outside the US market showed a similar puzzle. Jorion and Goetzmann (1999) studied inflation-adjusted stock market appreciation, excluding dividends, for 39 countries for the period of 1926-1999. He found that the median real appreciation rate was only 0.8% per year compared to 4.3% per year for the US. There are reasons to suspect, however, that these estimates of return on capital are subject to survivorship, as the United States could be the most successful capitalist system in the world; most other countries have been plagued by political upheaval, war, or financial crises. Jorion and Goetzmann’s finding may indicate the importance of selection bias (or survivorship bias), although it is possible that lower returns were compensated by higher dividend yields in that period.
Perhaps due to lack of data, Taiwan’s market is not included in Jorion and Goetzmann’s (1999) sample. Recently Taiwan has emerged as an important emerging market. The Taiwan Stock Exchange Corporation’s (TSEC) value weighted stock index (TAIEX) is a part of the Dow Jones World Stock Market Index and the MSCI Emerging Market Free Index series. In addition, the weight of Taiwan’s stocks in the MSCI index has been increasing over time. In our paper we will examine in depth the equity risk premium of Taiwan and will attempt to provide explanations for the well-publicized equity risk premium puzzle by comparing the nature of Taiwan’s equity risk premium with that of the US.
Fama and French (2002) show that the equity risk premium forecasted by dividend growth model is more accurate than that forecasted by earnings growth model in the US market. But there are important differences between market characteristics of Taiwan and the US, such as degree of survivalship bias, dividend payout ratio and potential political risk. We will take these differences into account when attempting to shed light on the cause of high equity risk premium.
In addition, most of the emerging markets in Jorion and Goetzmann’s (1999) sample cover only short interrupted periods of data. We will use the entire data series of the TSEC since its inception. To do our research, in addition to the data available from the Taiwan Economics Journal (TEJ), we have collected a broad dataset of Taiwan’s securities in variables such as market value, the distribution date and amount of cash dividend of every listed firm between 1966 to 1985. Since our dataset is not publicly available anywhere in Taiwan, it is another contribution of our research.
Data Collection and Preliminary Results
In order to have an accurate picture of equity risk premium, we need to include cash dividend and its reinvestment effect in the Taiwan Stock Exchange Corporation Capitalization Weighted Stock Index (TAIEX). We have manually collected cash dividends, daily closing prices and ex-dividend dates of individual stocks since the inception of the TSEC. Cash dividends of each stock ever listed on the TSEC are collected from the TEJ’s “Equity Data Base” for the period 1986 to 2002 and from the “Status of Securities Listed” and “TSEC Monthly Reviews” published by the TSEC for the period 1966 to 1985. We use the TEJ’s “Equity Data Base” from 1986 to 2002 and “Status of Securities Listed” from 1962 to 1985 to calculate the daily market value on each stock. Ex-dividend dates are collected from the “TSEC Monthly Reviews” and “Daily Trading Reports” for the period 1971 to 2002, and from “United Daily News” and “Daily Trading Reports” of the TSEC for the period 1962 to 1970.
To remove inflation factor from the nominal return to get real return, we use monthly price index published by “Directorate General of Budget Accounting and Statistics Executive Yuan” to adjust the nominal return. Based on the price level of
1996, the price index is 16.88 in 1962 and 103.72 in 2001, which is about 6.05 times of that in 1962. Based on the assumption that daily price index grows at a fixed rate every month, we obtain daily inflation rate using the following formula.
1 1 1 − = − T m m t IP IP π ,
where πt is the estimated daily inflation rate, IP (m IPm−1) is the month-end price
index at the m-th (m-1- th) month, and T is the number of days per month. In addition, we use the one-year time deposit interest rate disclosed by the Central Bank of ROC from 1962 to 2001 as the proxy for the risk free rate.
The arithmetic mean and geometric mean of the ratio of cash dividend to market capitalization (i.e., the dividend yields) from 1962 to 2001 are about 3.94% and 2.54%, respectively. The dividend yield decreases with time with the highest value at 16.72% in 1962 and the lowest value at 0.51% in 1997. The same pattern can be found in the cash dividend payout ratio. The ratio decreases from 1962 to 1998, but increases in the recent three years from 1999 to 2002. Since dividend payout ratio is much lower in Taiwan than in the US, our evidence suggests that dividend payout ratio may be critical in the comparison of equity risk premium between Taiwan and the US.
We incorporate the reinvestment effect of cash dividend into the original TAIEX to obtain a new index with dividend reinvestment. The effect of cash dividend on the index is eye-catching. For example, the original TAIEX index was 92.48 points on Jan. 4, 1967 and 530.52 points on Jan. 4, 1979, while the dividend reinvested index grows from 530.52 points to 1057.51 points.
Table 3 shows the real rate of return, riskless interest rate rate, equity risky premium and the Sharpe ratio, which proxies for the degree of market’s risk aversion, over different holding periods including twenty years, ten years and five years as well as two subperiods demarcated by the highest historical point of TAIEX. For the holding period of twenty years the equity risk premium is 6.84% in the first subperiod (from 1962 to 1982) and 15.15% in the second period (from 1983 to 2002). But in the second ten-year subperiod (from 1973 to 1982), contrary to the standard financial
theory, the equity risk premium is negative. Our data also shows that during the subperiod prior to the highest point of TAIEX (12495.34) investors were compensated with a risk premium of 26.85%. In contrast, the equity premium was -0.49% afterwards for the period from 1990 to 2002. Since investors would not willingly accept negative equity risk premium, this disappointing result ought to be a surprise to investors. Our observation support Sigel and Thaler’s (1997) idea that the issue of equity risk premium should be empirically studied under the long run. Our evidence also shows that Taiwan exhibits, in addition to a volatile market, volatile equity risk premium that is not matched by that of the US.
Next Stage of the Proposed Research
Since we have collected most of the data needed for our research, we are now at the stage of formulating testable hypotheses and developing methodology to examine equity risk premium in Taiwan and the US. We will characterize the differences in equity risk premium between Taiwan and the US and try to provide new insights to the understanding of the reasons for the premium to be different between the two markets. We hope that not only will our research results contribute to the understanding of the equity risk premium puzzle in the literature, but will also offer valuable applications for international assets allocation and portfolios management. Table 3. Real Rate of Return of TAIEX, Riskless Interest Rate and Equity Risk Premium Period Real Return of Stock Index Real Return of Riskless Rate Equity Risk Premium Sharpe Ratio 1962~1982 14.44% 7.6% 6.84% 0.1731 Holding Period of 20 Years 1083~2002 21.49% 6.33% 15.15% 0.2992 1962~1972 22.74% 4.72% 18.03% 0.4742 1973~1982 6.14% 10.48% -4.35% -0.1054 1983~1992 35.20% 7.31% 27.89% 0.4577 Holding Period of 10 Years 1993~2002 7.78% 5.36% 2.42% 0.0674
1962~1967 18.04% 4.32% 13.72% 0.3493 1968~1972 18.24% 7.01% 11.23% 0.7538 1973~1977 8.86% 9.62% -0.76% 0.1549 1978~1982 -17.42% 10.13% -27.57% -1.2927 1983~1987 40.98% 6.63% 34.35% 0.8062 1988~1992 14.81% 8.12% 6.69% 0.2017 1993~1997 15.04% 7.01% 8.03% 0.3996 Holding Period of 5 Years 1998~2002 -10.21% 2.31% -12.52% -0.3265 1962~1989 (28 years) 26.85% 7.39% 19.46% 0.4178 Two Sub-periods Divided by the Highest Historical
Price Level 1990~2002 (13 years) -0.49% 6.09% -6.58% -0.1805 Note:
1. Taiwan’s stock market reached its highest level at 12495.34 points on Feb. 10, 1990.
2. We use Sharpe ratio to proxy for a measure of the relative risk aversion of the market. References 周行一與陳怡雯, 2002, 台灣證券交易所發行量加權股價指數未納入金股利再投 資收益因素對投資報酬率的影響及基金績效衡量之影響,證券市場發展季 刊,53 期,1-24。 周行一與黃寬彥,2003, 台灣股市的長期績效,working paper.
Abel, A. B, 1990, Asset prices under habit formation and catching up with the Jones, American Economic Review 80, 38-42
Abel, A. B, 1991, The equity premium puzzle, Business Review of Federal Reserve Bank of Philadelphia, 3-14
Baytas, A. and N. Kakici, 1999, Do stocks really provide the highest return in the long run? Journal of Investing 8, 89-96.
Benartzi, S. and R. Thaler, 1995, Myopic risk aversion and the equity risk premium puzzle, Quarterly Journal of Economics 110, 75-92.
Bollerslev, T., 1986, Generalized Autoregressive Conditional Heteroskedasticity, Journal of Econometrics 31, 307-327.
Chen, M., E.H. Chow, V.W. Liu, and Y. Liu, 1994, Intra-day stock returns of Taiwan: An examination of transaction data, paper of the first NTU international conference on finance.
Campbell, J. Y. and J. Cochrane, 1999, By force of habit: a consumptionbased explanation of aggregate stock market behaviour, Journal of Political Economy 107, 205-251.
Clark, G. and M. Statman, 2000, The DJIA Crossed 652,230 Journal of Portfolio Management 26, 89-93.
Constantinides, G. M., 1990, Habit formation: a resolution of the equity premium puzzle, Journal of Political Economy 98, 519-543.
Engle, R. F., 1982, Autoregressive Conditional Heteroscedasticity with Estimates of the Variance of United Kingdom Inflation, Econometrica 50, 987-1007.
Epstein, L. G and S. E. Zin, 1989, Substitution, risk aversion, and the temporal behavior of consumption growth and asset returns I: a theoretical framework, Econometrica 57, 937-969.
Epstein, L. G. and S. E. Zin, 1990, First order risk aversion and the equity premium puzzle, Journal of Monetary Economics 26, 387-407.
Epstein, L. G. and S. E. Zin, 1991, Substitution, risk aversion, and the temporal behavior of consumption and asset returns II: an empirical analysis, Journal of Political Economy 99, 263-286.
Fama, E.F. and K.R. French, 1988, Permanent and temporary components of stock prices, Journal of Political Economy 96, 246-273.
Fama, E.F. and K. R. French, 2002, The equity premium, Journal of Finance 57, 637-659.
Ferson, W. E. and G. M. Constantinides, 1991, Habit persistence and durability in aggregate consumption: empirical tests, Journal of Financial Economics 29, 199-240.
Science, forthcoming.
Jorion, P and W.N. Goetzmann, 1999, Global stock markets in the twentieth century, Journal of Finance 54, 953-980.
Mankiw, N. G, 1986, The equity premium and the concentration of aggregate shocks, Journal of Financial Economics 17, 211-219.
Mankiw, N.G. and S.P. Zeldes, 1991, The consumption of stockholders and nonstockholders, Journal of Financial Economics 29, 97-112
Mehra, R. and E. Prescott, 1985, The equity premium: A puzzle, Journal of Monetary economics 15, 145-161.
Merton, R., 1973, An intertemporal capital asset pricing model, Econometrica 41, pp.867-887
Merton, R., 1980, On estimating the expected return of the market, Journal of Financial Economics 8, 323-361.
Poterba, J. and H. Summers, 1988, Mean reversion in stock prices: Evidence and implications, Journal of Financial Economics 22, pg. 27-60.
Schwert, G., 1990, Index of U.S. stock prices from 1802 to 1987, Journal of Business 63, 399-426.
Shiller, R., 1989, Market Volatility, Cambridge, Mass:M.I.T.
Siegel, J. J., 1992a, The quity premium: Stock and bond returns since 1802, Financial Analyst Journal 48, 28-38.
Siegel, J. J., 1992b, The real rate of interest from 1800 to 1990: A study of the U.S. and U.K., Journal of Monetary Economics 29, 227-252.
Siegel, Montgomery, 1995, Stocks, bonds, and bills after taxes and inflation, Journal of Portfolio Management 21, 17-26.
Siegel, J.J. and R. H. Thaler, 1997, Anomalies: The equity premium puzzle, Journal of Economic Perspectives 11, 191-200.
Siegel, J., 1998, Stocks for the Long Run, 2nd edition, New York:McGraw-Hill. Rietz, T.A., 1988, The equity premium: A solution, Journal of Monetary Economics
Weil, P., 1989, The equity premium puzzle and the riskless rate puzzle, Journal of Monetary Economics 24, 401-422.
Welch, I., 2000, Views of financial economists on the equity premium and on professional controversies, Journal of Business 73, 501-537.
Wilson, W. and P. Jones, 1987, A comparison of annual common stock return: 1871-1925 with 1926-86, Journal of Business, 239-258.
Wilson, W. and P. Jones, 1995, Probabilities associated with common stock returns Journal of Portfolio Management, 21-32.