30 nm resolution x-ray imaging at 8 keV using third order diffraction of a zone plate
lens objective in a transmission microscope
Gung-Chian Yin, Yen-Fang Song, Mau-Tsu Tang, Fu-Rong Chen, Keng S. Liang, Frederick W. Duewer, Michael Feser, Wenbing Yun, and Han-Ping D. Shieh
Citation: Applied Physics Letters 89, 221122 (2006); doi: 10.1063/1.2397483 View online: http://dx.doi.org/10.1063/1.2397483
View Table of Contents: http://scitation.aip.org/content/aip/journal/apl/89/22?ver=pdfcov Published by the AIP Publishing
Articles you may be interested in
Hydrogen silsesquioxane double patterning process for 12 nm resolution x-ray zone plates J. Vac. Sci. Technol. B 27, 2606 (2009); 10.1116/1.3242694
Hard-x-ray microscopy with Fresnel zone plates reaches 40 nm Rayleigh resolution Appl. Phys. Lett. 92, 103119 (2008); 10.1063/1.2857476
Nanofabrication of high aspect ratio 24 nm x-ray zone plates for x-ray imaging applications J. Vac. Sci. Technol. B 25, 2004 (2007); 10.1116/1.2789447
Energy-tunable transmission x-ray microscope for differential contrast imaging with near 60 nm resolution tomography
Appl. Phys. Lett. 88, 241115 (2006); 10.1063/1.2211300
25 nm mechanically buttressed high aspect ratio zone plates: Fabrication and performance J. Vac. Sci. Technol. B 22, 3186 (2004); 10.1116/1.1815298
This article is copyrighted as indicated in the article. Reuse of AIP content is subject to the terms at: http://scitation.aip.org/termsconditions. Downloaded to IP: 140.113.38.11 On: Thu, 01 May 2014 01:42:32
30 nm resolution x-ray imaging at 8 keV using third order diffraction
of a zone plate lens objective in a transmission microscope
Gung-Chian Yina兲
National Synchrotron Radiation Research Center, 101 Hsin-Ann Road, Hsinchu 30076, Taiwan; Department of Photonics, National Chiao Tung University, Hsinchu 300, Taiwan; and Display Institute, National Chiao Tung University, Hsinchu 300, Taiwan
Yen-Fang Song, Mau-Tsu Tang, Fu-Rong Chen, and Keng S. Liang
National Synchrotron Radiation Research Center, 101 Hsin-Ann Road, Hsinchu 30076, Taiwan
Frederick W. Duewer, Michael Feser, and Wenbing Yun
Xradia Inc., 5052 Commercial Circle, Concord, California 94520
Han-Ping D. Shieh
Department of Photonics, National Chiao Tung University, Hsinchu 300, Taiwan and Display Institute, National Chiao Tung University, Hsinchu 300, Taiwan
共Received 22 August 2006; accepted 22 October 2006; published online 1 December 2006兲 A hard x-ray transmission microscope with 30 nm spatial resolution has been developed employing the third diffraction order of a zone plate objective. The microscope utilizes a capillary type condenser with suitable surface figure to generate a hollow cone illumination which is matched in illumination range to the numerical aperture of the third order diffraction of a zone plate with an outmost zone width of 50 nm. Using a test sample of a 150 nm thick gold spoke pattern with finest half-pitch of 30 nm, the authors obtained x-ray images with 30 nm resolution at 8 keV x-ray energy. © 2006 American Institute of Physics.关DOI:10.1063/1.2397483兴
The resolution of a full-field-type transmission x-ray microscope1–4 共TXM兲 mainly depends on the width of the outmost zones of the objective zone plate.5–8In the soft x-ray region共100 eV–1 keV兲, it has been reported that zone plate based TXM has achieved a spatial resolution of 15 nm,9 which is the highest resolution microscopic image demon-strated using electromagnetic radiation. Because of the de-crease of the refractive index with x-ray energy, a phase zone plate operating in the hard x-ray regime共⬎1 keV兲 requires a much larger thickness of the zone structures than for the soft x-ray regime to generate an adequate phase shift and there-fore practical focusing efficiency. The manufacture of a high resolution zone plate with small zone width operating in the hard x-ray regime is significantly more challenging, because the required aspect ratio 共defined as the ratio of the zone thickness to the zone width兲 is much larger. High spatial resolution requires narrow widths of the outmost zones, which correspond to a larger diffraction angle and therefore higher numerical aperture, which is still hard to fabricate in an ideal zone plate in hard x rays.10
By using higher order diffraction of a zone plate共such as the third diffraction order兲,7,11,12
the resolution of the x-ray microscope can be increased significantly, since the numeri-cal aperture of the zone plate increases proportionally to the diffraction order used. However, in the previous studies7,11,12 zone plates were used as a probe forming lens using coherent illumination, and not as microscope objectives in a full-field imaging geometry demonstrating the decrease in spot size and resolution. The increased resolution is also directly ap-plicable to full-field transmission x-ray microscopy, but has been hampered in the past by the fact that no suitable x-ray condensers were available to illuminate the objective zone plate with an appropriate hollow cone illumination that is
matched to the numerical aperture of the objective zone plate used in the third diffraction order. The use of zone plates as condenser lenses is impractical due to the loss of efficiency when used in the third diffraction order.
In this letter, we report a demonstration of effective uti-lization of the third diffraction order of a zone plate objective by using a capillary condenser to provide an illumination beam that is matched in numerical aperture to the zone plate objective.
The complex transmission function of a pure phase zone plate ZP共x,y兲 in the following equation is expanded with a modification according to that given by Schneider:1
ZP共x,y兲 = exp
冉
− i冉
1 2+ 2 m=1,3,5. . .兺
⬁ ⫻Cmsin冋
m共x2+ y2兲 f册
冊冊
. 共1兲 The cross section of the zone plate is assumed to be of rectangular shape, and can be regarded as composed of dif-ferent orders of lens with focus length of f / m. is the wave-length and f is the focus wave-length of the zone plate. The x andy are Cartesian coordinates, and this function describes the
phase retardation in two dimensions for a zone plate. The Cm
in the Eq.共1兲is equal to 1 / m for a rectangular shape of zone plate. The term 1 / 2 represents the zeroth order of the zone plate, and m = 1 , 3 , 5 , . . ., represents the first, third, fifth, and so on, harmonic, which give rise to the corresponding dif-fraction orders 共positive and negative兲. The higher the dif-fraction order, the shorter is the focal length, and the larger the numerical aperture共NA兲 becomes. The spatial resolution
␦ of the zone plate is given by ␦= K1/NA, where the K1
ranges from 0.3 to 0.61,9depending on the illumination con-dition. The described TXM has a hollow cone illumination corresponding to partially coherent imaging. Our
experi-a兲Electronic mail: [email protected]
APPLIED PHYSICS LETTERS 89, 221122共2006兲
0003-6951/2006/89共22兲/221122/3/$23.00 89, 221122-1 © 2006 American Institute of Physics
This article is copyrighted as indicated in the article. Reuse of AIP content is subject to the terms at: http://scitation.aip.org/termsconditions. Downloaded to IP: 140.113.38.11 On: Thu, 01 May 2014 01:42:32
ments, which are described below, show that the value of K1
achieved by our current setup is 0.45 using the first diffrac-tion order of the zone plate.
The NA of a zone plate can be written as NAzone plate= m/2⌬r,1where is the wavelength, ⌬r is the
outermost zone width of the zone plate, and m = 1 , 3 , 5, etc., the diffraction order of the zone plate. For optimized, par-tially coherent illumination conditions in the TXM, the value of K1can be as small as 0.3共Ref.9兲 such that the theoretical
spatial resolution of the third order image for optimized hol-low cone illumination becomes␦= 0.61⌬r/m. For a partially coherent illumination in our x-ray microscope, which uses a wider range of illumination angles, the value of K1has been
determined to be 0.45. Therefore the expected resolution us-ing the third diffraction order may be estimated to be
␦= 0.9⌬r/m. For the described x-ray microscope, we are us-ing the diffraction order m equal to 3, and ⌬r is 50 nm; hence the resolution for this hollow cone-beam system should be close to 15 nm spatial resolution.
The zone profile directly determines the diffraction effi-ciency of each diffraction order. In Eq. 共1兲, the Cm is the
weight coefficient of each spatial frequency into which the zone plate grating is decomposed and represents the relative weight of each diffraction order. Analogous to Eq. 共1兲, we can expand the zone plate profile function in a series as shown in Eq.共2兲, where the symbol h is the共constant兲 thick-ness of the zone plate and r is
冑
x2+ y2. As illustrated inFig.1and Eq.共2兲, each higher order term m that contributes to the series adds to the sharpness of the zone edge, which means, in turn, that higher order diffraction only appears if the edge of the zone is sharp enough.
ZPprofile,m共r兲 = h
冉
1 2+ 2 m=1,3,5. . .兺
⬁ 1 msin冋
mr2 f册
冊
, 共2兲 Figure1illustrates the variation of the zone profile slope for increasing diffraction orders m. The maximum slope de-pends on two parameters; the zone plate thickness h共900 nm for our case兲 and the outmost zone width ⌬r 共50 nm for our case兲. 共In fact, is the optimal phase shift for a perfect Fresnel phase zone plate, as indicated in Eq. 共1兲; it is thetrade-off betwen diffraction efficiency and resolution.兲 The first order diffraction efficiency of the zone plate used in our experiment is measured to be above 10% and the third order efficiency is around 1%. The zone plate we are employing has a total of 425 zones and a diameter of 85m.However, we show in the Fig.1images of a grating fabricated with the same processes as the zone plate, but having different param-eters. The image shows the profile of an outmost zone with the same aspect ratio of 18, and it can be seen that the slope of the edge appears to be sharper than what is required for third order imaging.
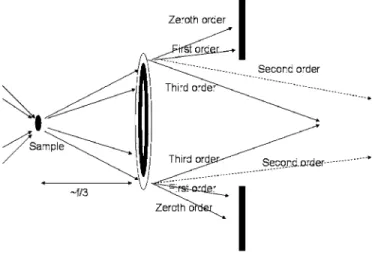
To achieve a third order imaging field free of other dif-fraction orders at the imaging plane, a suitable hollow cone illumination is used to match the numerical aperture of the zone plate used in the third diffraction order, as shown sche-matically in Fig.2. The source of our TXM is the same as a previous report.4Energy resolving power better than 1000 at 8 keV is employed to match the temporal coherence require-ment of the zone plate, which states that the resolving power of the monochromator must be equal or exceed the zone number of the objective zone plate times the used diffraction order, which is 1275 for third order.13The illumination cone angle ranges from 2.7 to 3.3 mrad generated by a capillary-based condenser with hyperbolic surface figure,14,15 produc-ing a focus at the sample position with a size of about 15m in diameter. The distance between sample and zone plate is close to one-third of the designed focal length of the first diffraction order, which is about 9 mm. The field of view is 5⫻5m2 in third order and the image distance is 1.2 m.
Thus, the x-ray optical magnification is about 135 times. A high-resolution x-ray detector based on a scintillator screen with optical coupling to a charge-coupled device camera is employed to detect the x-ray image.
The test sample for our experiments is a Siemens star of 150 nm thickness with finest structures of 30 nm, which is fabricated out of electroplated gold on a silicon nitride membrane.10This test sample exhibits an absorption of 6% 共Ref.16兲 in the gold features. This pattern is a spoke pattern,
which has a narrower linewidth in the inner part than in the outer part. The modulation transfer function9,17共MTF兲 of the FIG. 1. 共Color online兲 Left: The profile of the outmost zone of the zone
plate. The vertical and horizontal axes are both in nanometer but in different scales. The blue, green, and purple lines indicate the profile of the first order, third order, and fifth order of the zone plate, respectively. The red line is the mixture between the first order and third order. Right: A SEM image show-ing the cross section of a zone plate which has a similar aspect ratio as the zone plate used in the experiment. The comparison shows that the slope of the zone plate is sharper than required共blue lines兲.
FIG. 2. This is the setup of third order image. A condenser lens is used to focus the beam at sample position and generate a hollow cone beam which matches the numerical aperture of the third order of the zone plate. After the beam passes through the zone plate, it is then diffracted to several different orders. The third order image can be decoupled with low order image and the third order image, and the images of low orders are blocked by a pinhole before the detector.
221122-2 Yin et al. Appl. Phys. Lett. 89, 221122共2006兲
This article is copyrighted as indicated in the article. Reuse of AIP content is subject to the terms at: http://scitation.aip.org/termsconditions. Downloaded to IP: 140.113.38.11 On: Thu, 01 May 2014 01:42:32
microscope can be deduced by measuring the contrast as a function of linewidth. The images of first order and third order of this test sample are used to estimate the spatial reso-lution of using the first and third diffraction orders of the zone plate, as shown in Fig.3. Figures 3共b兲 and3共c兲show the same area with a field of view of 4.5⫻4.5m2in order
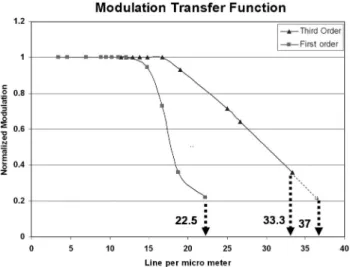
to have a clear comparison showing the enhancement of the spatial resolution. The inner line of the spoke pattern is clearly resolved in the third order image, but is fuzzy in the first order image. The third order image shows that the half-pitch of 30 nm is clearly resolved. In order to obtain the MTF of the images, the modulation is calculated by the Michelson fringe visibility, which is given by
=共Imax− Imin兲/共Imax+ Imin兲. The Michelson visibility is mea-sured in the different portions in images 3共b兲 and 3共c兲 for different spatial frequencies. After obtaining the visibility, the data are normalized with maximum visibility. The MTFs are plotted for both third and first order images as shown in Fig.4. The maximum modulation in the vertical axis is nor-malized to 6% of absorption. The cutoff frequency for the first order is found at 22.5 lines/m, which is close to 45 nm and this gives the formula␦= 0.9⌬r/m. However, the cutoff frequency of the third order cannot be measured in this plot, since the modulation does not reach the bottom of the verti-cal axis. The cutoff frequency is obviously beyond the 33 lines/m, which is the spatial resolution of 30 nm. The interception of extension of the MTF with the noise back-ground can be estimated as the spatial resolution of this TXM, which is about 37 lines/m, corresponding to a spa-tial resolution of 27 nm.
The exposure time for the image using third order is about 10 min and the exposure time of the image using first order is about 60 s. This is explained by the drop in diffrac-tion efficiency by a factor of 10 between first order and third order, which agrees well with the theoretical predictions.
In summary, the presented work takes advantage of us-ing a reflective capillary condenser with high reflection effi-ciency which generates a hollow cone illumination that is matched to the numerical aperture of the zone plate used in third diffraction order, decoupling contributions of the first and third diffraction orders in the image. The third order image of the zone plate in transmission x-ray microscope is at 8 keV and resolution is 30 nm.
The authors thank Chris Jacobsen for valuable discus-sion and the contribution of the analysis software for estima-tion of the microscope resoluestima-tion.
1Gerd Schneider, Ultramicroscopy 75, 85共1998兲.
2U. Neuhäusler, G. Schneider, W. Ludwig, and D. Hambach, J. Phys. D 36,
79共2003兲.
3W. Meyer-Ilse, H. Medecki, J. T. Brown, J. Heck, E. Anderson, C.
Magowan, A. Stead, T. Ford, R. Balhorn, C. Petersen, and D. T. Attwood,
X-ray Microscopy and Spectromicroscopy共Springer, Berlin, 1997兲.
4G. Yin, M. Tang, Y. Song, F. Chen, F. W. Duewer, W. Yun, C. Ko, H. D.
Shieh, and K. S. Liang, Appl. Phys. Lett. 88, 241115共2006兲.
5E. Di Fabrizio, F. Romanato, M. Gentili, S. Cabrini, B. Kaulich, J. Susini,
and R. Barrett, Nature共London兲 401, 895 共1999兲.
6B. Lai, W. B. Yun, D. Legnini, Y. Xiao, J. Chrzas, and P. J. Vidcaro,
Appl. Phys. Lett. 61, 1877共1992兲.
7W. Yun and B. Lai, Rev. Sci. Instrum. 70, 3537共1999兲.
8W. Yun, B. Lai, Z. Cai, J. Maser, D. Legnini, E. Gluskin, Z. Chen, A. A.
Krasnoperova, Y. Vladimirsky, F. Cerrina, E. Di Fabrizio, and M. Gentili, Rev. Sci. Instrum. 70, 2238共1999兲.
9W. Chao, B. D. Harteneck, J. Alexander Liddle, Erik H. Anderson, and
David T. Attwood, Nature共London兲 435, 1210 共2005兲.
10Xradia Inc., http://www.xradia.com
11A. Takeuchi, Y. Suzuki, and H. Takano, J. Synchrotron Radiat. 9, 115
共2002兲.
12Y. Suzuki, A. Takeuchi, H. Takano, and H. Takenaka, Jpn. J. Appl. Phys.
44, 1994共2005兲.
13M. Young, J. Opt. Soc. Am. 62, 972共1972兲.
14B. Murphy, D. L. White, Alastair A. MacDowell, and Obert R. Wood,
Appl. Opt. 32, 6920共1993兲.
15D. H. Bilderback, D. J. Thiel, R. Pahl, and K. E. Brister, J. Synchrotron
Radiat. 1, 37共1994兲.
16Center of X-ray Optics, http://www-cxro.lib.gov
17C. Jacobsen, S. Williams, E. Anderson, M. T. Browne, C. J. Buckley, D.
Kern, J. Kirz, M. Rivers, and X. Zhang, Opt. Commun. 86, 351共1991兲. FIG. 3. Spoke pattern are imaged under different image modes:共a兲 by first
order,共b兲 enlarged first third order, 共c兲 by third order, and 共d兲 by SEM. The area marked by a white square in Fig.2共a兲is the field of view of the third order image. The finest structure is in the center of the Siemens star. The third order image represents more details than the first order.
FIG. 4. Modulation transfer functions for third order and first order images. The resolution for first order is found to be 22.5 lines/m, which is the spatial resolution of 45 nm. The resolution for third order is estimated to be 37 lines/m, which is the spatial resolution of 27 nm.
221122-3 Yin et al. Appl. Phys. Lett. 89, 221122共2006兲
This article is copyrighted as indicated in the article. Reuse of AIP content is subject to the terms at: http://scitation.aip.org/termsconditions. Downloaded to IP: 140.113.38.11 On: Thu, 01 May 2014 01:42:32