行政院國家科學委員會補助專題研究計畫
□成果報告
ˇ
期中進度報告
內線交易微觀之研究:以台灣證券交易所為例
Insider Trading: A Bird’s View from the Taiwan Stock Market
計畫類別:ˇ 個別型計畫 □ 整合型計畫
計畫編號:NSC
97-2410-H-004-038-MY3
執行期間: 2008 年 8 月 1 日至 2011 年 07 月 31 日
計畫主持人:李怡宗
計畫參與人員: 余俊慶
成果報告類型(依經費核定清單規定繳交):ˇ精簡報告 □完整報告
本成果報告包括以下應繳交之附件:
□赴國外出差或研習心得報告一份
□赴大陸地區出差或研習心得報告一份
□出席國際學術會議心得報告及發表之論文各一份
□國際合作研究計畫國外研究報告書一份
處理方式:除產學合作研究計畫、提升產業技術及人才培育研究計畫、列管計
畫及下列情形者外,得立即公開查詢
□涉及專利或其他智慧財產權,□一年 ˇ二年後可公開查詢
執行單位:國立政治大學會計學系
中 華 民 國 98 年 5 月 31 日
內線交易微觀之研究:以台灣證券交易所為例
(第一年)
中文摘要
許多學者採用不同的資訊不對稱指標,探討有關內部人交易在財務市場中所扮演的角 色,但迄今為止實證結果的看法並不完全一致。本研究嘗試利用更為完整的交易資料,分 析內部人交易是否有資訊內容。過去研究多採用季或年的持股資料或是向SEC 報告的內部 人交易資訊進行研究,本研究嘗試結合交易所交易資料與上述兩種資料庫,放寬過去研究 在資料上的限制,期能對內部人交易資訊獲取更翔實的效果。本研究採取完整且即時的交 易資料,觀察到公司內部人交易確實與公司未來的股票報酬有關,而且對於小型股、價值 型股票、科技股等,公司內部人交易的資訊內涵較大。公司內部人交易的資訊內涵也會隨 著內部人的身份而不同,本研究指出持股 10%以上的大股東之交易行為尤其值得關注。 關鍵字:內部人交易、資訊傳遞、Insider Trading: A Bird’s View from the Taiwan Stock Market
Year I
Abstract
There is considerable controversy on the role of insider trading in the financial markets using different proxies of information asymmetry. Complementing to previous insider trading papers that do not have conclusive results on the informativeness of insider trading, this paper examines whether insider trading is informative by using more comprehensive data. Unlike the previous studies that just use the infrequent insider holdings data or reported insider trades, this paper tries to bridge the literature by integrating trading data with these two datasets. As a result, this paper finds that the informativeness of insiders’ trading does exist and that insiders’ net purchase has stronger impact on return for small stocks, value stocks, technology stocks, and later time period. Further, the information content of insider trading may differ due to different insider identity, especially for Block holders.
I. Introduction
The purpose of insider trading legislation is to protect the public investors from exploitation by insider trading and to promote the fairness of the market by prohibiting illegal gains. Information disclosure of insider trades is, therefore, usually treated as one of the effective solutions in protecting small investors and eliminating the use of information for personal advantage. Unfortunately, there is still considerable controversy on the role of insider trading in the financial markets using different proxies of information asymmetry.
Substantial studies have shown that insider trading is present around corporate announcements, yet it is an unknown question on whether insider trades are informative. If insider trading is motivated by private information, insider trading may pose a hurt to the fairness of financial markets. However, insider trading promotes market efficiency, and the tradeoff between efficiency and fairness of stock market results in one of the controversial aspects of insider trading regulations.
The enforcement of the ban on insider trading requires an evaluation of the capital gain from insider trading to examine if they do exploit the preferential information. Our paper contributes to the literature on several ways. Complementing to previous insider trading papers that do not have conclusive results on the informativeness of insider trading, the paper tries to explore whether insider trading is informative with more comprehensive data. Unlike the previous studies that use the infrequent insider holdings data or reported insider trades, this paper tries to bridge the literature by combining these two datasets. Our dataset is very comprehensive, in that we incorporate corporate insiders, large shareholders, and all insider institutions, and we include insider restricted activities.
The complete trade data from the Taiwan equity market between 1995 and 2005 help us address the aforementioned issues. The current data have the following advantages compared to the data used in the existing study. (1) The high-frequency data enable us to capture the private information more accurately; (2) The transaction information is private information to the market, as opposed to the disclosure data, which are public information; (3) The current data track trades made by close family members of insiders, which are not available in the previous data; (4) There is no time-lag or confounding effect in the timing of the trades.
Information disclosure is designed for protecting public investors from the exploitation of insider trading. However, regulation requiring insiders to publicly disclose their stock trades complicates the trading decisions of insiders. Since insider trading also promotes market efficiency, the main question to be asked is how much of insider information insiders should be requested to disclosure. Previous studies mainly focus on the effects of various regimes of mandatory information disclosure (Boot and Thakor (2001), Sunder (1992), and so forth). Information disclosure affects insiders’ information-acquisition incentives, and thus, it is unsolved whether insiders may steal their trades from the reported trades. It is a challenging task to solve the question empirically, because isolating reported insider trades from insider stealth trading based on private information is difficult. Accordingly, this paper would like to contribute the literature in the way of probing whether the existence of disclosure is effective.
Most studies on insider trading heavily rely on the position of a trader (e.g., company official or board member) or on disclosure data due to insider regulation to infer access to, and use of, such information. The insider position data are very infrequently, ranging from monthly to annually. While, the insider disclosure data do not include some of the insider trades (ex. trades with less than minimum shares, or purchase activities), and thus, may not completely include insider’s underlying intention. Therefore, few studies of insider trading have been conducted in which researchers can know for sure that traders used material, nonpublic information. In addition, infrequent data can mot accurately measure the timing of insider trading to infer its informativeness
Kyle (1985) provides a very famous model on the informational content of prices and the value of private information to an insider. Huddart, Hughes and Levine (2001) present an insider's equilibrium trading strategy in a multiperiod rational expectation framework. Some studies empirically test the value of insider trades using different proxies for insider trades. For example, Barclay and Warner (1993) content that use medium-size trades to measure stealth trades, and find that medium trades are more likely based on private information. Using greater bid-ask spreads to proxy for greater insider-trading risk, Acharya and Johnson (2007) find that there is significant private information in the credit default swap market.
Focusing on illegal insider trades, Meulbroek (1992) looks at an unexploited data on illegal insider trading. She finds that informed traders affect stock prices, and the abnormal return
averages 3% for an insider trading. Fishe and Robe (2004) examine insider trading using the trades of stock brokers who had advance copies of a stock analysis column in Business Week magazine. The results show that increases in price and volume occur after informed trades, and insider trading has a negative impact on market liquidity.
Most relevant literature relies on insider holdings or reported insider trades during a specific period of time as a measure of insider information, yet their results are still controversial for some extent. Seyhun (1986) documents that larger insider trades are associated with larger subsequent abnormal returns. Seyhun (1988) shows the predictive ability of aggregate insider trading using a sample of open market purchases and sales by corporate insiders. Piotroski and Roulstone (2004) document that insiders are contrarian and have superior information about future cash flows. Fidrmuc, Goergen and Renneboog (forthcoming, Journal of Finance) investigate the UK insider transactions, and find that ownership by directors and outside shareholders has an impact on the price movements. However, trades preceding news on mergers & acquisitions and CEO replacements contain significantly less information.
Standing in between, Huddart and Ke (2004) investigate the informativeness of insider trading, and they find that a component of insider trading is driven by insider’s information advantage over other market participants, though some insider trades are due to insider’s liquidity need and portfolio rebalancing purpose. Using the profitability and intensity of insider trades to proxy for information asymmetry, Frankel and Li (2004) find that the increases in analyst following and financial statement informativeness are associated with reduced profitability of insider trades and reduced insider purchases. However, company news, good or bad, is positively associated with insider purchase frequency.
In contrast, Eckbo and Smith (1998) use the change of monthly insider holdings from Oslo Stock Exchange to measure the performance of insider trading, and find that zero or negative abnormal performance by insiders. Huddart, Ke and Shi (2006) provide evidence that insiders avoid profitable trades before quarterly earnings are announced and sell (buy) after good (bad) news earnings announcements. Insiders trade most heavily after earnings announcements. Hillier and Marshall (2002) study the trading characteristics of UK company directors. The London Stock Exchange Model Code (1977) imposes a two-month close period prior to company earnings announcements where directors are banned from trading in their own firm's securities. Their results indicate that the close period is unable to affect their performance or distribution.
Irrespective of the period in which directors trade, they consistently earn abnormal returns.
Most prior research examines the association between insiders’ purchases and sales and subsequent stock returns in specific corporate events, using relatively short returns. Lakonishok and Lee (2001) examine insider trading activities on longer-horizon returns. They find insiders are contrarians and there is little price changes when insiders trade. Insiders have abilities to predict returns only for small firms, and the informativeness of insiders’ activities is coming from purchases, instead of sales. Based on their results, insiders contain private information only for small firms and when insiders purchase. If so, the thinking of benefiting from observing insider trading is very limited.
Since the usefulness of insider trading in predicting returns replies on long-term returns, it is desirable for further study on whether market participants can profit from knowing what insiders are doing. Lakonishok and Lee (2001) focus on corporate reported insider trades in a very comprehensive way, using insider trades data reported to the SEC for 21 years. However, their data do not include reports from insiders planning to sell restricted shares or the trades from any person who had acquired 5% or more of the stock of a public corporation. Besides, institutions, including commercial banks, brokers, investment banks, mutual funds, and so on, are not included in their sample since they are exempt from the reporting requirement. Therefore, it is a puzzle whether the regulations on reported insider trading may weaken the informativeness of insider trading. These inconsistent findings call for the importance of using trading information in a comprehensive way.
Specially, we focus on whether insider trading is informative, and whether the SEC disclose sufficient insiders trading information to the public. Our major research questions are listed as follows. Firstly, do insider trades convey information? We follow Lakonishok and Lee (2001) and construct order-flow information for companies and relate insider trading to future stock performance, at different horizons.
Secondly, do the current disclosure requirements fail to capture the information content of insider trades? Related to the first question mentioned above, but more emphasis on the methodological side, we pose the question whether there is difference in the results, depending whether we use the exchange level trading data or SEC-level disclosure data. Ideally, we will find that insider trades indeed forecast future stock returns using our data. This will contrast with the
existing JFI paper showing that public disclosure of insider trades has little impact on stock returns.
Third, the information content of trades made by various insiders will be investigated. There are existing studies discussing the relative information content of domestic vs. foreign investors at the exchange level. We can bridge the gap by investigating the trades by the more informed domestic and foreign investors.
II. Data
There are two primary data sources on insider trading in US stock market. ExeComp data include quarterly filings of corporate managers if they make significant changes to their holdings in their company stocks. Another source is the audit trail data made public by the S.E.C., which records sizeable transactions made by ‘insiders’ on all stocks. Insiders probably perceive that their trades are under the supervision of regulator. (Although it is not in real time.) Once they are sued for violating the rules of insider trading regulation, the records of their trades will be examined.
The public information about insiders' trades in Taiwan is quite similar to that in US. Insiders should publicly declare their sales (or donation) three days before their trading, if they attempt sell (or donate) more than ten lots in the future period. Note that it is only for sell side. It is no need to announce for their buy. And it is for some time period (at most 30 days), instead of exact date. It is announced if they attempt to do so, rather than when they really sell. Hence, when insiders trade, the public cannot get the information in time.
Furthermore, insiders should report their holdings to TSE each month. Investors can get the information in M.O.P.S. and annual report. But, in the public information the holdings of their relatives are reported quite few. And if the holdings of some insiders (or their relatives) is changed due to stock dividends, SEO, or capital reduction, such information may not be public available in time. Those kinds of data are collected by TEJ databank.
We identify insiders’ transactions from TSE trading data. This is quite important and can be a distinctive feature from the existing study/data (keep in mind the U.S. data is self-reported insider trading, i.e. they collect all trades subject to disclosure, but not the complete trade records). TEJ
data bank collects the monthly data of insider holdings which insider reported to the regulator. The change in monthly holdings should be equal to the net purchase of insiders trading, if no dividend stock issued. We aggregate the monthly net buy for each investor for each stock from TSE trading data files, so the time series of monthly net buy for each investor and for each stock are obtained. Then, match them with the changes of monthly holdings in TEJ databank for each insider for each stock. We count the number of the change in monthly holding equaling monthly net buy from transaction data. By comparing the fitness across investors, we select the one who the months of perfect match is
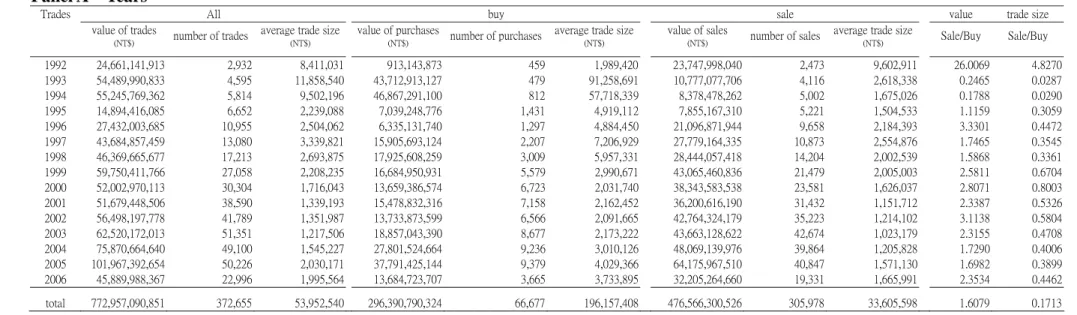
As a result, the summary statistics are shown in Table 1. From trade number, insiders’ sale is consistently more than their purchase over time. However, it does not mean that insiders’ holdings are reduced because they can increase their position from stock dividend during the sample period. Except for 1992, the trade size of insiders purchase is larger than that of their sale. In total, sale value is 1.6 times of purchase value and the trade size of sale is only 0.17% of purchase. It indicates that insiders submit larger order when they would like to buy.
We have calculated the number of insiders in one trading day (if insider traded) for each stock. The frequency distribution shows that the mean is 3.08, and median is 2, implying that insiders trade infrequently in the market. However, the maximum is 120, which means that at some specific period of time, insiders do trade very frequently. It is worthwhile noticing whether such trades of insiders contain any information.
In Table 1 Panel B, insiders’ trades are calculated for various firm-size groups and for B/M groups. Firm size and B/M are measured as Fama-French (1993). For whole samples, the smaller firm size, the larger the value of insiders’ trading. It is similar for insiders’ sale. For large firms, the value and trade number of insiders’ purchase is larger than those of insiders’ sale. But, for small firms, it is opposite. That is, the insiders’ tendency of sale is higher in smaller stocks than in larger stocks. When the stocks are classified based on B/M ratio, we find that the largest value of insiders’ purchase is occurred for low B/M stocks and that the largest value of insiders’ sale is happened for high B/M stocks. Also, for high (low) B/M firms, the value and trade number of insiders’ sale is more (less) than those of insiders’ purchase. In other words, the insiders’ tendency of sale is higher in high B/M stocks than in low B/M stocks.
trading of Board members or supervisors, Chairman or Vice Chairman of the board, President and Vice President, Senior Executives, Mid-level Managers and others, Block holders, and Institutions are analyzed. President and Vice President traded most frequently. Their trading value in total is the largest (NT$3.3E+11) during the sample period. It also is true for their purchase and sale. Since they own inside information of routing works, their trades may be caused by their information flow and then, may be informative. For every type of insiders, their sale is larger than their purchase. The sale/ buy ratio of Board members or supervisors is the highest among all types of insiders (9.71 and 6.28 in terms of value and trade number, respectively). Although the difference between sale and purchase of Mid-level Managers and others is the largest, their trading value, trades number, and average trade size are the smallest in total. The average trade size of block holders is the largest one. Especially when they purchase shares, their average trade size is NT$11,270,161.
III. The informativeness of insider trading
Regarding the analyses, we follow Lakonishok and Lee (2001) to construct transaction information for companies and relate insider trading to future stock performance, at various time horizons. To study the relationship between stock returns and insider trading, the average number of trades per month for a stock is calculated, by aggregating all insider trades from the exchange. Then, aggregate all insider trades for a firm within a quarter and calculate the Net Purchase Ratio (NPR) (in Lakonishok and Lee, 2001) for each stock.
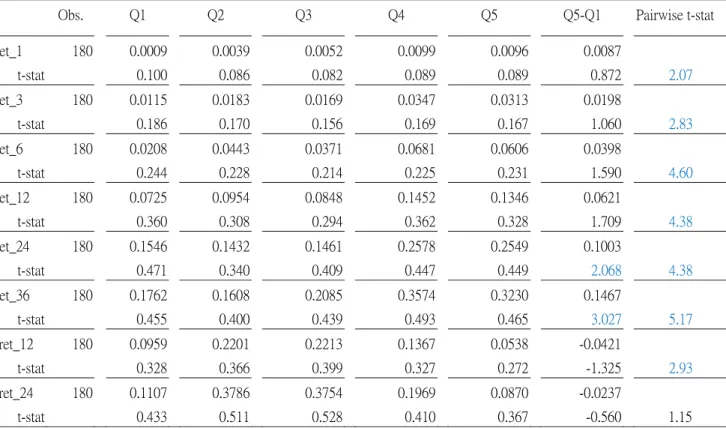
All insiders trading events are sorted into quintiles based on the NPR and the returns are calculated for the following 1-, 3-, 6-, 12-, 24-, and 36-month returns and for the preceeding 12- and24-month returns. The first quintile is the smallest NPR group and the fifth quintile is the largest NPR group. The returns are tested by t statistic for each quintile. Also, the difference of returns between the fifth quintile and the first quintile is tested. We expect to observe a positive relationship between NPR and future long-term returns.
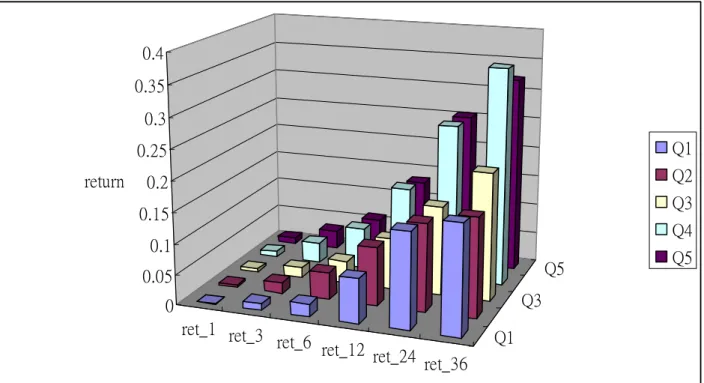
In Table 2, for each kind of after-event returns, the highest return usually happens on the fourth quintile. The after-event returns of the fifth quintile are significantly higher than those of the first quintile. That implies that the net purchase of insiders is positively related to the after-event return and insiders trading is informative for future returns, even three years later. In Figure 1, we
can find that the following returns are increased with the time horizon.
The subtlety here is previous studies establish that insider trades are contrarian, so we need examine whether the investor trades net of past returns can predict future returns. However, the proceeding 12-month return for the fifth quintile is less than that for the fifth quintile. It seems to provide an evidence on that insiders buy their own company when market under-estimates their company. And after their buy, the stock price is consistently raised up for a long time period.
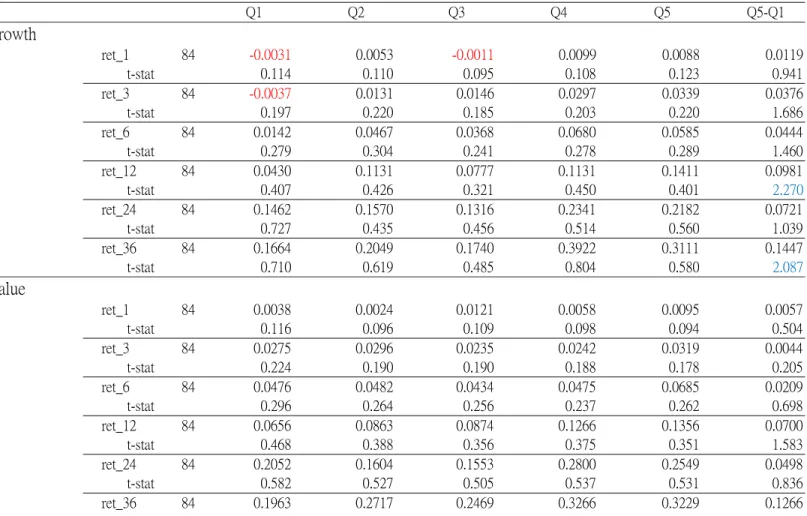
Whether the informativeness differs in various firm characteristics is examined in Table 3. In Panel A, firms are classified into growth stocks and value stocks. In Panel B, firms are classified into large firms and small firms. In Panel C, firms are classified into technology firms and non-technology firms. Again, for each kind of stocks in Panel A, B, and C, all insiders trading events are sorted into five quintile groups according to NPR. As a result, the difference of the following 36-month return between the fifth quintile and the first quintile is significant for both growth stocks and value stocks. In addition, the significant difference occurs since the following 12-month (6-month) returns for both large stocks and small stocks (technology stocks and non-technology stocks). These evidences show that the informativeness of insiders trading does not differ due to firm characteristics.
In Table 4, the events of insiders trading are classified into several groups based on whether it is growth stock or value stock, whether it is large firm or small firm, whether it is technology firm or not and whether it happened during the period from 1992 to 1998 on from 1999 to 2006. Then, for each group, Fama-McBeth regressions are executed. In each regression, returns are regressed on NPR, following 12-month return, following 24-month return, log of MB ratio, and log of firm size. This is essentially, which is known to be able to take account of some contemporaneous correlation in returns, which will inflate the t-stat and statistical significance. We take the coefficient from the regression each month and then calculate the average and t-statistics for each coefficient.
Without surprise, the coefficients of NPR are significantly positive for all samples and classified groups (except for the period from 1992 to 1998). Further, the mean of coefficient for small stocks, value stocks, technology stocks, and later time period is higher than that for large stock, growth stocks, non-technology stocks, and earlier time period, respectively. It means that insiders’ NPR has stronger impact on return for small stocks, value stocks, technology stocks, and
later time period. From the viewpoint of time period, since the regulation get stricter for later period, insider trading may cause more price impact under such circumstance.
IV. The relative information content of various insiders.
Are all kinds of insiders same informative? Whose trading is more related to more recent information? We can separate the performance by different types of insiders, given the richness of the data. There are extant studies investigating the relative information content of domestic vs. foreign investors at the exchange level. We can bridge the gap by discussing the trades by the various types of insiders. In our data, insiders can be classified into seven types, which are Board members or supervisors (type 1), Chairman or Vice Chairman of the board (type 2), President and Vice President (type 3), Senior Executives (type 4), Mid-level Managers and others (type 5), Block holders (type 6), and Institutions (type 7). Unlike to Lakonishok and Lee (2001), we do not exclude the trading data of institutional insider. Insiders trading are grouped based on the types of insiders.
In Table 5, for each group, all insiders trading events are separated into five groups according to NPR. The first quintile is the smallest NPR group and the fifth quintile is the largest NPR group. The 1-, 3-, 6-, 12-, 24-, and 36-month return after insiders trading are examined by t test for each quintile. Also, the difference between the fifth quintile and the first quintile is tested. Based on pairwise t test, for insiders trading by Chairman or Vice Chairman of the board (type 2) and Senior Executives (type 4), the difference between the fifth quintile and the first quintile is significant since the following 3-month return. However, for insider trading by President and Vice President (type 3) and Block holders (type 6), the significant differences are occurred since the following 6-month return. For 36-month return, the largest difference is 0.3338 for Block holders (type 6). And the trading of Board members or supervisors (type 1) related to the following 36-month return. In other words, the informativeness exists for all types of insider trading. The trading of Chairman or Vice Chairman of the board (type 2) and Senior Executives (type 4) may be related to more recent information (three months), but the information of trading by Board members or supervisors (type 1) is associated with return on longer time horizon (36 months).
Fama-McBeth regressions are executed. In each regression, returns are regressed on NPR, proceeding12-month return, proceeding 24-month return, log of MB ratio, and log of firm size. As shown in the table, all coefficients are positive. Except for Chairman or Vice Chairman of the board (type 2) and Institutions (type 7), all coefficients are significant. And the trading by Board members or supervisors (type 1) and Block holders (type 6) have more impact on the return than others. The market takes more attention on their trading.
V. Conclusion
Although there is inconclusive on whether corporate insiders are informative, most financial markets impose insiders to reveal their trades such that the disclosure on corporate insiders trading will enforce them from taking advantage via information flow. Previous studies mainly focus on the effects of various regimes of mandatory information disclosure. It is unsolved whether insiders may steal their trades from the reported trades in the long run. The task is challenging to investigate empirically because isolating reported insider trades from insider stealth trading based on private information is difficult.
The project distinguishes itself from most of extant studies (with the exception of Meulbreuk) in that it uses real insider trading records, instead of insider disclosure or ex-post record of insiders who were found to have engaged in insider trading. The most fundamental question that we are trying to answer is whether insider trading can forecast future stock returns. This is different from the question that Lakonishok and Lee (2001) tried to answer. That is, whether disclosure of insider trading information convey information. So the key difference lies in that they utilize delayed, yet public information while we use proprietary information.
As a result, this study provides empirical evidence on the informativeness of insider trading. The results consistently show that insiders’ trading related to future stock returns. Unlike to Lakonishok and Lee (2001), this paper further finds the trading of institutional insiders also has information. Insiders’ net purchase has stronger impact on return for small stocks, value stocks, technology stocks, and later time period. Since the trading of Block holders is related to the return since 6 month later and has more impact on stock return, the regulator should pay more attention on their trading.
trading may cause more price impact under such circumstance. Even though an investor cannot follow our strategy and make money, we believe that this research can make a convincing case that we add to the debate regarding whether insider trading conveys information in a broader setting. In the future study, it is worthwhile to do research on stealth trading and substitution trading.
Another thing to be worthwhile to be examined is to aggregate the exchange-level data onto monthly and compare the trading frequency of the exchange data with the TEJ data. In this paper, we find that insider trading indeed forecasts future stock returns using TSE transaction data. This contrast with the existing JFI paper showing that public disclosure of insider trades has little impact on stock returns. This gives us a rough sense about how much information is missing from the public information, which is collected in TEJ databank. Related to this point, but more emphasis on the methodological side, we will pose the question whether there is difference in the results of informativeness, depending on using the exchange level trading data or using SEC-level disclosure data, by comparing the information content of the trade-level data versus the monthly disclosure data.
References:
Acharya, V.V., and T.C. Johnson, 2007. Insider Trading in Credit Derivatives. Journal of
Financial Economics 84 (1), 110-141.
Barclay, M.J., and J.B. Warner, 1993. Stealth Trading and Volatility. Journal of Financial
Economics 34, 281-305.
Boot, A., and A. Thakor, 2001. The Many Faces of Information Disclosure. Review of Financial
Studies 14, 1021-1057.
Eckbo, B.E., and D.C. Smith, 1998. The Conditional Performance of Insider Trades. The Journal
of Finance 53 (2), 467-498.
Fidrmuc, Jana P., Marc Goergen, and Luc Renneboog, 2006. Insider Trading, News Releases, and Ownership Concentration. Journal of Finance 61, 2931-2973.
Fishe, Raymond, and Michel Robe, 2004. The Impact of Illegal Insider Trading in Dealer and Specialist Markets: Evidence from a Natural Experiment. Journal of Financial Economics 71 (3), 461-488.
Frankel, Richard, and Xu Li, 2004. Characteristics of a Firm’s Information Environment and the Information Asymmetry between Insiders and Outsiders. Journal of Accounting and
Economics 37, 229-259.
Hillier, D., and A.P. Marshall, 2002. Are Trading Bans Effective? Exchange Regulation and Corporate Insider Transactions around Earnings Announcements. Journal of Corporate Finance 8 (4), 393-410.
Huddart, S., J.S. Hughes, and C. B. Levine, 2001. Public Disclosure and Dissimulation of Insider Trades. Econometrica 69, 665-681.
Huddart, Steven, and Bin Ke, 2004. How Informed Are Actively Trading Institutional Investors? Evidence from Their Trading Behavior before a Break in a String of Consecutive Earnings Increases. Journal of Accounting Research 42 (5), 895-927.
Huddart, S., B. Ke, and C. Shi, 2006. Jeopardy, Non-public Information, and Insider Trading around SEC 10-K and 10-Q Filings. Journal of Accounting and Economics 43 (1), 3-36. Kyle, Albert S., 1985. Continuous Auctions and Insider Trading. Econometrica 53, 1315-1336. Meulbroek, Lisa, 1992. An Empirical Analysis of Illegal Insider Trading. Journal of Finance 47, 1661-1699.
Lakonishok, J., and I. Lee, 2001. Are Insider Trades Informative? The Review of Financial
Studies 14(1), 79-111.
Piotroski, J., and D. Roulstone, 2004. The Influence of Analysts, Institutional Investors, and Insiders on the Incorporation of Market, Industry, and Firm-Specific Information into Stock Prices. The Accounting Review 79, 1119-1151.
Seyhun, H. Nejat, 1986. Insiders’ Profits, Costs of Trading, and Market Efficiency. Journal of
Financial Economics 16 (2), 189-212.
Seyhun, H. Nejat, 1988. The Information Content of Aggregate Insider Trading. Journal of
Business 61,1-24.
Sunder, Shyam, 1992. Market for Information: Experimental Evidence. Econometrica 60, 667-695.
Figure 1 The Returns of Various NPR Groups
NPR is the net purchase ratio as in Lakonishok and Lee (2001). All insiders trading events are sorted into quintile according to NPR. The first quintile is the smallest NPR group and the fifth quintile is the largest NPR group. The one-, 3-, 6-, 12-, 24-, and 36-month returns after insiders trading are examined for each quintile.
ret_1 ret_3 ret_6 ret_12 ret_24 ret_36 Q1 Q3 Q5 0 0.05 0.1 0.15 0.2 0.25 0.3 0.35 0.4 return Q1 Q2 Q3 Q4 Q5
Table 1 Summary Statistics of Insider Trading in terms of Trading Volume and Trading Number
In Panel A, the value and number of insiders’ trading (buy and sale) are shown for each year. In Panel B, insiders’ trades are calculated for various firm-size groups and for B/M groups. Firm size and B/M are measured as Fama-French (1993). In Panel C; insiders’ trades are presented for seven types of insiders, which are Board members or supervisors, Chairman or Vice Chairman of the board, President and Vice President, Senior Executives, Mid-level Managers and others, Block holders, and Institutions.
Panel A Years
Trades All buy sale value trade size value of trades
(NT$) number of trades average trade size(NT$)
value of purchases
(NT$) number of purchases
average trade size
(NT$)
value of sales
(NT$) number of sales
average trade size
(NT$) Sale/Buy Sale/Buy 1992 24,661,141,913 2,932 8,411,031 913,143,873 459 1,989,420 23,747,998,040 2,473 9,602,911 26.0069 4.8270 1993 54,489,990,833 4,595 11,858,540 43,712,913,127 479 91,258,691 10,777,077,706 4,116 2,618,338 0.2465 0.0287 1994 55,245,769,362 5,814 9,502,196 46,867,291,100 812 57,718,339 8,378,478,262 5,002 1,675,026 0.1788 0.0290 1995 14,894,416,085 6,652 2,239,088 7,039,248,776 1,431 4,919,112 7,855,167,310 5,221 1,504,533 1.1159 0.3059 1996 27,432,003,685 10,955 2,504,062 6,335,131,740 1,297 4,884,450 21,096,871,944 9,658 2,184,393 3.3301 0.4472 1997 43,684,857,459 13,080 3,339,821 15,905,693,124 2,207 7,206,929 27,779,164,335 10,873 2,554,876 1.7465 0.3545 1998 46,369,665,677 17,213 2,693,875 17,925,608,259 3,009 5,957,331 28,444,057,418 14,204 2,002,539 1.5868 0.3361 1999 59,750,411,766 27,058 2,208,235 16,684,950,931 5,579 2,990,671 43,065,460,836 21,479 2,005,003 2.5811 0.6704 2000 52,002,970,113 30,304 1,716,043 13,659,386,574 6,723 2,031,740 38,343,583,538 23,581 1,626,037 2.8071 0.8003 2001 51,679,448,506 38,590 1,339,193 15,478,832,316 7,158 2,162,452 36,200,616,190 31,432 1,151,712 2.3387 0.5326 2002 56,498,197,778 41,789 1,351,987 13,733,873,599 6,566 2,091,665 42,764,324,179 35,223 1,214,102 3.1138 0.5804 2003 62,520,172,013 51,351 1,217,506 18,857,043,390 8,677 2,173,222 43,663,128,622 42,674 1,023,179 2.3155 0.4708 2004 75,870,664,640 49,100 1,545,227 27,801,524,664 9,236 3,010,126 48,069,139,976 39,864 1,205,828 1.7290 0.4006 2005 101,967,392,654 50,226 2,030,171 37,791,425,144 9,379 4,029,366 64,175,967,510 40,847 1,571,130 1.6982 0.3899 2006 45,889,988,367 22,996 1,995,564 13,684,723,707 3,665 3,733,895 32,205,264,660 19,331 1,665,991 2.3534 0.4462 total 772,957,090,851 372,655 53,952,540 296,390,790,324 66,677 196,157,408 476,566,300,526 305,978 33,605,598 1.6079 0.1713
Panel B Firm Characteristics
All Buy Sell
value of trades
(NT$) number of trades
average trade size (NT$)
value of purchases
(NT$) number of purchases
average trade size (NT$)
value of sales
(NT$) number of sales
average trade size (NT$) Large 1.11E+11 100,354 1,102,002 6.67E+10 21,009 3,173,719 4.39E+10 79,345 553,452 Medium 1.94E+11 142,890 1,359,038 6.03E+10 21,591 2,791,925 1.34E+11 121,299 1,103,986 Small 4.68E+11 129,398 3,617,468 1.69E+11 24,069 7,037,113 2.99E+11 105,329 2,836,036
Low B/M 2.61E+11 119,509 2,187,701 1.61E+11 28,552 5,642,733 1.00E+11 90,957 1,103,144 Medium B/M 2.40E+11 147,405 1,628,817 7.74E+10 27,452 2,818,210 1.63E+11 119,953 1,356,617 High B/M 2.71E+11 105,728 2,566,307 5.79E+10 10,665 5,424,903 2.13E+11 95,063 2,245,605
Panel C The Types of Insiders
All Buy Sell value number value of trades
(NT$) number of trades average trade size(NT$)
value of purchases
(NT$) number of purchases average trade size(NT$)
value of sales
(NT$) number of sales average trade size(NT$) Sell/Buy Sell/Buy
Board members or supervisors 4.11E+10 79,672 515,526 3.83E+09 10,940 350,436 3.72E+10 68,732 541,803 9.71 6.28
Chairman or Vice Chairman of the board 1.12E+11 51,006 2,187,971 3.19E+10 10,494 3,039,829 7.97E+10 40,512 1,967,311 2.50 3.86
President and Vice President 3.33E+11 133,580 2,493,250 1.52E+11 21,913 6,947,854 1.81E+11 111,667 1,619,100 1.19 5.10 Senior Executives 8.92E+10 44,794 1,992,053 3.05E+10 7,210 4,223,663 5.88E+10 37,584 1,563,948 1.93 5.21 Mid-level Managers and others 1.03E+10 19,169 539,884 2.22E+09 4,028 551,716 8.13E+09 15,141 536,736 3.66 3.76 Block holders 1.48E+11 19,972 7,397,884 6.37E+10 5,648 11,270,161 8.41E+10 14,324 5,871,033 1.32 2.54 Institutions 3.99E+10 24,462 1,631,284 1.21E+10 6,444 1,874,602 2.78E+10 18,018 1,544,263 2.30 2.80
Table 2 The Returns across NPR Groups
NPR is the net purchase ratio as in Lakonishok and Lee (2001). All insiders trading events are sorted into quintile according to NPR. The first quintile is the smallest NPR group and the fifth quintile is the largest NPR group. The one-, 3-, 6-, 12-, 24-, and 36-month returns after insiders trading are tested by t statistic for each quintile. Also, the 12- and 24-month returns before insiders’ trading are examined. Also, the difference of returns between the fifth quintile and the first quintile is tested.
Obs. Q1 Q2 Q3 Q4 Q5 Q5-Q1 Pairwise t-stat
ret_1 180 0.0009 0.0039 0.0052 0.0099 0.0096 0.0087 t-stat 0.100 0.086 0.082 0.089 0.089 0.872 2.07 ret_3 180 0.0115 0.0183 0.0169 0.0347 0.0313 0.0198 t-stat 0.186 0.170 0.156 0.169 0.167 1.060 2.83 ret_6 180 0.0208 0.0443 0.0371 0.0681 0.0606 0.0398 t-stat 0.244 0.228 0.214 0.225 0.231 1.590 4.60 ret_12 180 0.0725 0.0954 0.0848 0.1452 0.1346 0.0621 t-stat 0.360 0.308 0.294 0.362 0.328 1.709 4.38 ret_24 180 0.1546 0.1432 0.1461 0.2578 0.2549 0.1003 t-stat 0.471 0.340 0.409 0.447 0.449 2.068 4.38 ret_36 180 0.1762 0.1608 0.2085 0.3574 0.3230 0.1467 t-stat 0.455 0.400 0.439 0.493 0.465 3.027 5.17 lret_12 180 0.0959 0.2201 0.2213 0.1367 0.0538 -0.0421 t-stat 0.328 0.366 0.399 0.327 0.272 -1.325 2.93 lret_24 180 0.1107 0.3786 0.3754 0.1969 0.0870 -0.0237 t-stat 0.433 0.511 0.528 0.410 0.367 -0.560 1.15
Table 3 The Returns across NPR groups under Various Firm Characteristics
In Panel A, firms are classified into growth stocks and value stocks. In Panel B, firms are classified into large firms and small firms. In Panel C, firms are classified into technology firms and non-technology firms. For each kind of stocks in Panel A, B, and C, all insiders trading events are sorted into five groups according to NPR. The first quintile is the smallest NPR group and the fifth quintile is the largest NPR group. The 1-, 3-, 6-, 12- 24-, and 36-month returns after insiders trading are examined by t test for each quintile. Also, the difference of returns between the fifth quintile and the first quintile is tested.
Panel A Growth Stocks vs. Value Stocks
Q1 Q2 Q3 Q4 Q5 Q5-Q1 Growth ret_1 84 -0.0031 0.0053 -0.0011 0.0099 0.0088 0.0119 t-stat 0.114 0.110 0.095 0.108 0.123 0.941 ret_3 84 -0.0037 0.0131 0.0146 0.0297 0.0339 0.0376 t-stat 0.197 0.220 0.185 0.203 0.220 1.686 ret_6 84 0.0142 0.0467 0.0368 0.0680 0.0585 0.0444 t-stat 0.279 0.304 0.241 0.278 0.289 1.460 ret_12 84 0.0430 0.1131 0.0777 0.1131 0.1411 0.0981 t-stat 0.407 0.426 0.321 0.450 0.401 2.270 ret_24 84 0.1462 0.1570 0.1316 0.2341 0.2182 0.0721 t-stat 0.727 0.435 0.456 0.514 0.560 1.039 ret_36 84 0.1664 0.2049 0.1740 0.3922 0.3111 0.1447 t-stat 0.710 0.619 0.485 0.804 0.580 2.087 Value ret_1 84 0.0038 0.0024 0.0121 0.0058 0.0095 0.0057 t-stat 0.116 0.096 0.109 0.098 0.094 0.504 ret_3 84 0.0275 0.0296 0.0235 0.0242 0.0319 0.0044 t-stat 0.224 0.190 0.190 0.188 0.178 0.205 ret_6 84 0.0476 0.0482 0.0434 0.0475 0.0685 0.0209 t-stat 0.296 0.264 0.256 0.237 0.262 0.698 ret_12 84 0.0656 0.0863 0.0874 0.1266 0.1356 0.0700 t-stat 0.468 0.388 0.356 0.375 0.351 1.583 ret_24 84 0.2052 0.1604 0.1553 0.2800 0.2549 0.0498 t-stat 0.582 0.527 0.505 0.537 0.531 0.836 ret_36 84 0.1963 0.2717 0.2469 0.3266 0.3229 0.1266
t-stat 0.538 0.669 0.607 0.610 0.637 2.009
Panel B Large Firm vs. Small Firms
Q1 Q2 Q3 Q4 Q5 Q5-Q1 Large ret_1 84 0.0031 0.0102 0.0080 0.0078 0.0113 0.0082 t-stat 0.106 0.112 0.109 0.096 0.097 0.755 ret_3 84 0.0148 0.0294 0.0229 0.0292 0.0276 0.0128 t-stat 0.189 0.214 0.184 0.168 0.160 0.683 ret_6 84 0.0388 0.0484 0.0437 0.0487 0.0725 0.0338 t-stat 0.253 0.314 0.236 0.229 0.213 1.350 ret_12 84 0.0570 0.0555 0.1008 0.1405 0.1533 0.0964 t-stat 0.380 0.435 0.356 0.319 0.301 2.629 ret_24 84 0.0665 0.1973 0.1520 0.2659 0.2112 0.1447 t-stat 0.425 0.482 0.488 0.419 0.372 3.388 ret_36 84 0.0972 0.2336 0.1142 0.3607 0.2625 0.1652 t-stat 0.453 0.660 0.495 0.494 0.408 3.586 Small ret_1 84 0.0028 0.0047 0.0098 0.0133 0.0081 0.0053 t-stat 0.103 0.119 0.119 0.110 0.108 0.470 ret_3 84 0.0152 0.0269 0.0156 0.0400 0.0335 0.0183 t-stat 0.188 0.232 0.214 0.209 0.216 0.845 ret_6 84 0.0186 0.0697 0.0485 0.0594 0.0587 0.0401 t-stat 0.240 0.337 0.299 0.278 0.284 1.427 ret_12 84 0.0559 0.0633 0.1274 0.1283 0.1475 0.0916 t-stat 0.345 0.508 0.466 0.523 0.417 2.238 ret_24 84 0.1306 0.3464 0.2044 0.2146 0.2634 0.1328 t-stat 0.448 0.809 0.633 0.665 0.579 2.399 ret_36 84 0.1440 0.3533 0.2928 0.3383 0.3470 0.2030 t-stat 0.457 0.746 0.694 0.842 0.672 3.304
Panel C Technology Firm vs. Non-technology Firm
Technology ret_1 84 0.0055 0.0138 0.0075 0.0142 0.0155 0.0100 t-stat 0.109 0.115 0.113 0.108 0.116 0.827 ret_3 84 0.0164 0.0272 0.0360 0.0581 0.0378 0.0214 t-stat 0.188 0.233 0.221 0.229 0.224 0.965 ret_6 84 0.0246 0.6689 0.0716 0.1108 0.1041 0.0795 t-stat 0.254 0.344 0.303 0.322 0.348 2.442 ret_12 84 0.0365 0.1591 0.1845 0.2540 0.2095 0.1729 t-stat 0.391 0.574 0.495 0.648 0.522 3.507 ret_24 84 0.0667 0.2060 0.3616 0.4405 0.3813 0.3145 t-stat 0.445 0.697 0.812 0.792 0.713 4.953 ret_36 84 0.0566 0.3028 0.4592 0.6882 0.6021 0.5455 t-stat 0.424 0.812 0.948 1.184 0.979 6.767 Non Technology ret_1 84 -0.0012 -0.0049 0.0061 0.0070 0.0096 0.0108 t-stat 0.086 0.096 0.092 0.089 0.092 1.137 ret_3 84 0.0050 -0.0054 0.0159 0.0253 0.0322 0.0272 t-stat 0.152 0.176 0.166 0.160 0.171 1.572 ret_6 84 0.0023 0.0090 0.0273 0.0512 0.0565 0.0542 t-stat 0.208 0.251 0.215 0.211 0.232 2.299 ret_12 84 0.0390 0.0462 0.0738 0.0995 0.1228 0.0838 t-stat 0.303 0.363 0.313 0.303 0.331 2.474 ret_24 84 0.0921 0.0835 0.1327 0.1820 0.2323 0.1402 t-stat 0.416 0.467 0.442 0.432 0.458 2.996 ret_36 84 0.1316 0.1434 0.1525 0.2454 0.2756 0.1440 t-stat 0.444 0.581 0.451 0.509 0.503 2.839
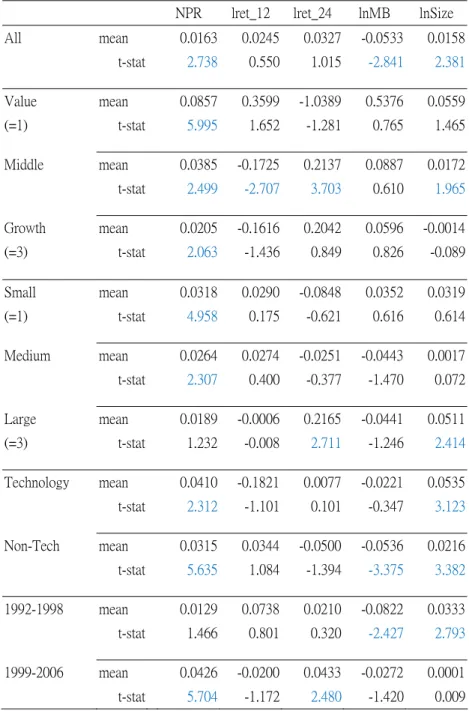
Table 4 The Regression on NPR for Various Firm Characteristics and Time Periods
The events of insiders trading are classified into several groups based on whether it is growth stock or value stock, whether it is large firm or small firm, whether it is technology firm or not and whether it happened during the period from 1992 to 1998 on from 1999 to 2006. Then, for each group, Fama-McBeth regressions are executed. In each regression, returns are regressed on NPR, 12-month lag return, 24-month lag return, log of MB ratio, and log of firm size.
NPR lret_12 lret_24 lnMB lnSize
All mean 0.0163 0.0245 0.0327 -0.0533 0.0158 t-stat 2.738 0.550 1.015 -2.841 2.381 Value mean 0.0857 0.3599 -1.0389 0.5376 0.0559 (=1) t-stat 5.995 1.652 -1.281 0.765 1.465 Middle mean 0.0385 -0.1725 0.2137 0.0887 0.0172 t-stat 2.499 -2.707 3.703 0.610 1.965 Growth mean 0.0205 -0.1616 0.2042 0.0596 -0.0014 (=3) t-stat 2.063 -1.436 0.849 0.826 -0.089 Small mean 0.0318 0.0290 -0.0848 0.0352 0.0319 (=1) t-stat 4.958 0.175 -0.621 0.616 0.614 Medium mean 0.0264 0.0274 -0.0251 -0.0443 0.0017 t-stat 2.307 0.400 -0.377 -1.470 0.072 Large mean 0.0189 -0.0006 0.2165 -0.0441 0.0511 (=3) t-stat 1.232 -0.008 2.711 -1.246 2.414 Technology mean 0.0410 -0.1821 0.0077 -0.0221 0.0535 t-stat 2.312 -1.101 0.101 -0.347 3.123 Non-Tech mean 0.0315 0.0344 -0.0500 -0.0536 0.0216 t-stat 5.635 1.084 -1.394 -3.375 3.382 1992-1998 mean 0.0129 0.0738 0.0210 -0.0822 0.0333 t-stat 1.466 0.801 0.320 -2.427 2.793 1999-2006 mean 0.0426 -0.0200 0.0433 -0.0272 0.0001 t-stat 5.704 -1.172 2.480 -1.420 0.009
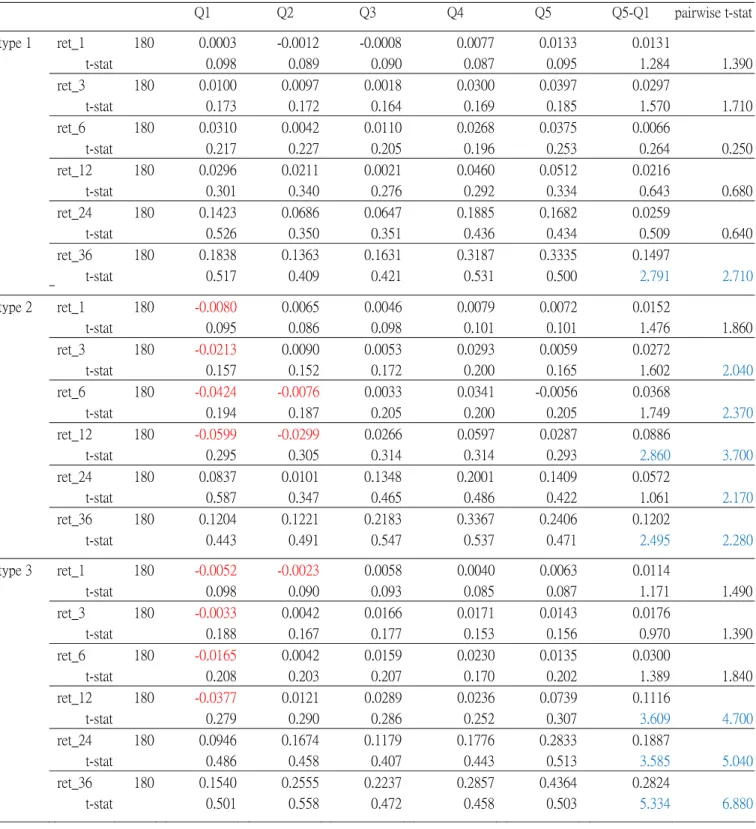
Table 5 The Returns across NPR groups for Each Type of Insiders
Insiders are classified into seven types, which are Board members or supervisors (type 1), Chairman or Vice Chairman of the board (type 2), President and Vice President (type 3), Senior Executives (type 4), Mid-level Managers and others (type 5), Block holders (type 6), and Institutions (type 7). Insiders trading are grouped based on the types of insiders. For each group, all insiders trading events are separated into five groups according to NPR. The first quintile is the smallest NPR group and the fifth quintile is the largest NPR group. The 1-, 3-, 6-, 12-, 24-, and 36-month return after insiders trading are examined by t test for each quintile. Also, the difference between the fifth quintile and the first quintile is tested.
Q1 Q2 Q3 Q4 Q5 Q5-Q1 pairwise t-stat type 1 ret_1 180 0.0003 -0.0012 -0.0008 0.0077 0.0133 0.0131 t-stat 0.098 0.089 0.090 0.087 0.095 1.284 1.390 ret_3 180 0.0100 0.0097 0.0018 0.0300 0.0397 0.0297 t-stat 0.173 0.172 0.164 0.169 0.185 1.570 1.710 ret_6 180 0.0310 0.0042 0.0110 0.0268 0.0375 0.0066 t-stat 0.217 0.227 0.205 0.196 0.253 0.264 0.250 ret_12 180 0.0296 0.0211 0.0021 0.0460 0.0512 0.0216 t-stat 0.301 0.340 0.276 0.292 0.334 0.643 0.680 ret_24 180 0.1423 0.0686 0.0647 0.1885 0.1682 0.0259 t-stat 0.526 0.350 0.351 0.436 0.434 0.509 0.640 ret_36 180 0.1838 0.1363 0.1631 0.3187 0.3335 0.1497 t-stat 0.517 0.409 0.421 0.531 0.500 2.791 2.710 type 2 ret_1 180 -0.0080 0.0065 0.0046 0.0079 0.0072 0.0152 t-stat 0.095 0.086 0.098 0.101 0.101 1.476 1.860 ret_3 180 -0.0213 0.0090 0.0053 0.0293 0.0059 0.0272 t-stat 0.157 0.152 0.172 0.200 0.165 1.602 2.040 ret_6 180 -0.0424 -0.0076 0.0033 0.0341 -0.0056 0.0368 t-stat 0.194 0.187 0.205 0.200 0.205 1.749 2.370 ret_12 180 -0.0599 -0.0299 0.0266 0.0597 0.0287 0.0886 t-stat 0.295 0.305 0.314 0.314 0.293 2.860 3.700 ret_24 180 0.0837 0.0101 0.1348 0.2001 0.1409 0.0572 t-stat 0.587 0.347 0.465 0.486 0.422 1.061 2.170 ret_36 180 0.1204 0.1221 0.2183 0.3367 0.2406 0.1202 t-stat 0.443 0.491 0.547 0.537 0.471 2.495 2.280 type 3 ret_1 180 -0.0052 -0.0023 0.0058 0.0040 0.0063 0.0114 t-stat 0.098 0.090 0.093 0.085 0.087 1.171 1.490 ret_3 180 -0.0033 0.0042 0.0166 0.0171 0.0143 0.0176 t-stat 0.188 0.167 0.177 0.153 0.156 0.970 1.390 ret_6 180 -0.0165 0.0042 0.0159 0.0230 0.0135 0.0300 t-stat 0.208 0.203 0.207 0.170 0.202 1.389 1.840 ret_12 180 -0.0377 0.0121 0.0289 0.0236 0.0739 0.1116 t-stat 0.279 0.290 0.286 0.252 0.307 3.609 4.700 ret_24 180 0.0946 0.1674 0.1179 0.1776 0.2833 0.1887 t-stat 0.486 0.458 0.407 0.443 0.513 3.585 5.040 ret_36 180 0.1540 0.2555 0.2237 0.2857 0.4364 0.2824 t-stat 0.501 0.558 0.472 0.458 0.503 5.334 6.880
type 4 ret_1 180 -0.0034 0.0033 0.0014 0.0041 0.0090 0.0124 t-stat 0.102 0.093 0.084 0.084 0.090 1.224 1.380 ret_3 180 -0.0124 0.0097 -0.0010 0.0119 0.0313 0.0437 t-stat 0.167 0.171 0.147 0.148 0.164 2.509 2.710 ret_6 180 -0.0406 0.0192 -0.0007 0.0272 0.0438 0.0844 t-stat 0.199 0.208 0.202 0.190 0.197 4.041 4.100 ret_12 180 -0.0391 0.0102 0.0149 0.0599 0.0933 0.1324 t-stat 0.296 0.286 0.302 0.293 0.282 4.348 4.620 ret_24 180 0.1046 0.1534 0.1304 0.2492 0.2564 0.1517 t-stat 0.492 0.459 0.464 0.515 0.451 3.050 3.280 ret_36 180 0.1909 0.1937 0.2297 0.3324 0.3891 0.1982 t-stat 0.542 0.497 0.564 0.567 0.471 3.701 3.320 type 5 ret_1 180 0.0019 0.0121 0.0162 0.0083 0.0076 0.0057 t-stat 0.111 0.121 0.115 0.097 0.097 0.515 0.440 ret_3 180 0.0069 0.0479 0.0374 0.0275 0.0217 0.0148 t-stat 0.212 0.226 0.218 0.177 0.170 0.730 0.870 ret_6 180 0.0243 0.0494 0.0608 0.0469 0.0704 0.0462 t-stat 0.283 0.269 0.280 0.246 0.265 1.598 1.980 ret_12 180 0.0471 0.0424 0.0878 0.0654 0.1006 0.0535 t-stat 0.296 0.339 0.331 0.275 0.321 1.643 1.850 ret_24 180 0.1236 0.0695 0.1803 0.2291 0.3088 0.1853 t-stat 0.381 0.468 0.478 0.413 0.558 3.680 2.090 ret_36 180 0.2711 0.1584 0.3004 0.4176 0.5667 0.2956 t-stat 0.577 0.491 0.548 0.444 0.562 4.923 4.550 type 6 ret_1 180 -0.0055 -0.0021 0.0000 0.0124 0.0080 0.0135 t-stat 0.103 0.089 0.110 0.101 0.102 1.249 1.660 ret_3 180 -0.0085 -0.0027 0.0159 0.0300 0.0130 0.0215 t-stat 0.190 0.175 0.226 0.166 0.209 1.020 1.470 ret_6 180 -0.0084 -0.0225 0.0359 0.0320 0.0082 0.0167 t-stat 0.241 0.236 0.249 0.185 0.268 0.619 0.750 ret_12 180 -0.0268 -0.0083 0.0933 0.0516 0.0573 0.0842 t-stat 0.327 0.349 0.438 0.294 0.462 1.996 1.740 ret_24 180 0.0874 0.1077 0.2397 0.2371 0.2807 0.1933 t-stat 0.503 0.459 0.545 0.489 0.625 3.233 3.360 ret_36 180 0.1756 0.1371 0.3805 0.3619 0.5094 0.3338 t-stat 0.515 0.440 0.583 0.483 0.796 4.725 4.510
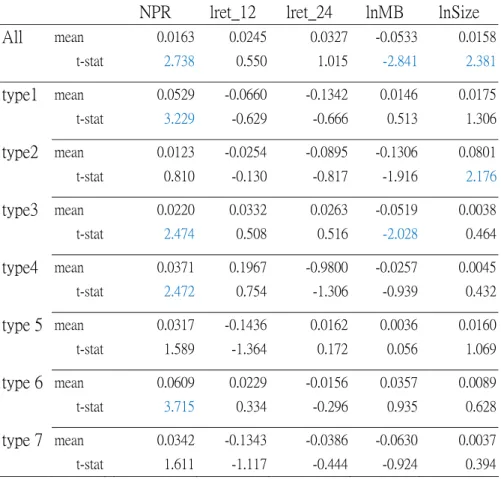
Table 6 The Regression on NPR for Each Type of Insiders
All events of insiders trading are classified into seven groups according to the types of insiders, which are Board members or supervisors (type 1), Chairman or Vice Chairman of the board (type 2), President and Vice President (type 3), Senior Executives (type 4), Mid-level Managers and others (type 5), Block holders (type 6), and Institutions (type 7). Then, for each group, Fama-McBeth regressions are executed. In each regression, returns are regressed on NPR, proceeding12-month return, proceeding 24-month return, log of MB ratio, and log of firm size.
NPR lret_12 lret_24 lnMB lnSize
All mean 0.0163 0.0245 0.0327 -0.0533 0.0158 t-stat 2.738 0.550 1.015 -2.841 2.381 type1 mean 0.0529 -0.0660 -0.1342 0.0146 0.0175 t-stat 3.229 -0.629 -0.666 0.513 1.306 type2 mean 0.0123 -0.0254 -0.0895 -0.1306 0.0801 t-stat 0.810 -0.130 -0.817 -1.916 2.176 type3 mean 0.0220 0.0332 0.0263 -0.0519 0.0038 t-stat 2.474 0.508 0.516 -2.028 0.464 type4 mean 0.0371 0.1967 -0.9800 -0.0257 0.0045 t-stat 2.472 0.754 -1.306 -0.939 0.432 type 5 mean 0.0317 -0.1436 0.0162 0.0036 0.0160 t-stat 1.589 -1.364 0.172 0.056 1.069 type 6 mean 0.0609 0.0229 -0.0156 0.0357 0.0089 t-stat 3.715 0.334 -0.296 0.935 0.628 type 7 mean 0.0342 -0.1343 -0.0386 -0.0630 0.0037 t-stat 1.611 -1.117 -0.444 -0.924 0.394
計畫成果自評部份 1. 研究內容與原計畫相符程度、達成預期目標情況 本報告為三年計畫的第一年期中報告,原計畫中,第一年最基本也是 最重要的目標在於找出內部人交易資料,由於本研究與過去研究最大的不 同點,在於不是直接採取現有內部人申報的資料,而是從逐筆的交易資料 中對應出內部人交易資料,因此在判定上需要相當嚴謹的對應條件與周詳 的考量,也因而花費相當多的時間。 在挑選出內部人交易資料後,第一年的規劃是以完整的內部人交易資 料,驗證內部人交易是否具有資訊內涵。而實證結果確實證實了內部人的 淨買行為與交易後的公司股票報酬率有顯著的相關。這顯示出與過去文獻 採用申報資料的研究發現不同。 接著第一年的計畫中,也規劃針對各種不同的情境予以驗證,本報告 則針對不同的公司特性與樣本期間,進行探討。結果,各類公司的內部人 淨買仍然都與公司未來的股票報酬攸關。因此基本上,本報告符合了原計 畫的預期目標。 此外,原訂第二年要探討不同類型公司內部人的資訊內涵也在本報告 中,進行了初步的研究。發現各類公司內部人的資訊內涵似乎有些不同, 而且對市場的影響也不盡相同。 2. 主要發現或其他有關價值、研究成果之學術或應用價值 過去文獻採用不同的資料來源,對於內部人交易的資訊內涵有不太一致 的結論。本報告則突破了過去文獻資料上的限制,利用較完整的交易資料, 進行驗證。結果實證了公司內部人交易的資訊內涵確實存在,與過去採用 申報資料的研究發現不同。因此對學術與實務上具有參考價值。 而且,本報告發現近年的內部人交易比以前年度的內部人交易更具有 資訊內涵,持股 10%以上大股東的資訊內涵從交易後三個月開始顯現,且 其交易與對市場影響最為顯著,這些發現都相當值得實務與後續研究的重 視。 3. 是否適合在學術期刊發表或申請專利 由於資料的更為完整,研究結論應較過去文獻更為可信。而且,本報告 提出過去研究尚未發現的結論。因此,未來將於進一步修改後,投稿至學 術期刊。